Daily Report : Weekly Wrap for Aug 20 - Weak Internals, Super Trends, Dollar Breakout

| View/Print a PDF version of this Report |
Headlines
|
Weekly Wrap for Aug 20 - Weak Internals, Super Trends, Dollar Breakout: This week, markets saw an increased split on the Nasdaq exchange, leading to more technical warning signs. Overall market breadth has been lagging as well. Price trends have been so strong that future returns are weaker than average, same goes for some fundamental indicators like LEI. Bottom Line: See the Outlook & Allocations page for more details on these summaries STOCKS: Hold BONDS: Hold GOLD: Hold |
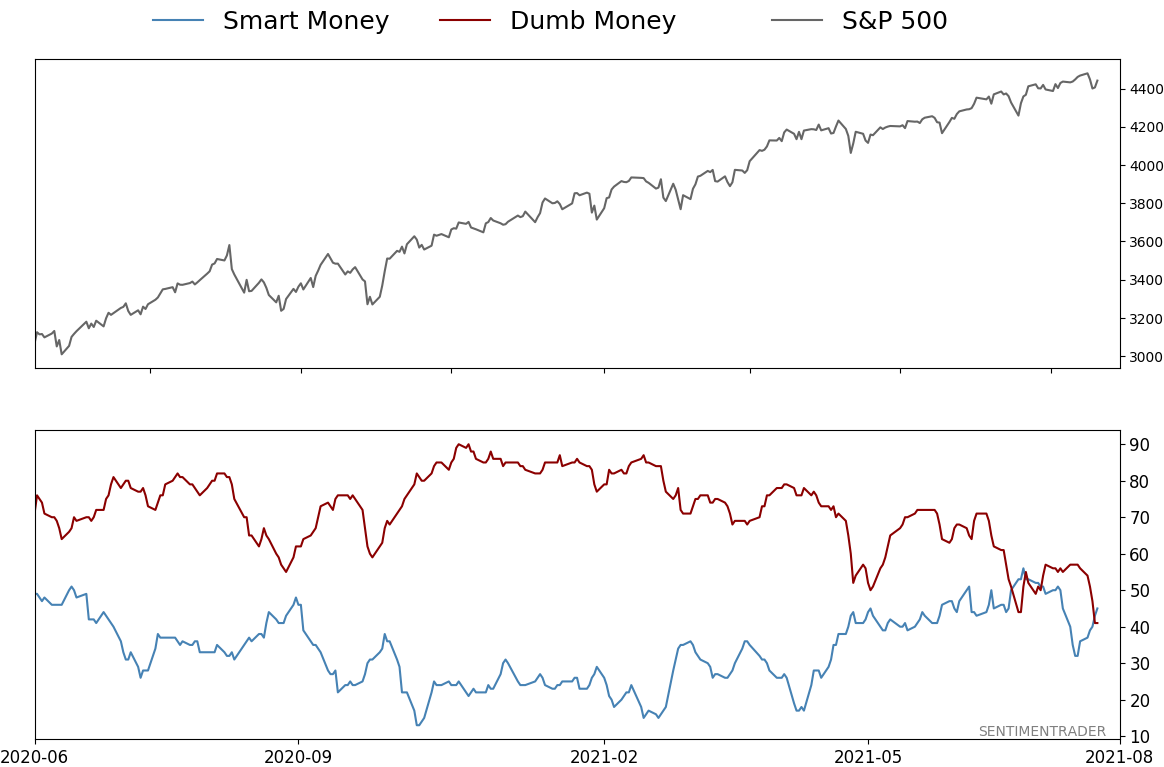
Smart / Dumb Money Confidence
|
|
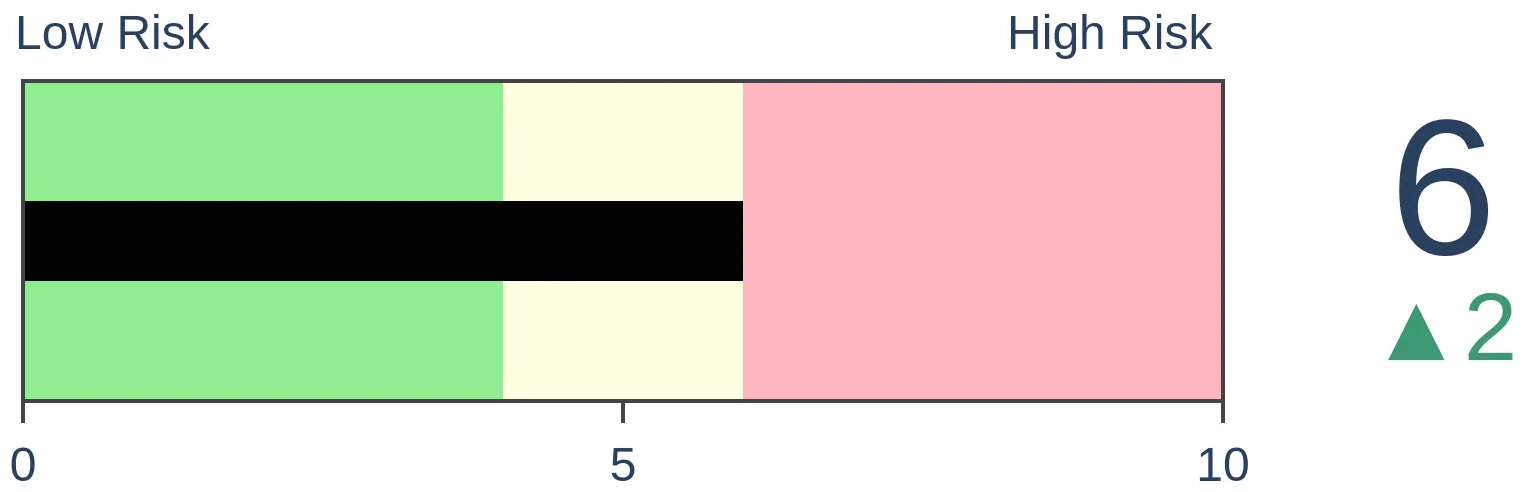
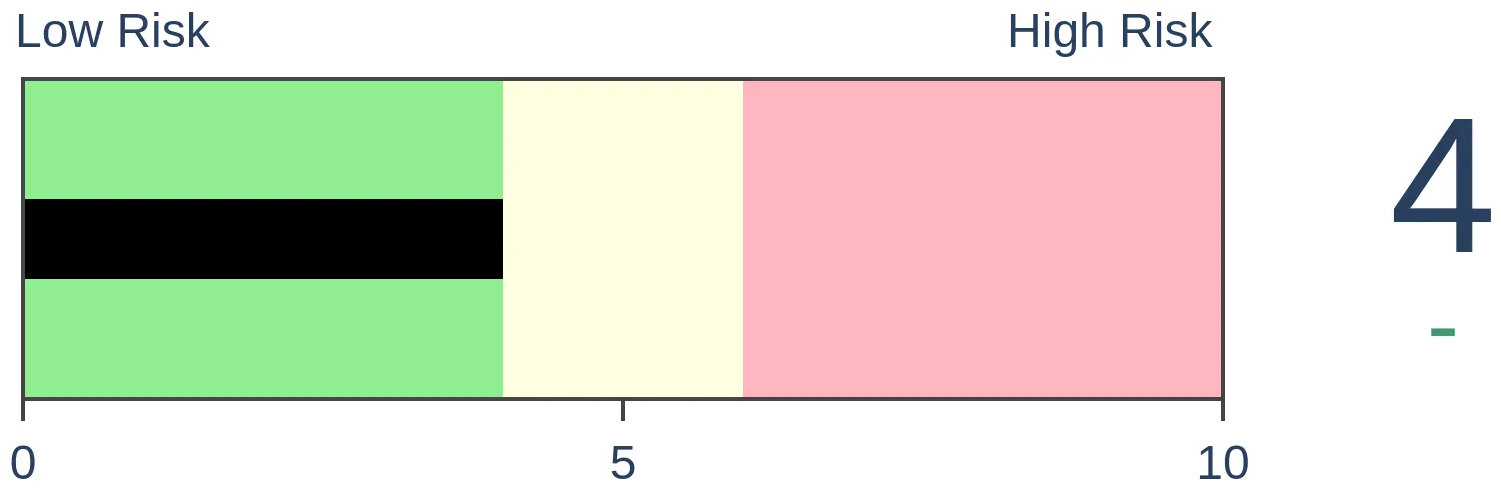
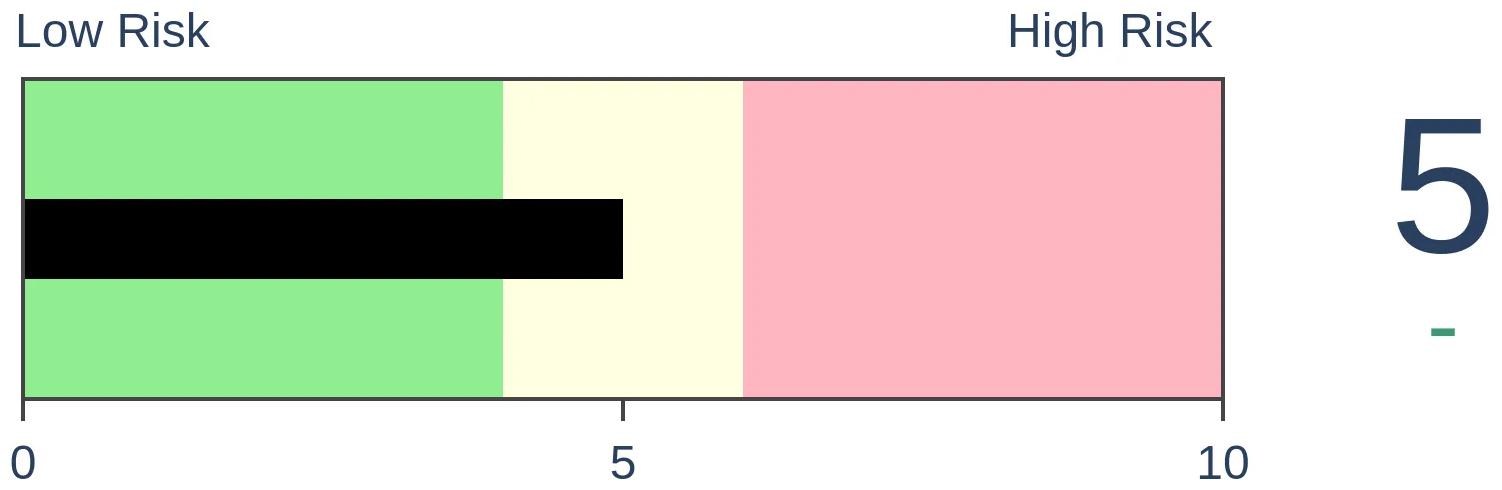
Risk Levels
|
|

|


Research
Weekly Wrap for Aug 20 - Weak Internals, Super Trends, Dollar BreakoutBy Jason GoepfertBOTTOM LINEThis week, markets saw an increased split on the Nasdaq exchange, leading to more technical warning signs. Overall market breadth has been lagging as well. Price trends have been so strong that future returns are weaker than average, same goes for some fundamental indicators like LEI. FORECAST / TIMEFRAME |
The goal of the Weekly Wrap is to summarize our recent research. Some of it includes premium content (underlined links), but we're highlighting the key focus of the research for all. Sometimes there is a lot to digest, with this summary meant to highlight the highest conviction ideas we discussed. Tags will show any symbols and time frames related to the research.
| STOCKS | ||
 |  |  |
In decades past, it used to be easy to feel like we had a grasp on what breadth was doing under the major market indexes. Simply ask whether the NYSE Cumulative Advance/Decline Line was hitting new highs or not.
If it was, along with the Dow Industrials or S&P 500, then everything was kosher. If not, well, then there could be trouble.
If we stick to the old school and simply look at the NYSE A/D Line, things don't look too bad. It's hanging in there along with the major indexes. About the only potential negative is that it hasn't reached a new high for a couple of months. The S&P 500, meanwhile, has closed at a new high 18 times.
When we look at two-month windows (42 trading days) and tabulate how many 52-week highs the S&P 500 scored without any concurrent new highs in the A/D Line, this is the widest divergence in 25 years.
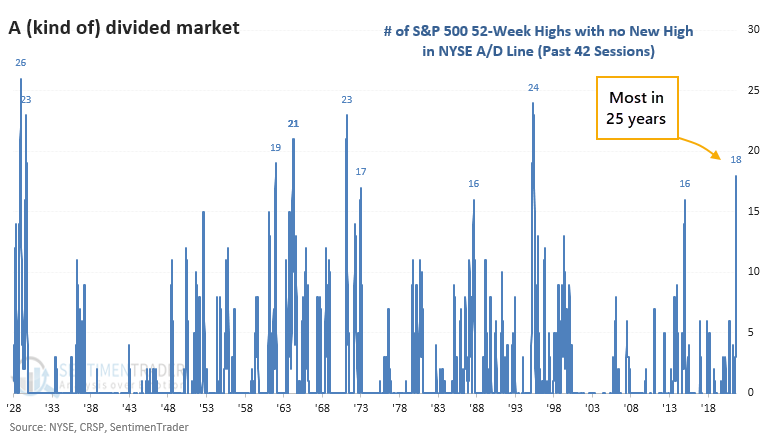
The last time the S&P scored so many new highs without a new high in the A/D Line was 1995, which preceded one of the greatest runs in stock market history. It also triggered before a nice rally in 1964 (which ultimately failed). The other precedents, though, were not nearly as kind.
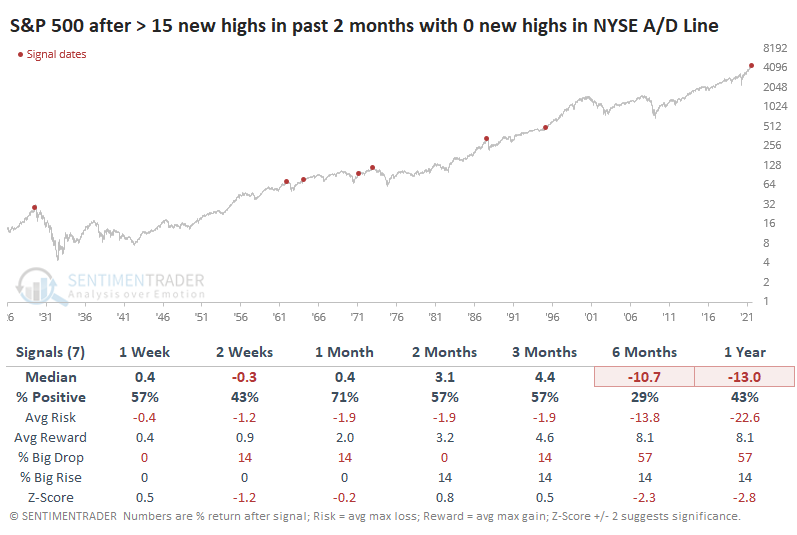
While the S&P managed to hold up most of the time over the medium-term, it ran into trouble over the next 6-12 months after 5 of the 7 signals.
It would be better if the indexes' pure price momentum were accompanied by similar momentum in many breadth metrics. It's not ridiculously egregious like it was in 2000 or even 2015. Still, it's enough to cast a wary eye over the short- to medium-term as stocks creep higher with seemingly no repercussions.
EVEN WORSE ON THE NASDAQ
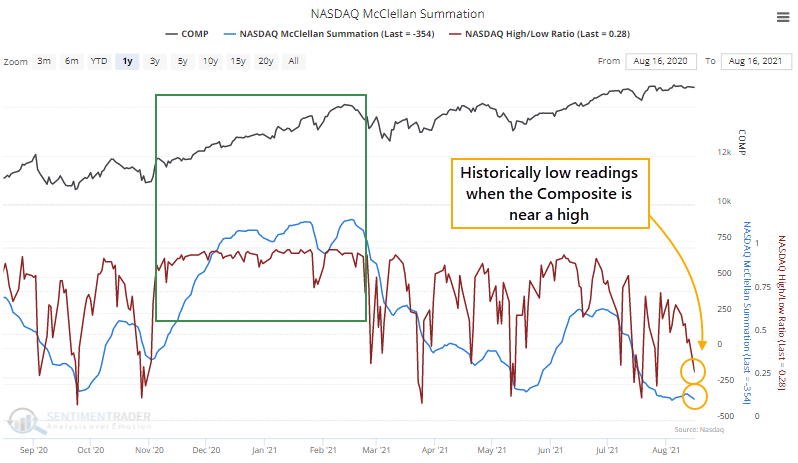
On Monday, the Nasdaq Composite closed within 1% of a 52-week high, and yet two long-term measures of breadth on that exchange fell to very low levels. The McClellan Summation Index closed below -350, and the New High / New Low Ratio was below 30%.
Those are the worst figures in history, dating back to 1986, for a day when the Composite was so near a high. It's in stark contrast to the huge positive momentum thrust from November through February.
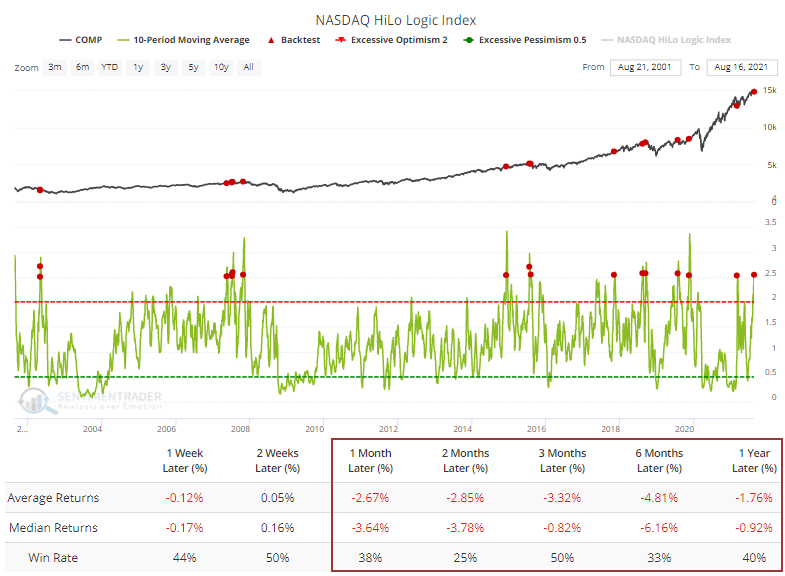
Looking at lesser extremes, there was still a tendency to see a short-term shakeout. Every signal since 2007 has led to short-term losses in the Composite. The fact that there are so many 52-week highs and 52-week lows simultaneously means that the HiLo Logic Index has spiked. The 10-day average moved above 2.5, which the Backtest Engine shows has been a terrible sign during the past 20 years.
This internal tumult has triggered some technical warning signs, such as the Hindenburg Omen and Titanic Syndrome for the Nasdaq exchange. Over the past 30 sessions, a combined 13 signals have been triggered, the most in six years.
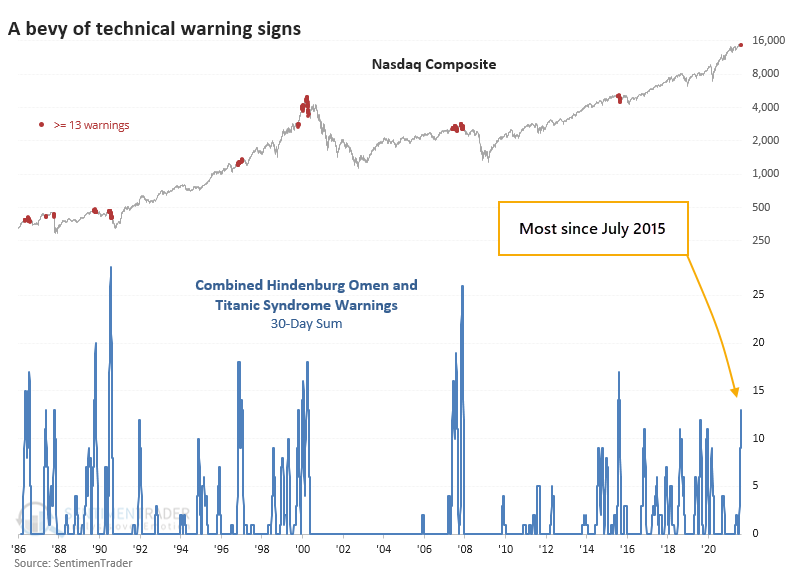
When there has been such a cluster of signals with the Composite within spitting distance of a new high, trouble was brewing most of the time. The Nasdaq escaped any damage in 1996, 1999 (for a while), and 2016 but otherwise witnessed high volatility and negative returns.
This happened in 2013-14, which led to a choppy 2015. And it happened in 2017, which led to a rocky 2018. After the speculative blow-off in late January - early February of this year, we've been on the lookout for major deterioration under the surface of the indexes. There have been periodic bouts of that since then, and the indexes have almost immediately recovered. We'll have to see if this is yet another episode.
HEAVY SMALL-CAP SELLING PRESSURE
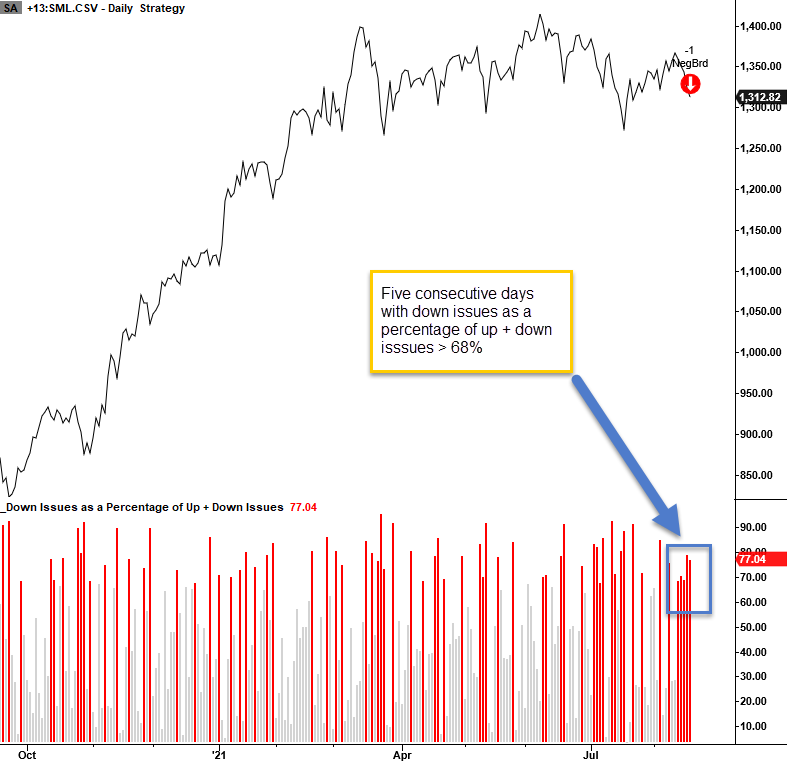
Dean showed that the S&P 600 small-cap index recorded five consecutive days with more than 68% of issues declining. The weak breadth pattern is typically only seen during major market corrections or bear markets. The last instance occurred during the pandemic crash.
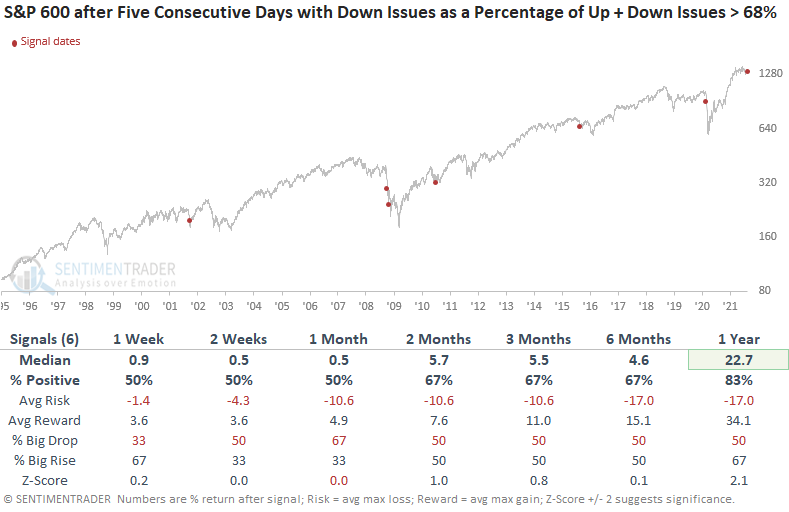
Results after similar patterns look somewhat anemic during the first month and then get better through time. With signals occurring during corrections and bear markets (and small sample size), it's not a total surprise to see solid 1-year numbers.
AT LEAST THE PRICE TRENDS ARE STRONG
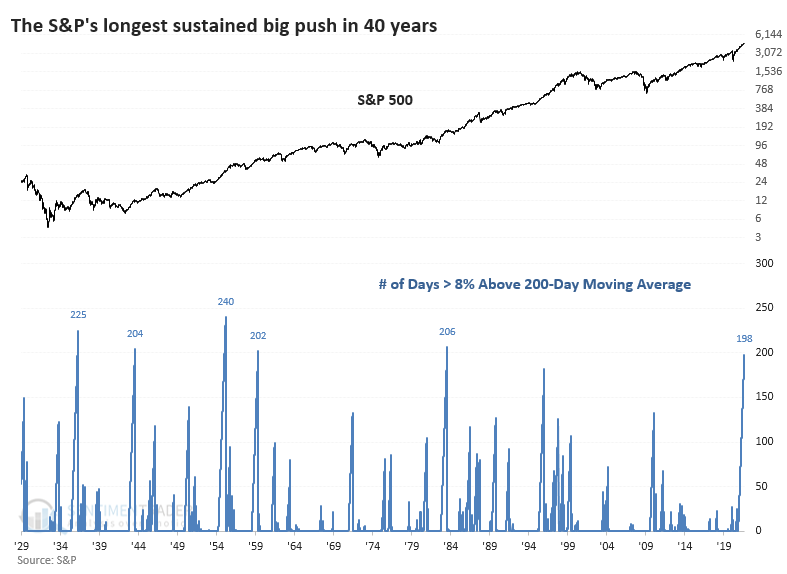
This has been a year for the record books, as we've seen from several different perspectives lately. We can add to that the length of super-strong trends in both the S&P 500 and Dow Industrials.
The S&P has been more than 8% above its 200-day moving average since last fall. At nearly 200 consecutive trading days this far above trend, the current streak ranks among the best in the S&P's history and the longest in 40 years.
By the time it reached the current length, other super-strong trends saw buyers take a break.
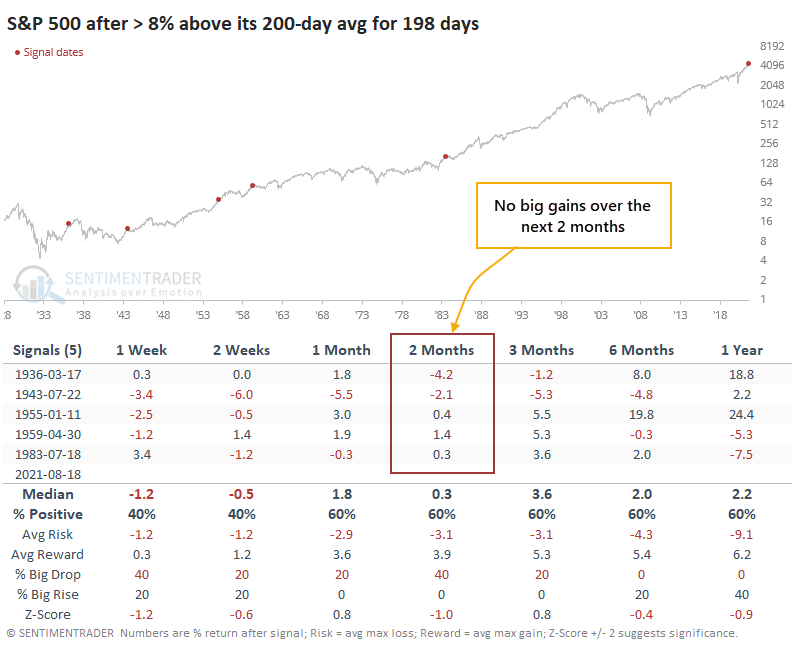
Looking at the Risk/Reward Table, the 2-month time frame was uninspiring. Three of the five signals had a higher risk than reward, and the other two weren't much better.
The Dow hasn't been quite as strong, holding "only" 6% above its long-term moving average. For the Dow, this ranks among the longest super-strong trends in 120 years. The Dow also tended to struggle with inconsistent returns after such a massive run. Only 3 of the 9 signals ended up leading to runaway bull markets, with the others preceding negative or tepid short- to medium-term returns.
The momentum streaks that we've looked at from different perspectives have been somewhat consistent in their message - by the time buyers have persisted to the degree they have now, for as long as they have now, future returns over the coming months were mediocre at best, and often negative. But whatever pullbacks or corrections they preceded tended to be limited, with almost none of them leading to sustained bear markets.
A WAY TO TRADE IT
Jay took an in-depth look at a way to trade the idea that upside could be limited over the next two months in the form of a Bear Call Spread.
By selling a call option with a strike above SPY's likely maximum upside according to the table above, and buying another call with a strike price above that, a trader can construct a position that has a high probability of success, with a good chance to make a good return in a short period of time, but that does have relatively high risk relative to its potential reward.
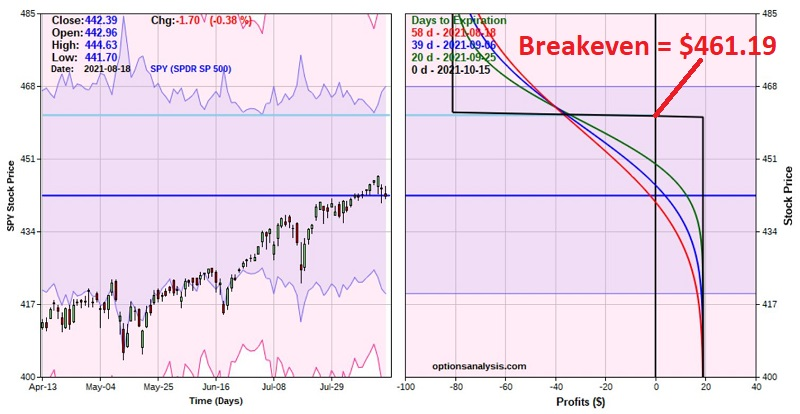
Consider the following:
- This position has an above-average statistical probability of profit (because SPY can rally 4%, and the trade will still earn the maximum profit)
- However, there are 4 times as much risk as there is profit potential
- For the record, this type of tradeoff is not at all uncommon when "selling option premium."
- This 1-to-4 max reward-to-max risk ratio means that this is NOT a "Set it and Forget it" type of trade (a plan to minimize risk and a willingness to act if need be are essential requirements)
The key point here is that we do not want to wait until expiration and suffer the maximum loss if this trade goes against us. As a result, before we can fully assess whether or not to enter the trade in the first place, we need to consider how we might manage this trade to mitigate some of the potential risks.
A REMARKABLE YEAR, PART INFINITY
Jay showed that in terms of drawdown performance, 2021 is in rare company but is not unprecedented.
The current maximum drawdown (the largest peak-to-valley decline within a given calendar year) for 2021 is -4.2%. In the past 93 years, there have been 3 years that witnessed a maximum drawdown for the full year that did not exceed -4.2%.
Those "Goldilocks" years were:
- 1995 - maximum Intra year drawdown of -2.5%
- 2017 - maximum Intra year drawdown of -2.8%
- 1964 - maximum Intra year drawdown of -3.5%
The table below displays the 10 years since 1928 with the smallest Intra year close-to-close decline.
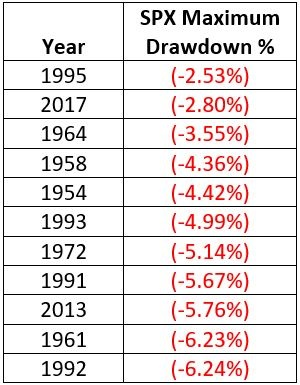
While it may sound ominous to some that the maximum drawdown so far this year is a mere -4.2%, the table above argues that it does not necessarily portend that some major decline is lurking out there before the end of the year.
September has historically been the worst-performing month for the market, and October has a history of sharp, occasional selloffs, so investors must pay close attention in the months ahead. On the positive side, just because the market has been strong so far throughout the year IS NOT by itself a sign that trouble lies ahead.
FUNDAMENTALS ARE STRONG, TOO
Dean reviewed data for global leading economic indicators with some tables, charts, and signals to see how the economic recovery is tracking through the lens of the stock market.
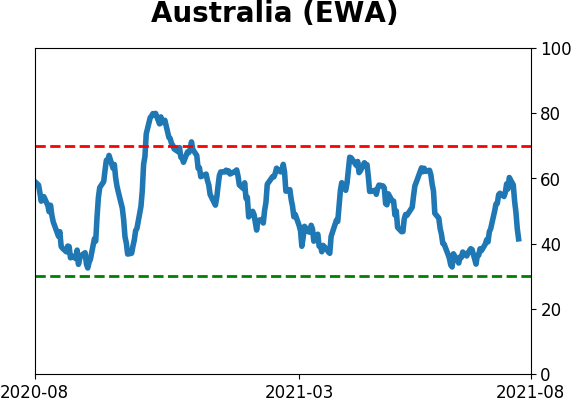
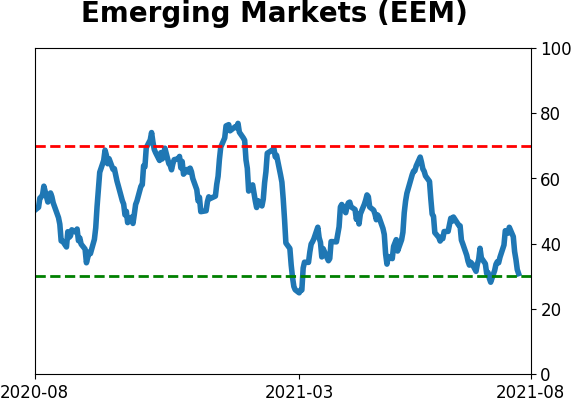
Composite leading indicators remain in expansion territory for many countries, and the LEI's are rising on a one and three-month basis. The percentage of countries with a composite leading economic indicator value of 100 or greater continues to rise and recently crossed above 72%.
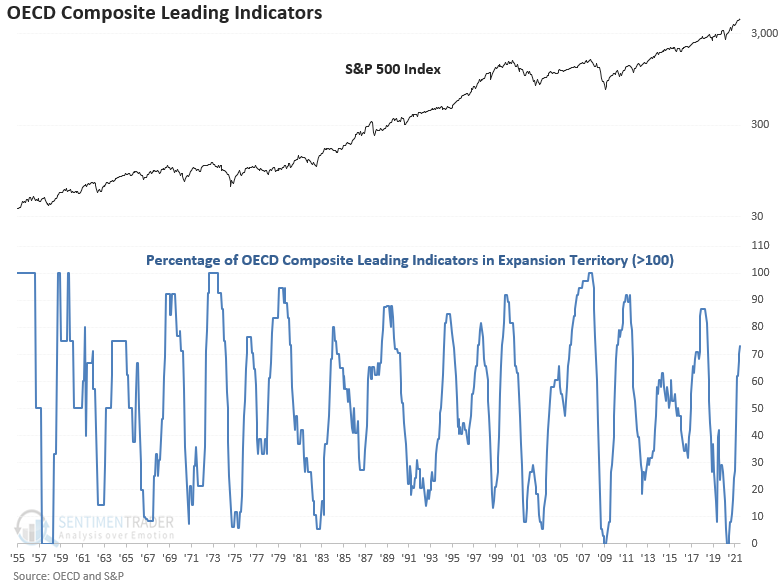
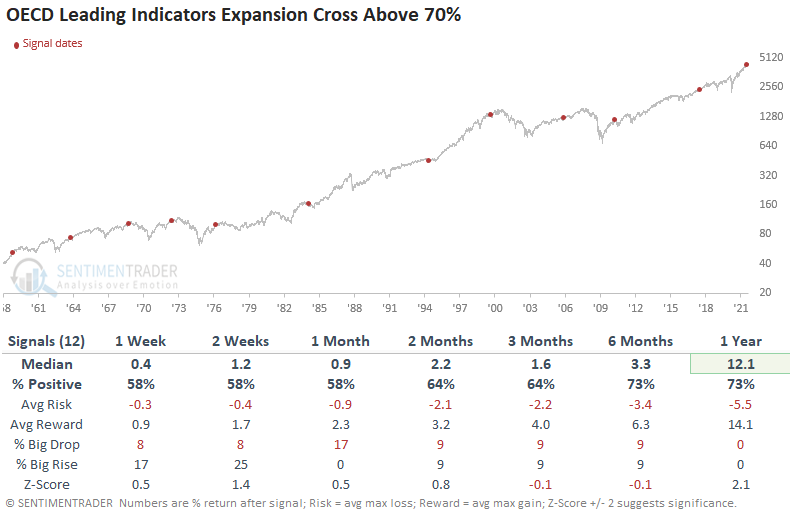
Besides the 1-year timeframe, returns look somewhat muted after similar thrusts. Once the percentage of countries reaches 70%, the market is susceptible to a consolidation/correction as central bank policy is less accommodative.
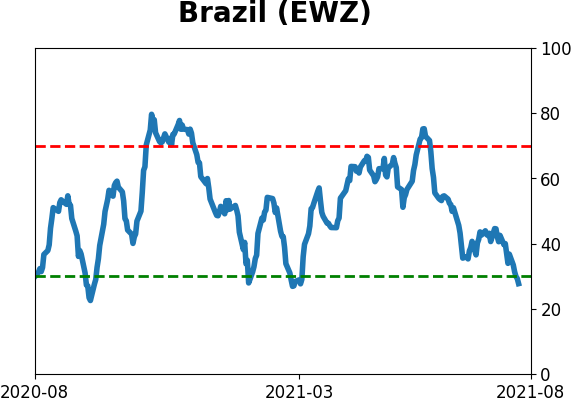
As long as the LEI data maintains a positive bias, the backdrop for the stock market should remain constructive. If central bank policy triggers a negative response in LEI (like it's doing now in Brazil), then the outlook will get much cloudier.
INFLATION BOGEYMAN, PART II
Last week, Jay highlighted the history of the performance of the Dow Jones Industrial Average based on different levels of inflation, as calculated using the 12-month rate-of-change for the Producer Price Index.
This week, he created a simple model to highlight periods when inflation (or deflation) poses a risk to the stock market. The focus will be entirely on avoiding the stock market when inflation risks are at their highest.
For evaluation and trading purposes, we will use the following rules:
- IF PPI 12-month Inflation (as calculated above) is greater than -12% AND less than 9%, HOLD STOCKS
- IF PPI 12-month Inflation (as calculated above) is less than or equal to -12% OR greater than or equal to 9% AVOID STOCKS
When conditions are "favorable," the cumulative result in the Dow Industrials is a gain of +783,668%. The chart below displays the cumulative % +(-) for the Dow since 1914 if held only when PPI inflation is EITHER less than or equal to -12% OR greater than or equal to +9%. The cumulative result is a loss of -92.5%.
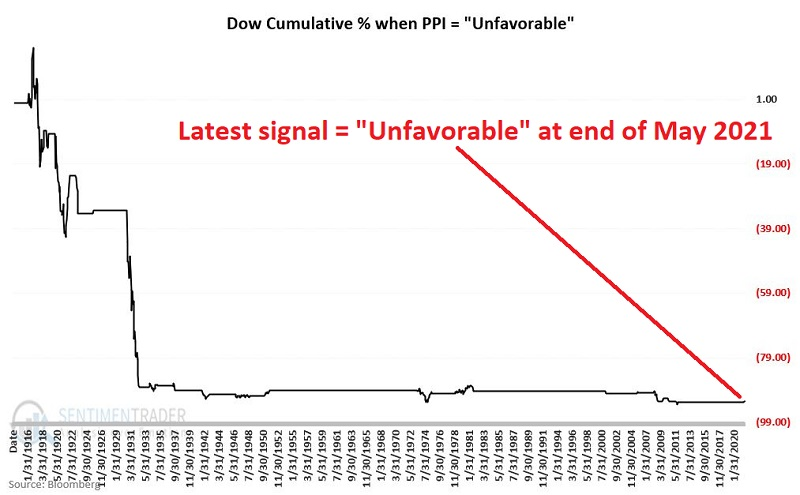
During favorable periods, the Dow gained 19 times and lost ground 5 times. When conditions were unfavorable (like now), it gained 12 times but lost 11 times.
INFLATION EATING AWAY AT CONSUMER SENTIMENT
Politics is playing havoc with how people feel about everyday life, and it's even overriding how they usually feel about topics that aren't necessarily as influenced by our representatives.
The preliminary Consumer Sentiment survey for August by the University of Michigan showed a stunning drop. This is an abnormally low reading given how the S&P 500 has fared over the past year. There is a positive correlation between the 12-month rate of change in the S&P and the Consumer Sentiment readings, and this month really stands out as an outlier.

Assuming the S&P doesn't completely fall apart in the coming weeks, this month's reading would be the 2nd-lowest all-time for any month when stocks closed at a 12-month closing high. Only December 1991 would have a lower reading.
A low Consumer Sentiment reading during a month when the S&P closed at a new high tended to be a good sign.
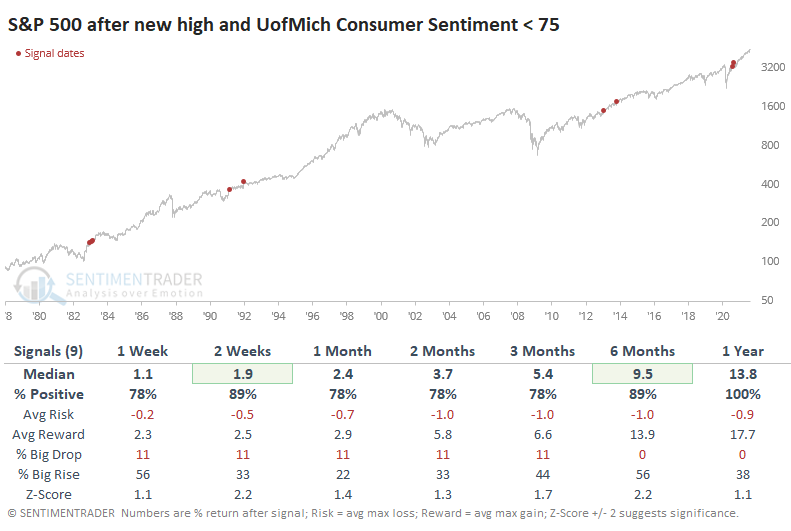
Across all time frames, the S&P's returns were above average, with an excellent risk/reward ratio. Losses were minimal, and a year later, there were none of them.
But...big misses in the sentiment number, relative to what economists had been expecting, led to worse returns. And these figures could change substantially when the official sentiment numbers are released at the end of the month, so we're not currently putting a lot of weight on this signal.
STOCKS AND SECTORS - ASIA PACIFIC
Dean updated his absolute and relative trend following indicators for domestic and international ETFs.
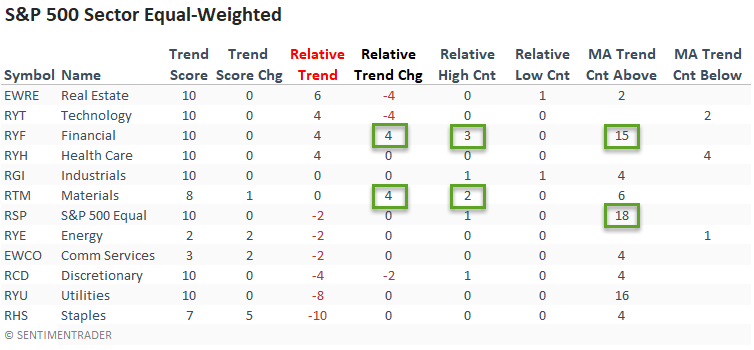
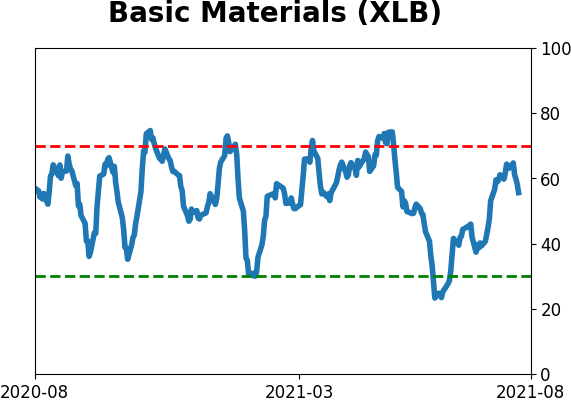
The relative trend score for the financial sector registered a six-point increase on a w/w basis. And, it recorded a new 1-month relative high on 3/5 days. If we look at short-term price momentum, we see that the sector has traded above its 10-day moving average for 15 consecutive days. The materials sector, a value/cyclical group, joined the financials with improving relative trends.
The equal-weighted financial and materials sectors confirmed the improving relative trend profile in the cap-weighted data.
The percentage of countries in the Asia Pacific region with a relative trend score of -10 remains at a concerning level.
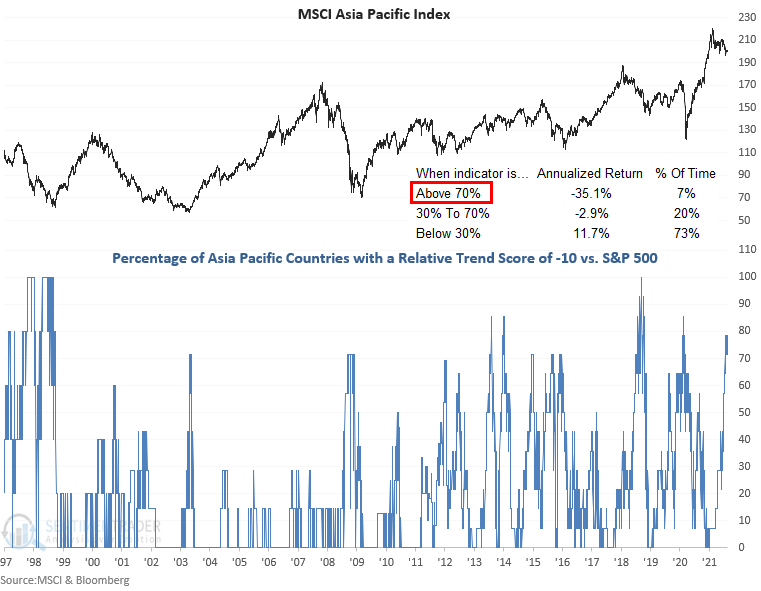
With an annualized return of -35.1% when more than 70% of Asia Pacific countries have a maximum negative trend score, the outlook for that region right now is questionable.
STOCKS AND SECTORS - TRANSPORTS
Dean pointed out that the S&P 1500 Transportation Industry Group registered a reverse-up buy signal on Monday. The concept identifies when an asset closes at a 1-month low and reverses higher to close at a 1-month high in less than ten trading days.
When this signal is triggered but the transports have not made a new high in more than 2-months, and the industry is trading down greater than 5% but less than 15% from a 252-day high (a consolidation), forward results look good in the short term, even though none of the timeframes showed a notable z-score.
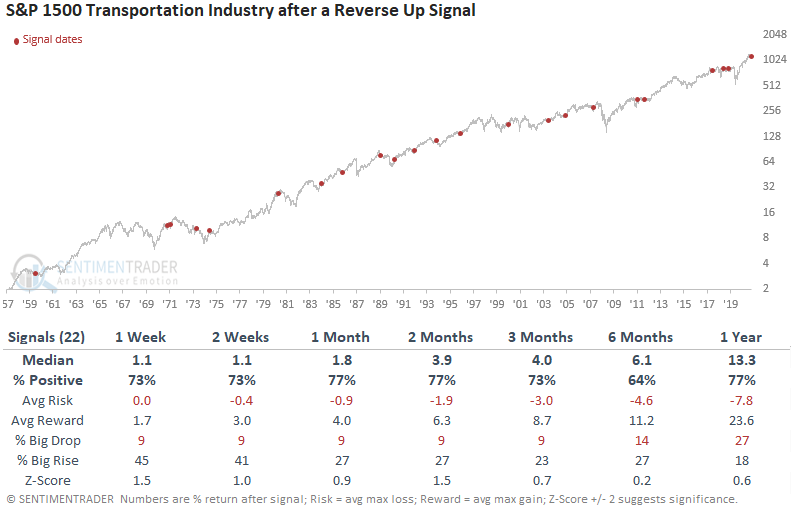
This is a modestly positive sign for the sector after a reversal signal showing a consistent tendency to identify lasting reversals.
STOCKS AND SECTORS - BRAZIL
Brazilian stocks have been getting smoked since June. The Ibovespa is down about 10% from its peak, while the EWZ fund traded in the U.S. and priced in dollars is down more than 15%.
This has started to generate some extremes. Nearly 20% of stocks in the Ibovespa fell to a 52-week low this week. Using the Backtest Engine to look for readings this high when the 200-day moving average is rising, it preceded gains in the Ibovespa over the next 6 months every time.
The latest puke-fest triggered an oversold reading in more than 35% of the stocks. Once again, the Engine shows few losses over a medium- to long-term time frame.
Here's the kicker - the recent internal momentum has been so poor that the McClellan Summation Index for the Ibovespa dove below -1300, one of the worst readings we've seen. The Engine shows no losses over the following year, with a whopping average return of +42%.
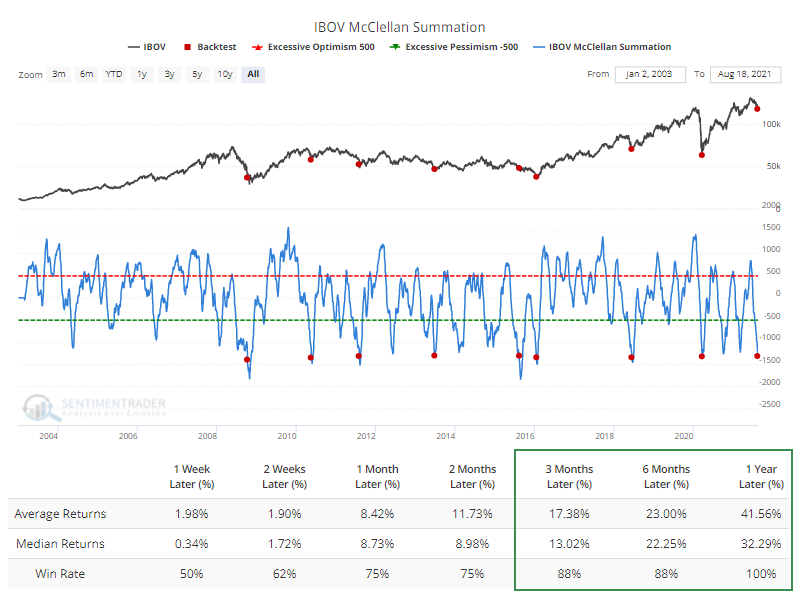
Ideally, we'd see a quick spike in 52-week lows to 40%+ of all issues and then a rebound. That has marked the largest lows but also came after much greater losses. For intermediate-term declines, the current extremes are about as egregious as it gets. The Summation Index extreme is compelling for those looking for longer-term opportunities.
| COMMODITIES | ||
 |  | |
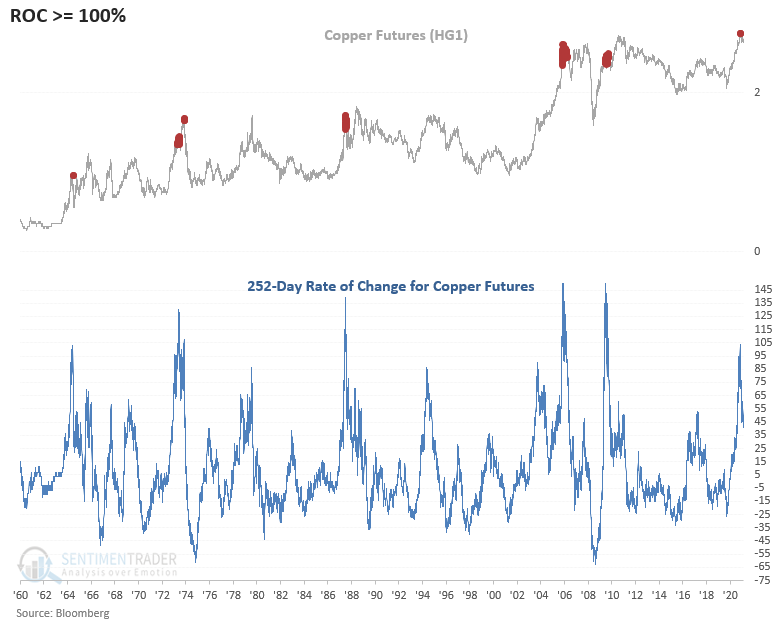
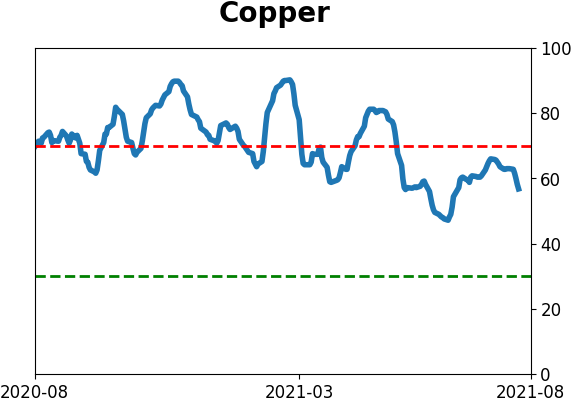
Until its peak in May, copper had been ripping higher in one of the strongest rallies from a significant low in history. The rally was so substantial that the 252-day rate of change crossed above 100%. Typically, you see a correction in price that slows the upside momentum. Once the strong momentum is gone, the market is more vulnerable to a correction that can flip the trend from positive to negative.
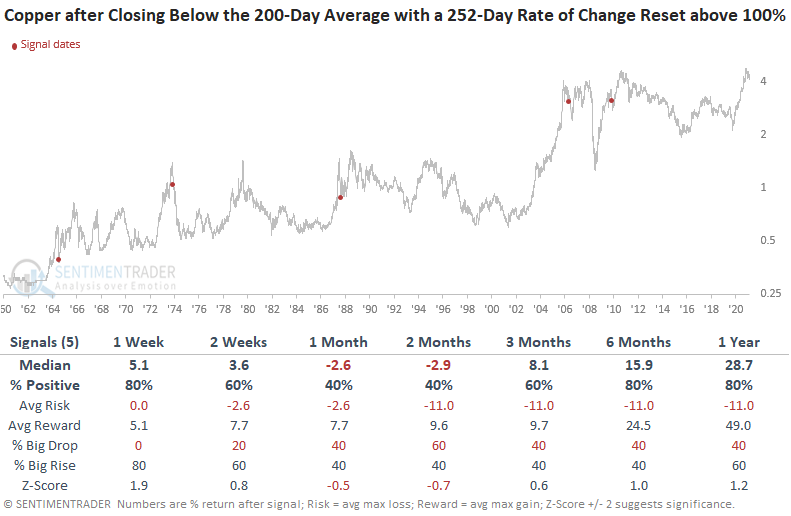
So, Dean conducted a study to assess the forward return outlook for copper when the metal closes below its 200-day average after the 252-day rate of change for copper had crossed above 100%.
Since 1959, the 252-day rate of change for copper has crossed above 100% only six times. Momentum off the pandemic crash low was historic.
One can see a pretty clear pattern even though the sample size is small. Once copper closed below the 200-day average, it tended to rebound in the short term. After the bounce ran its course, the metal would back and fill lower, followed by a resumption of the uptrend. 1974 is the exception.
A SOFT SPOT FOR ENERGY
Jay showed that there is good news and bad news in the energy sector. One piece of bad news is that energy stocks have suffered in September.
The chart below displays the Annual Seasonal Trend for ticker XLE (Energy Select Sector SPDR Fund ).
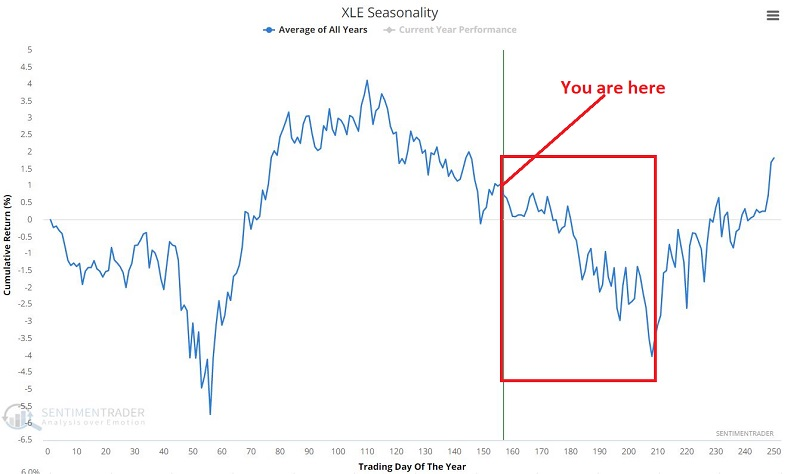
The table below displays the cumulative % return for the S&P 500 Energy Sector by month from January 1953 through December 2020.
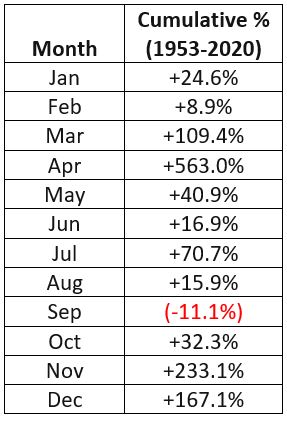
For the record, September has shown a gain 35 times and a loss 33 times. So, we are basically talking about a coin flip. It just tends to lose more when it loses than it gains when it rallies.
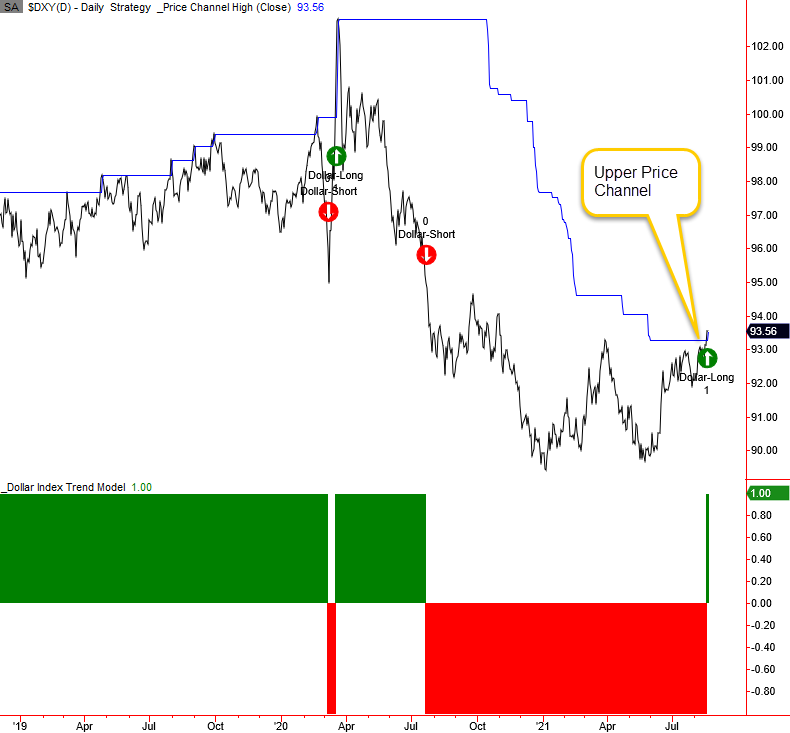
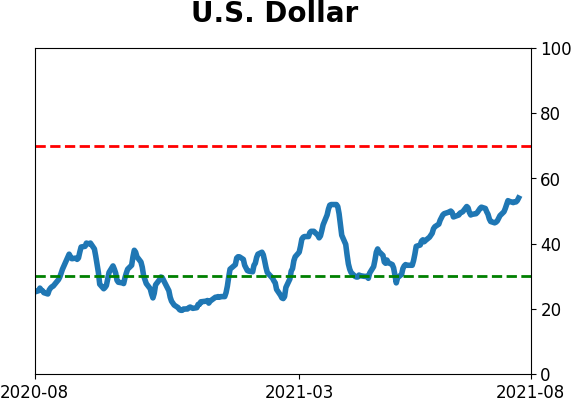
DEPENDS ON THE DOLLAR
The trend following system that Dean uses for the Dollar Index (DXY) is a straightforward one. He uses the price channel breakout system created by Richard Donchian, the father of trend following.
After an optimization process, Dean showed that when the closing price of the Dollar Index closes above the highest close in the previous 148 days, the system buys the Dollar Index. Conversely, when the Dollar Index closes below the lowest close in the last 148 days, the system sells or shorts the Dollar Index.
A new uptrend was established on 8/19/21 when the Dollar Index closed above the 148-day price channel high.
Results look solid across all timeframes with several notable z-scores.
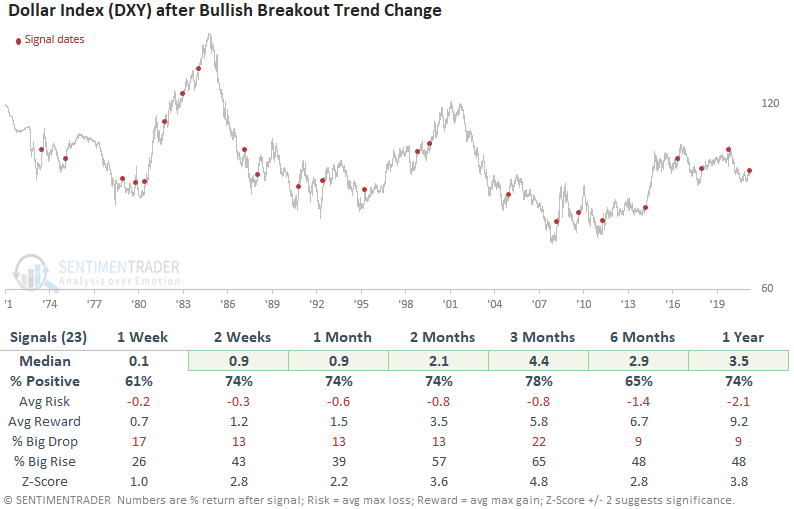
Because the dollar tended to rally after these breakout signals, other markets like commodities and gold tended to decline over the medium term. Dean also looked at sector and factor equity performance, with one of the best areas for forward returns being Value stocks.
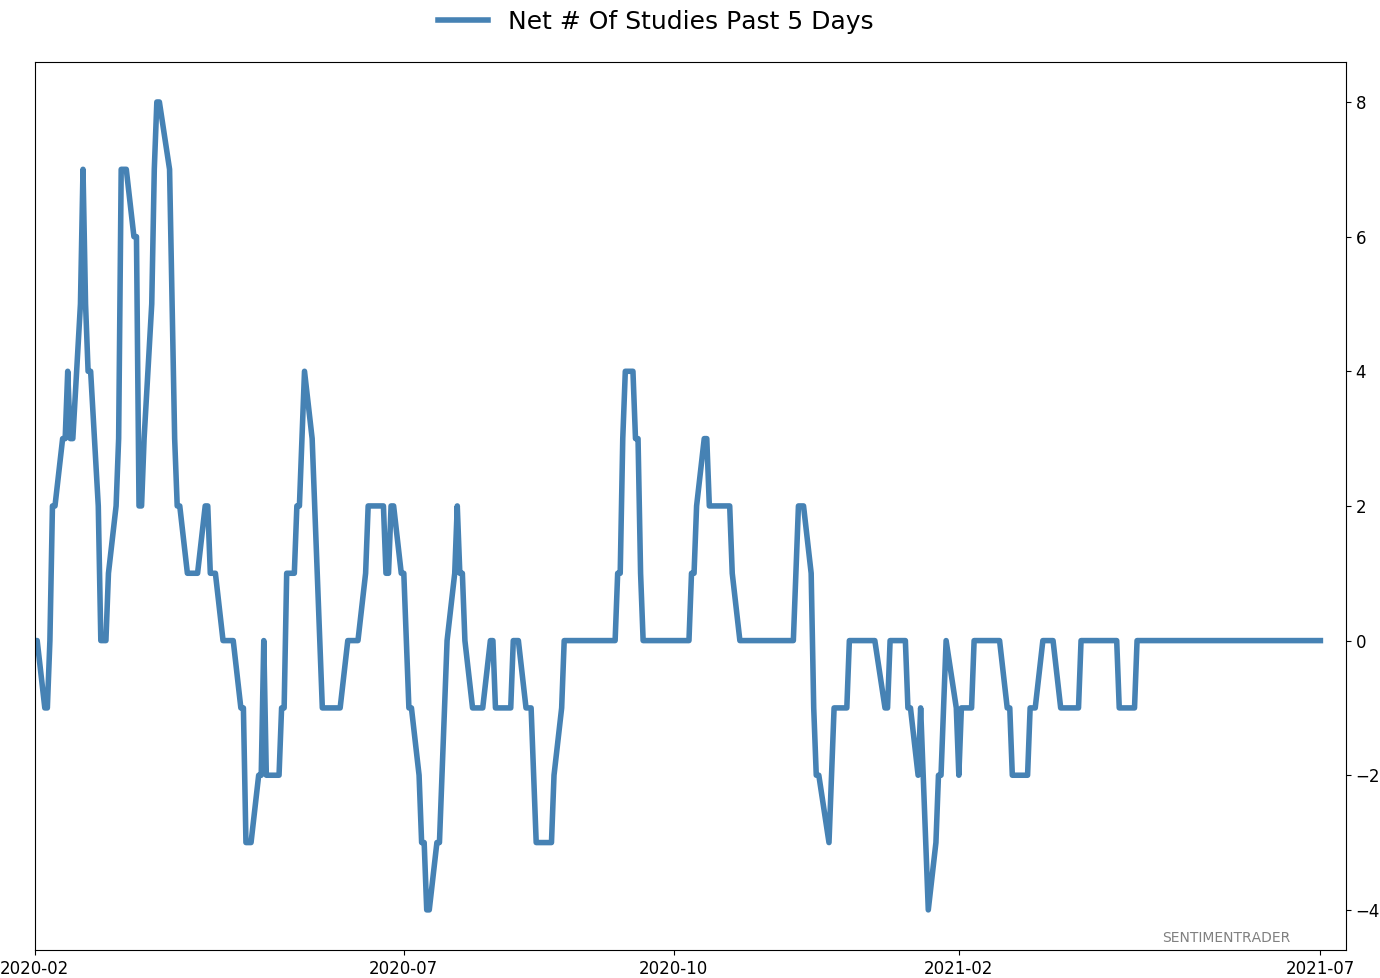
Active Studies
|
|
|
|
|
|
Indicators at Extremes
|
|
|

Portfolio
|
|
|
|
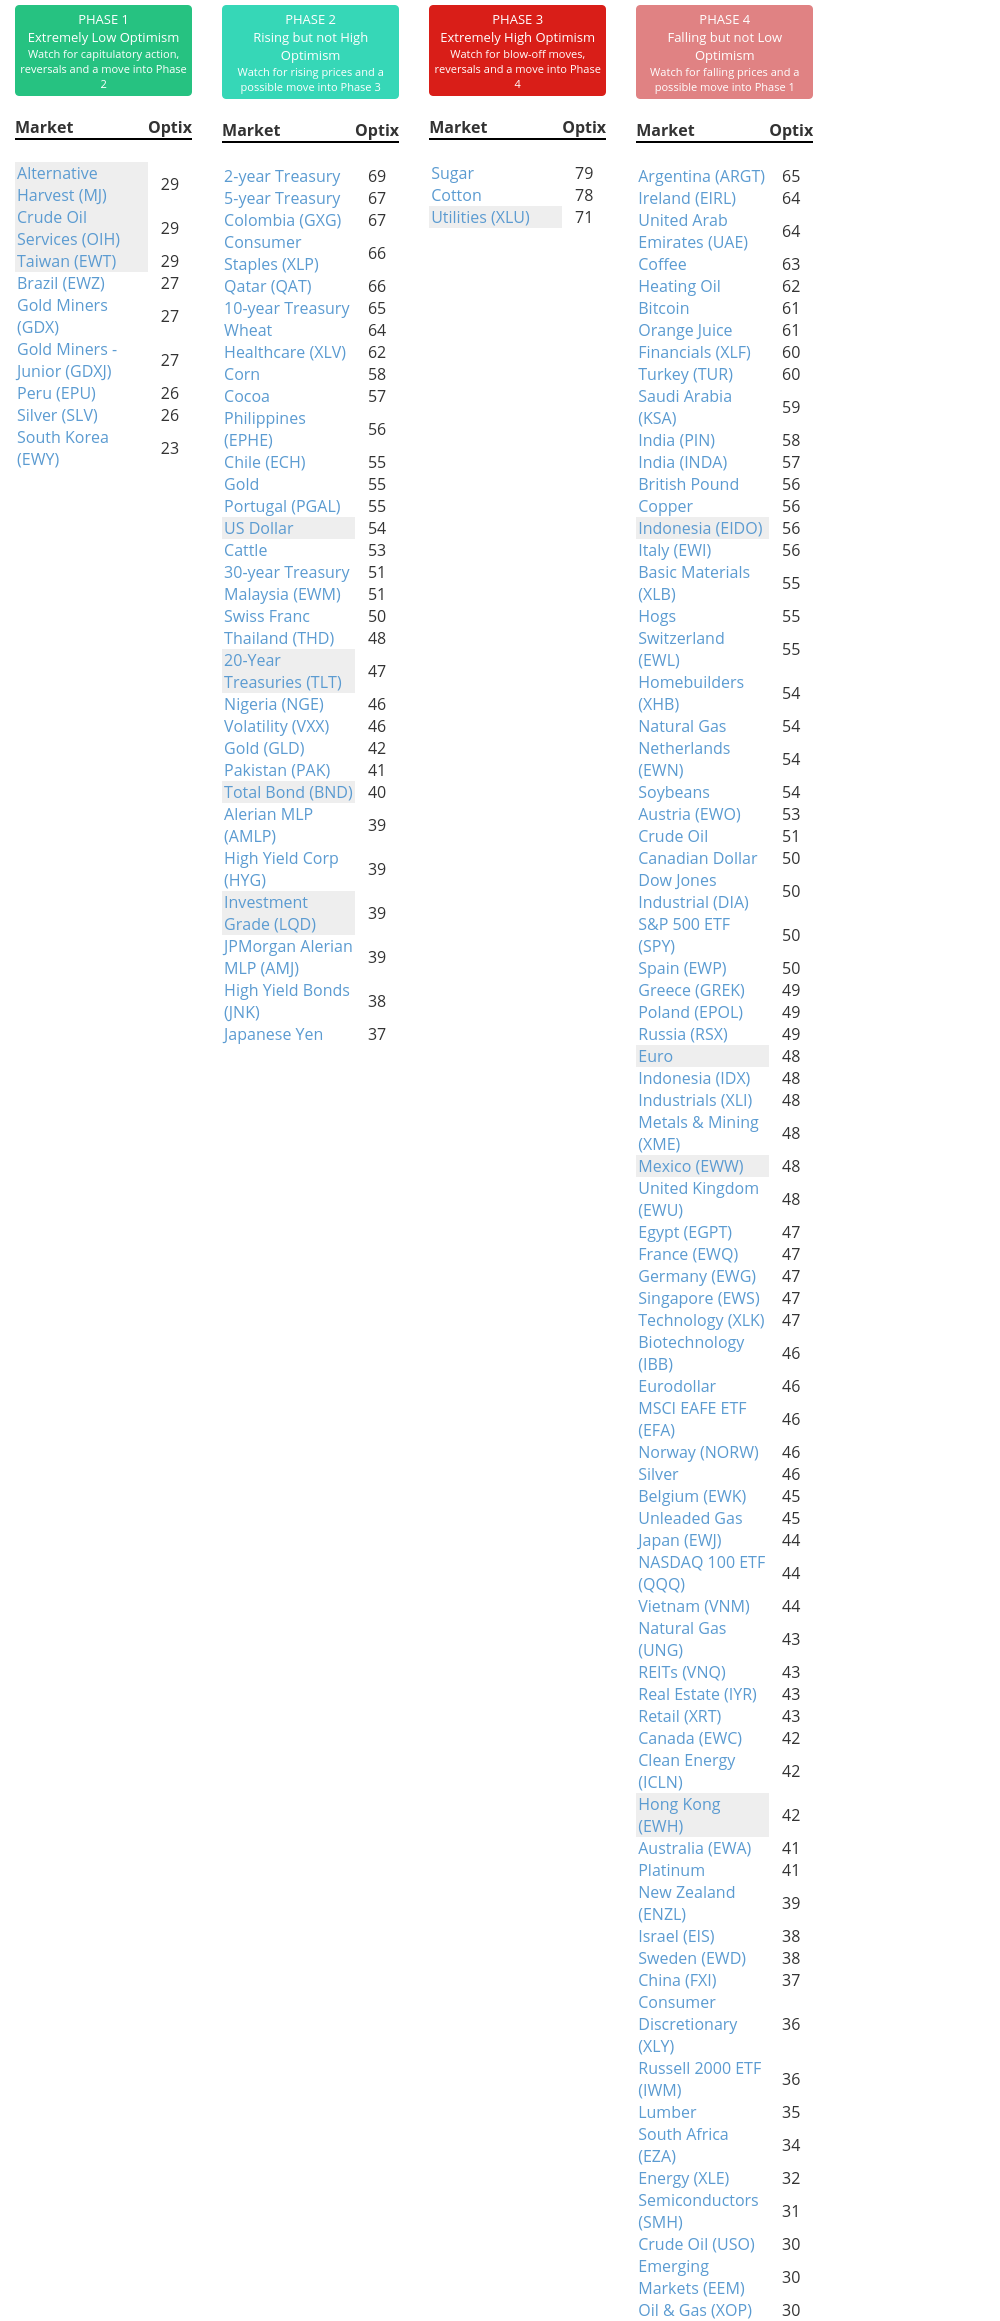
Phase Table
|
|
|
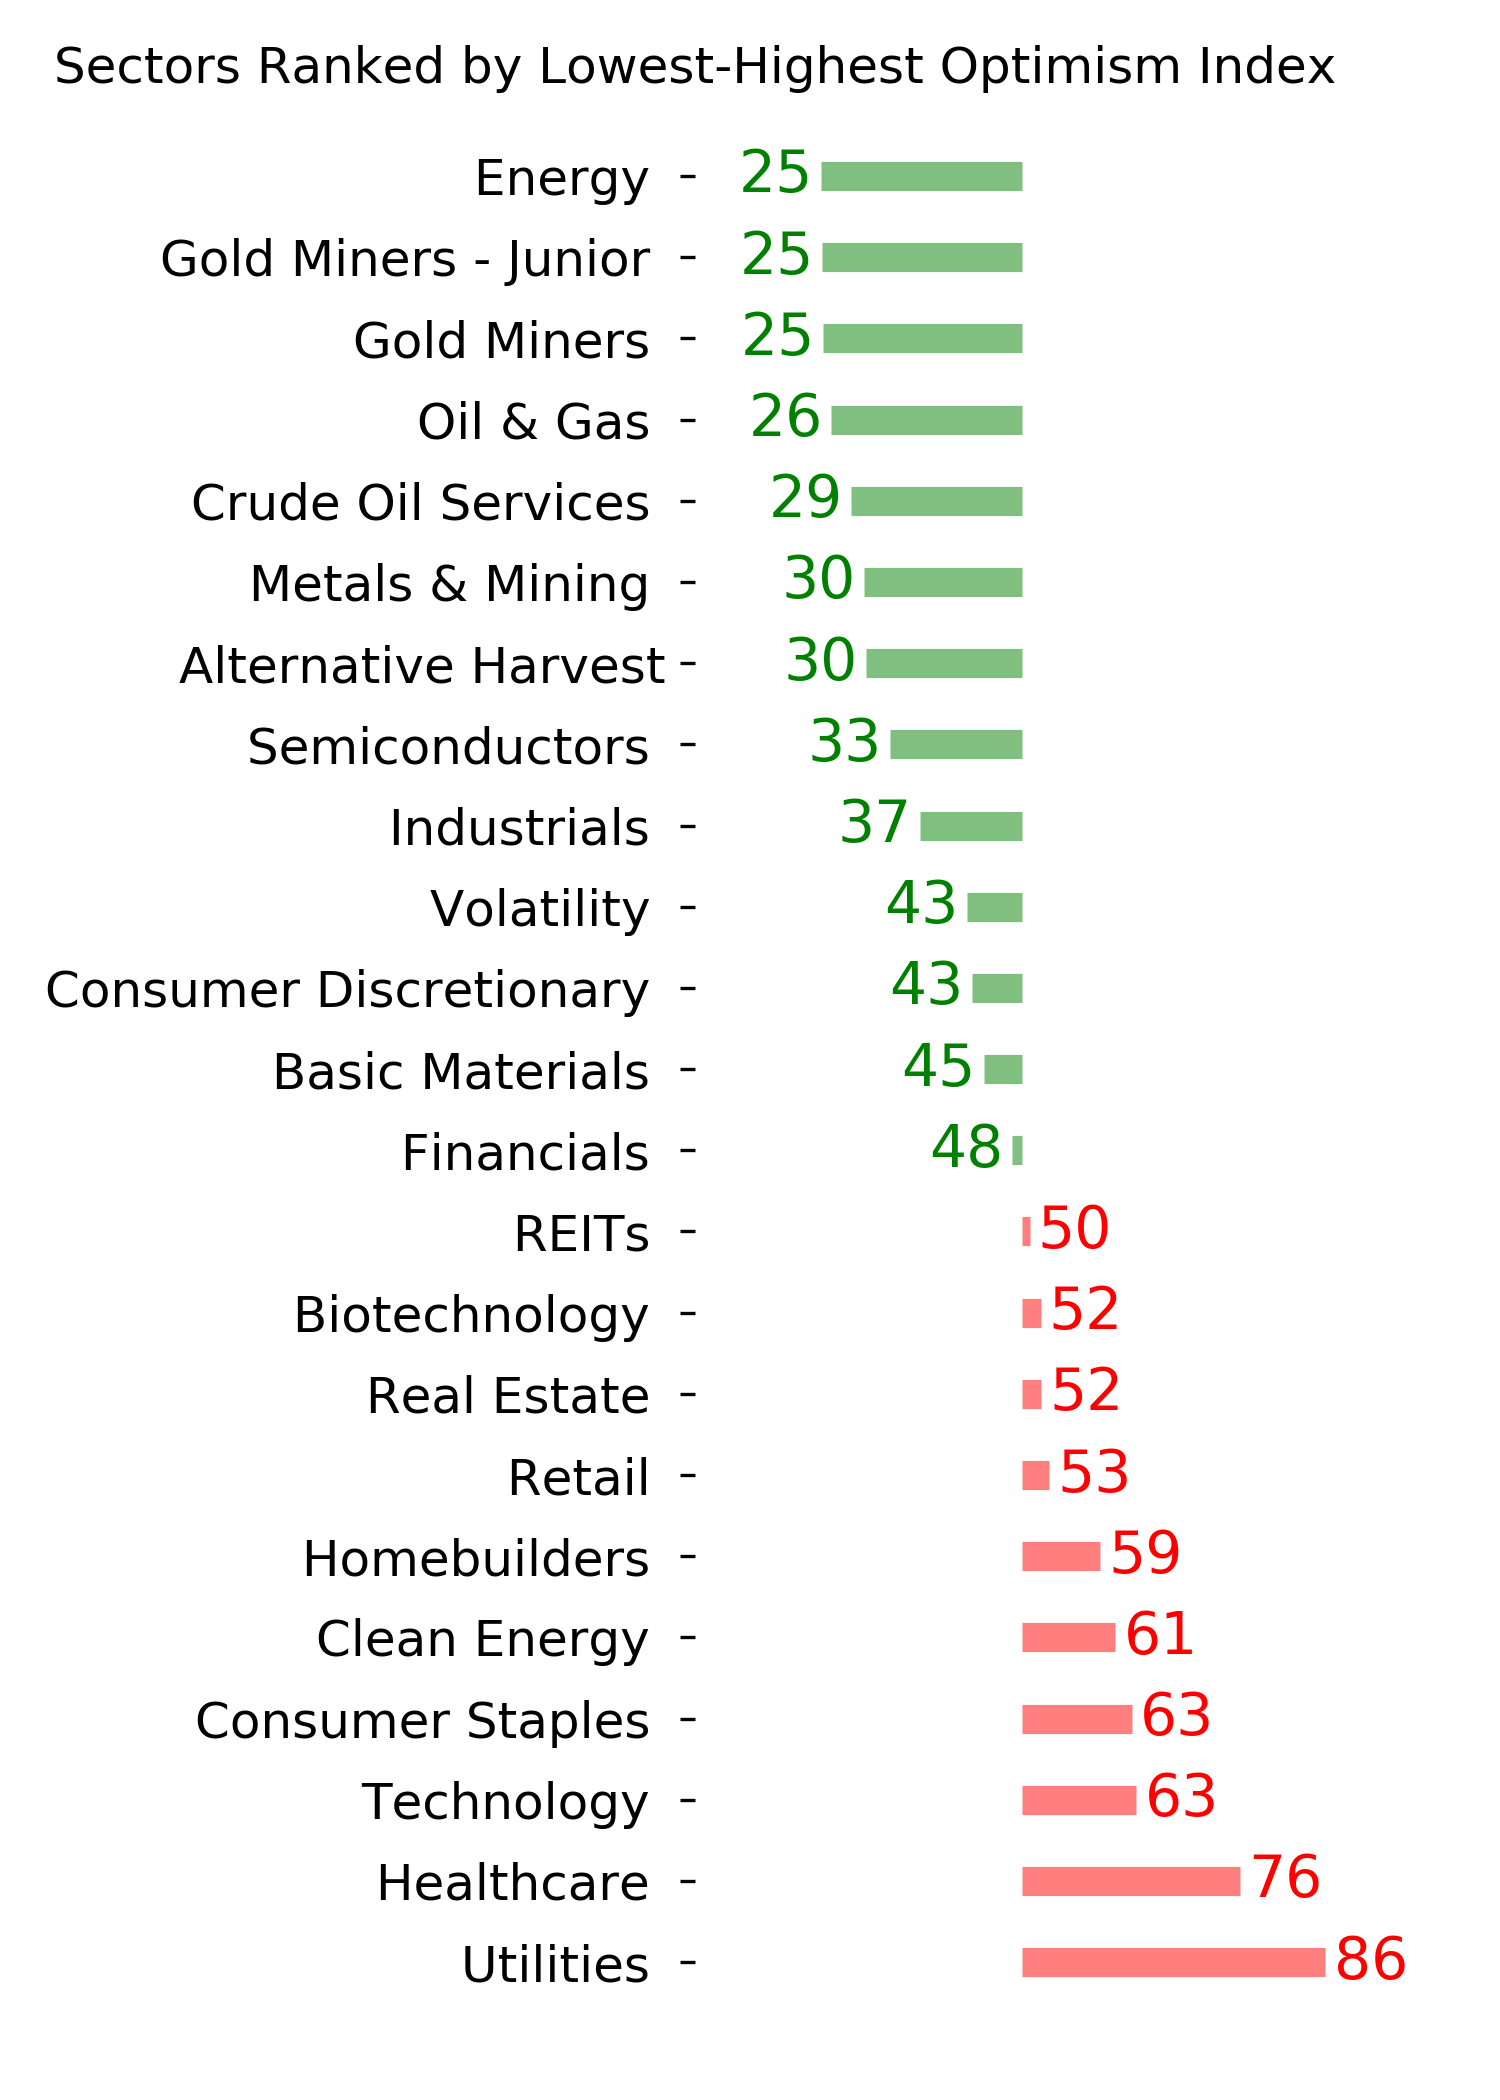
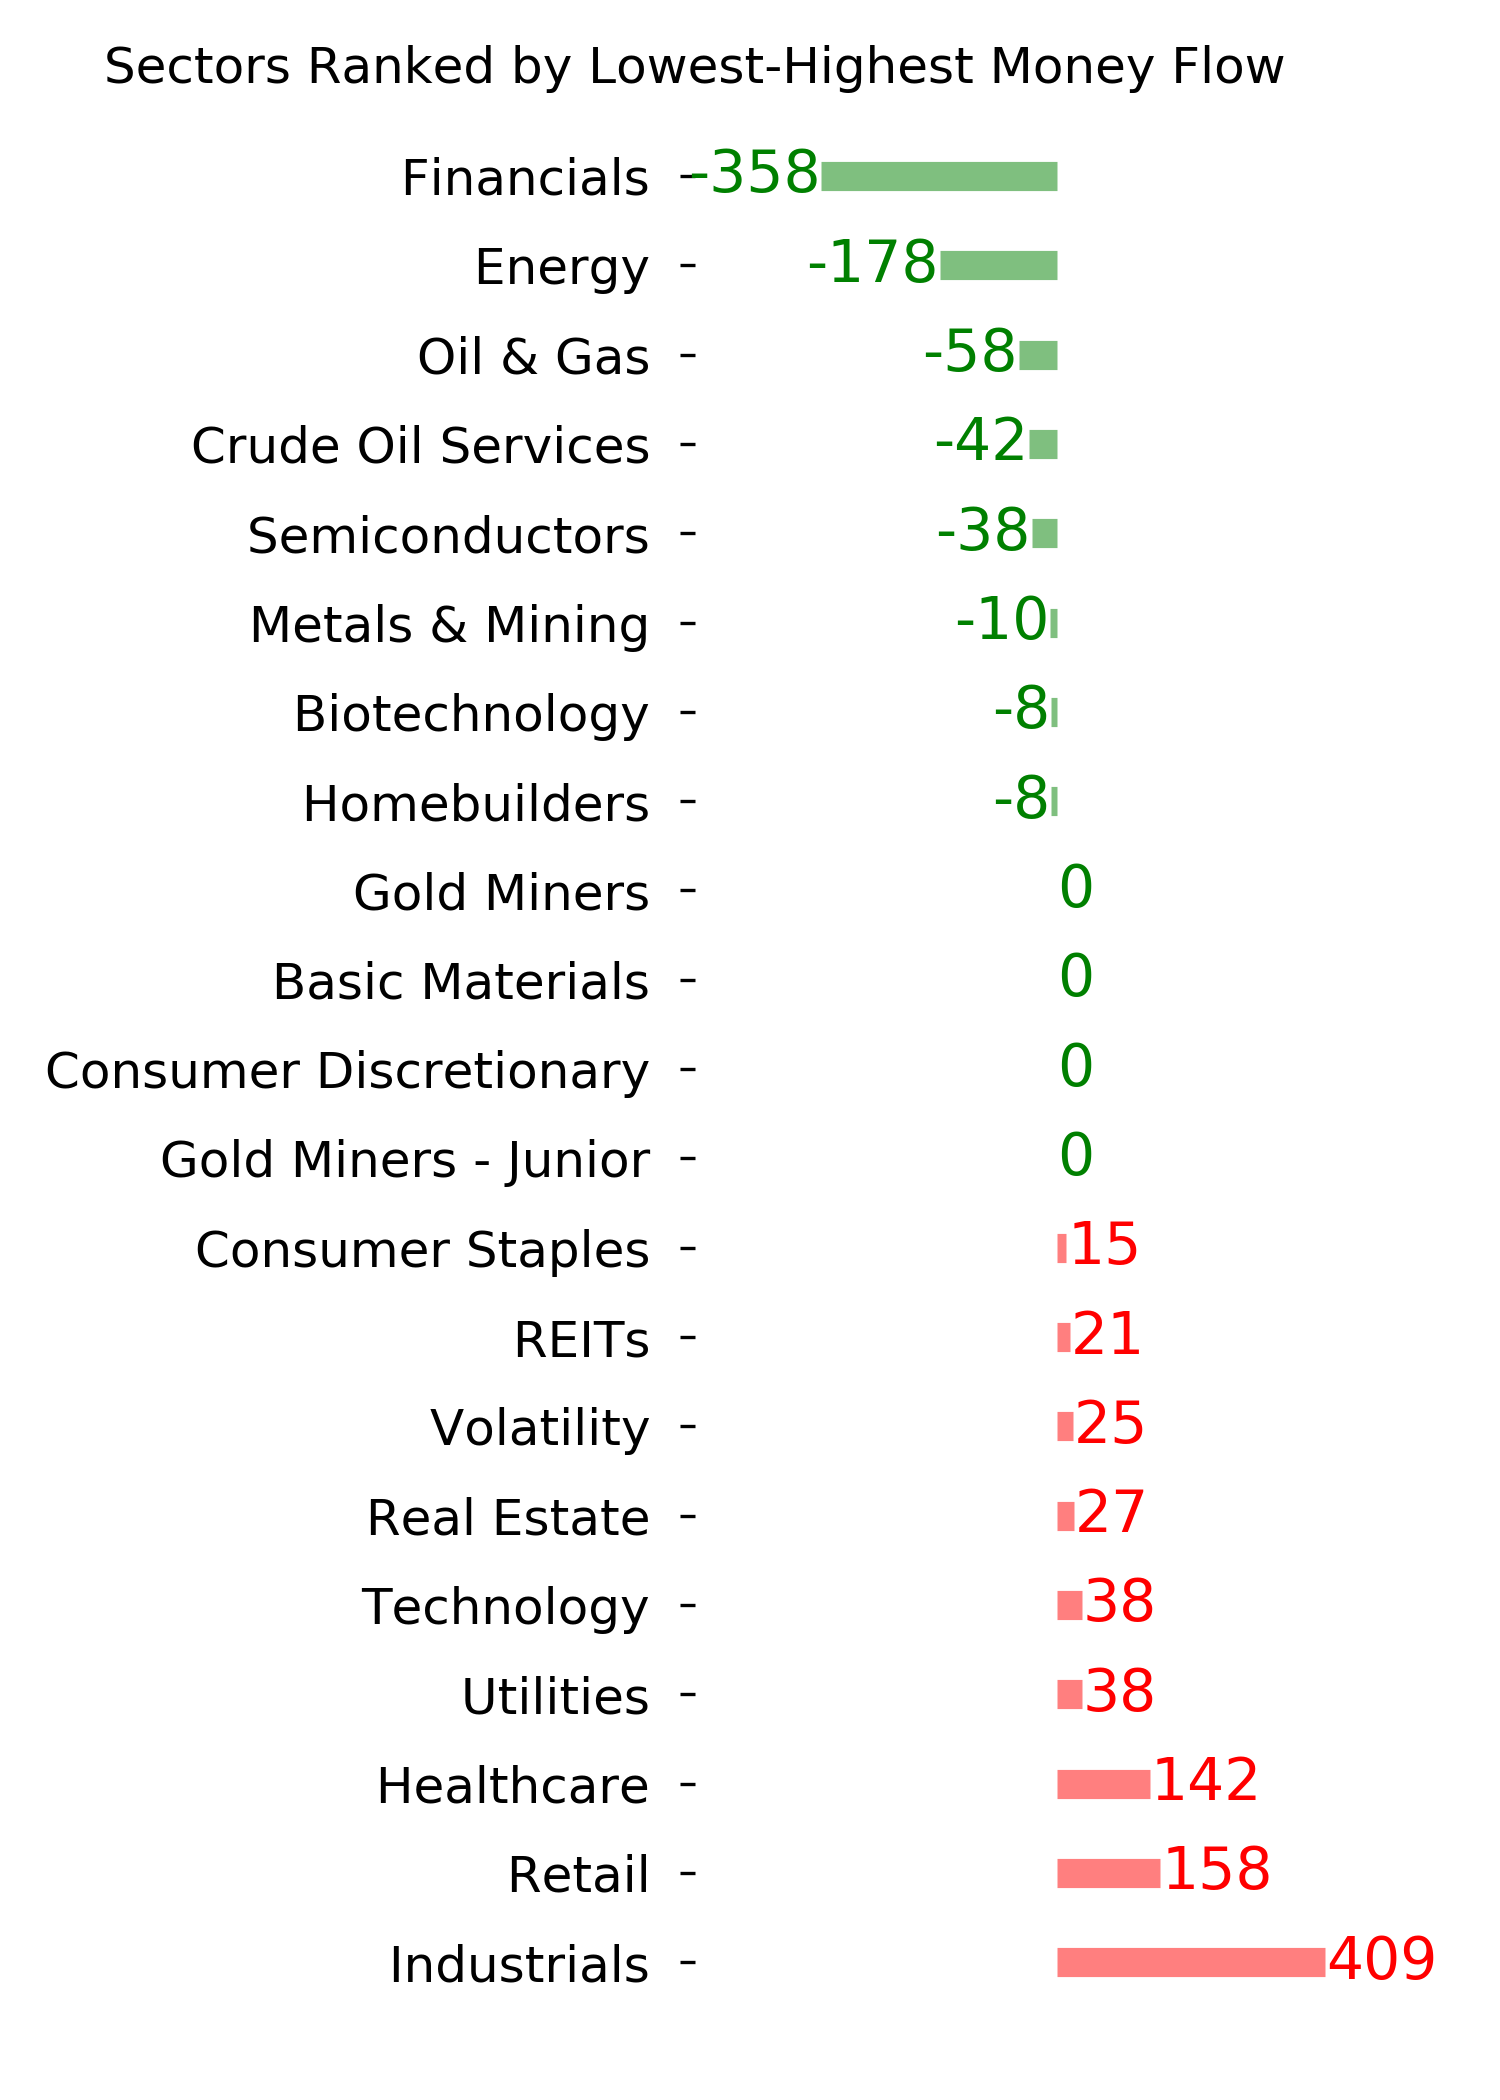
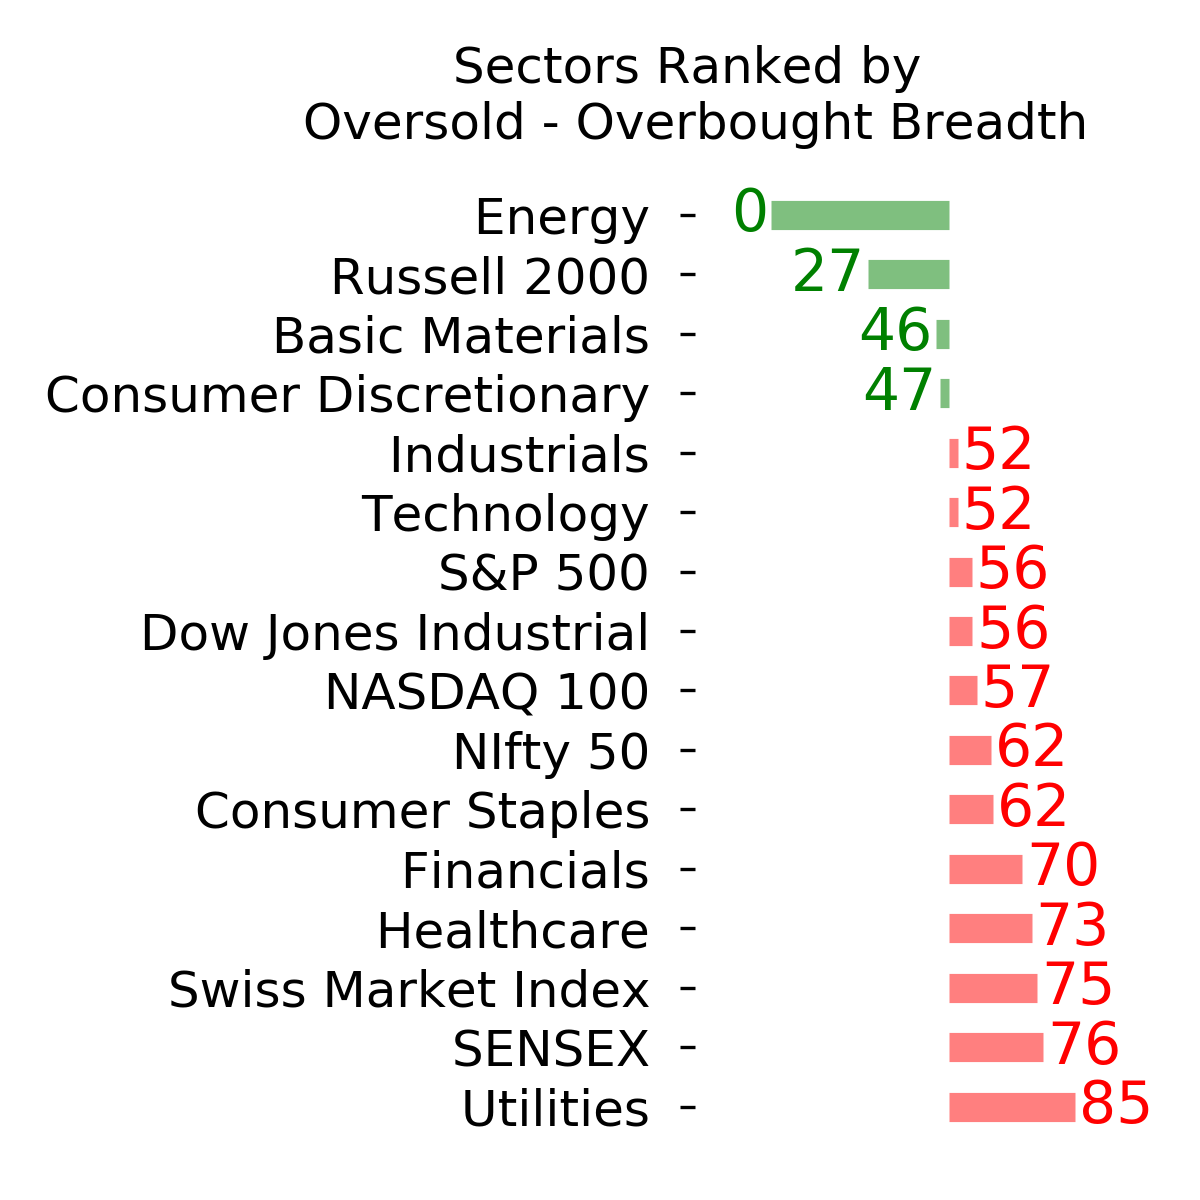
Ranks
|
|
|
|
|
|
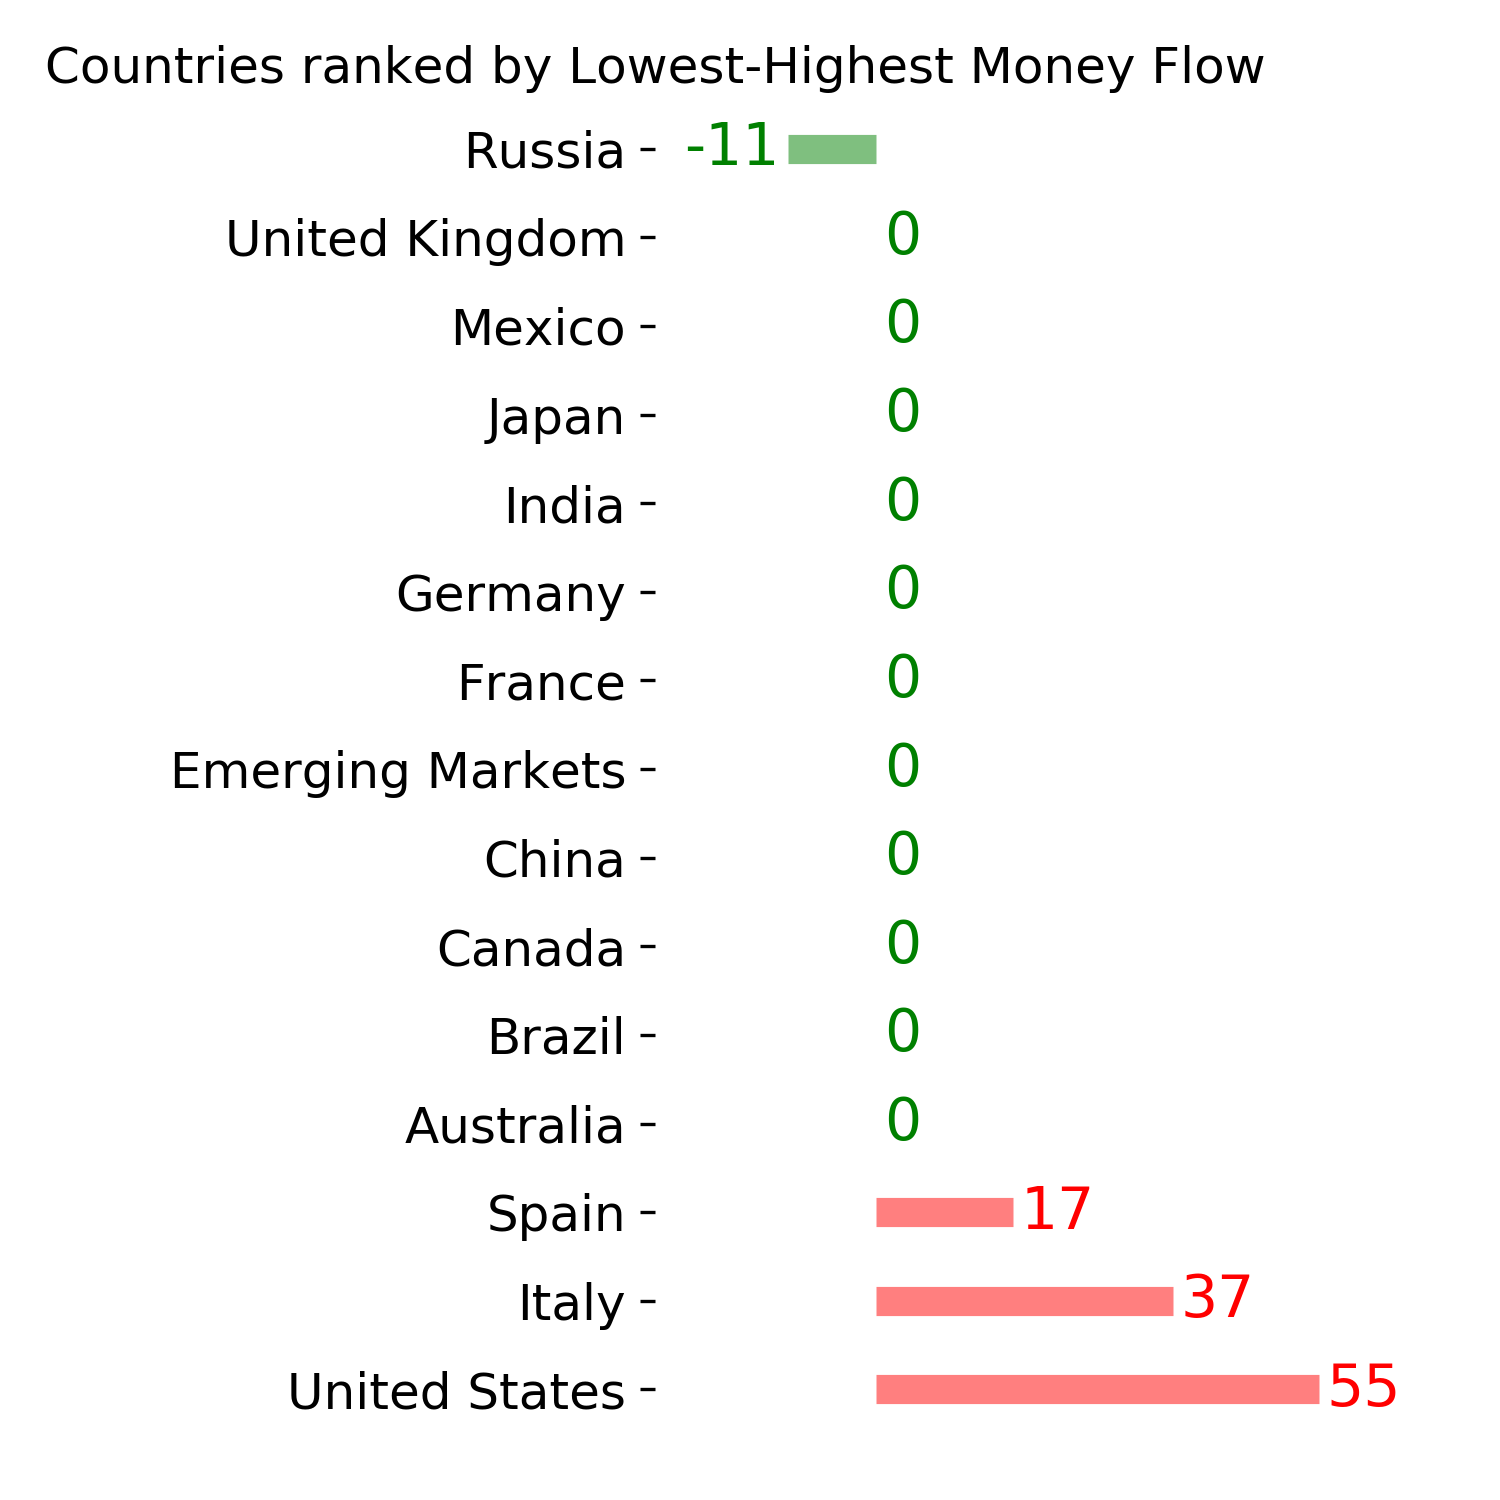
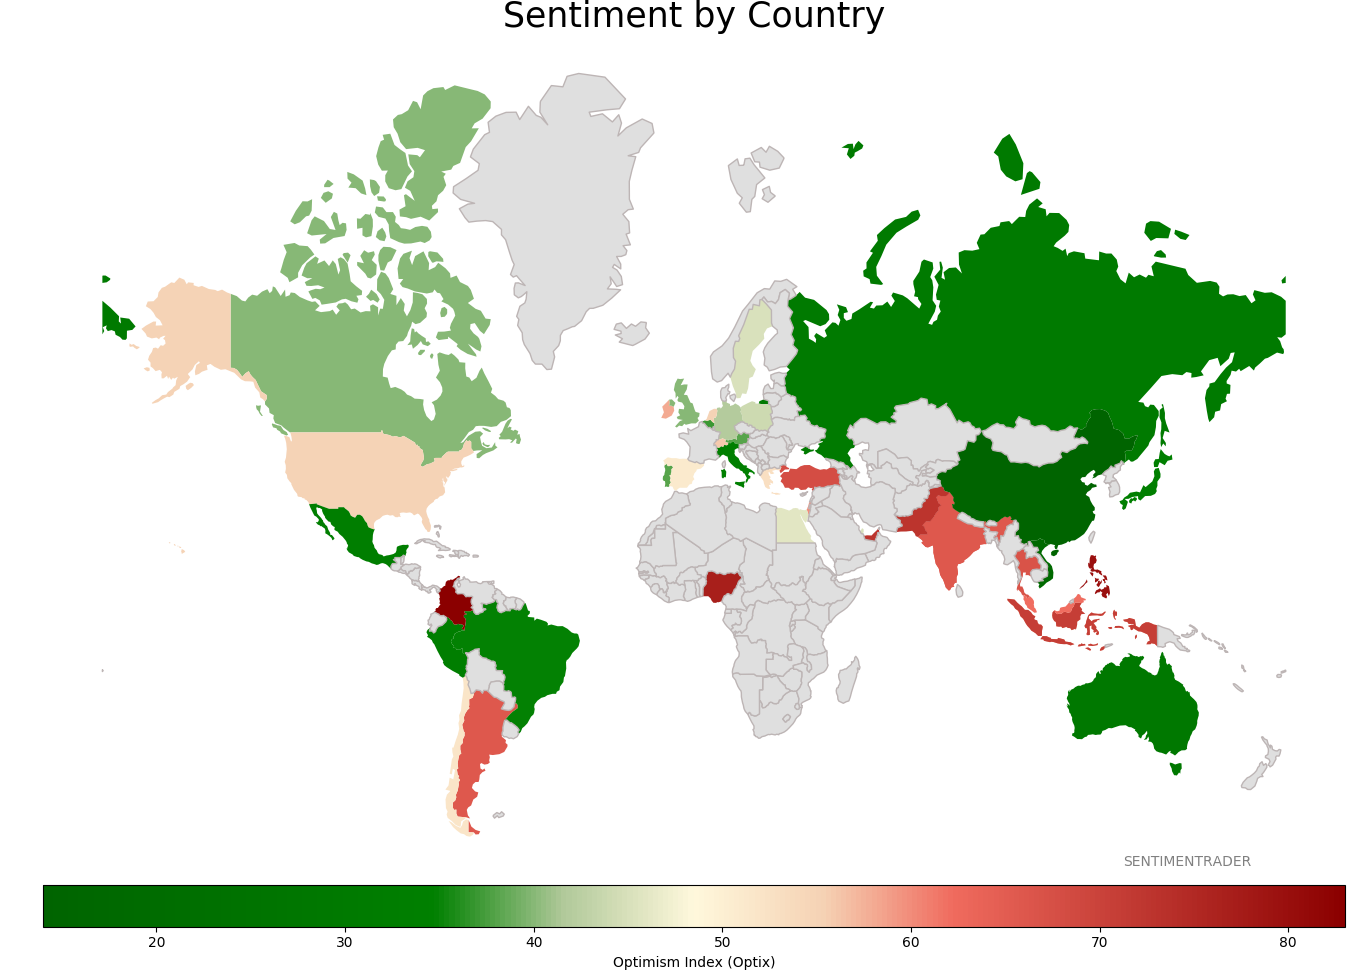
Sentiment Around The World
|
|
|
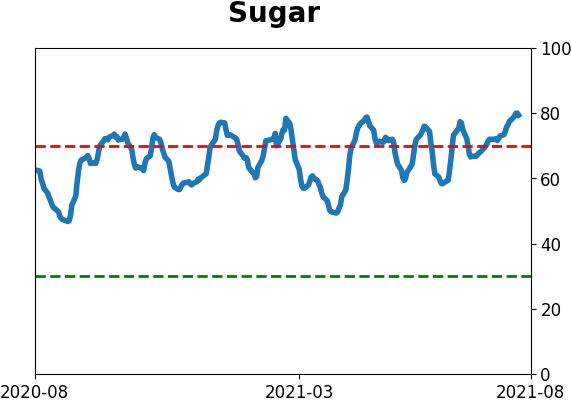
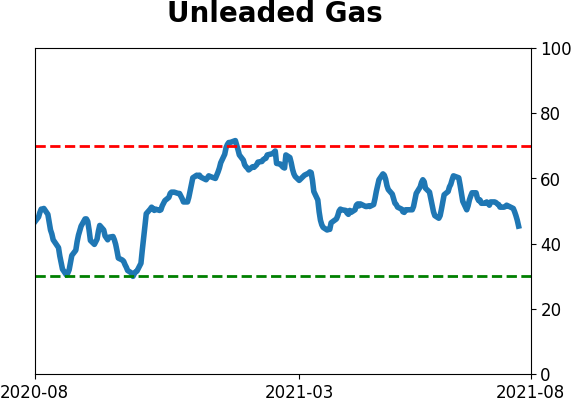
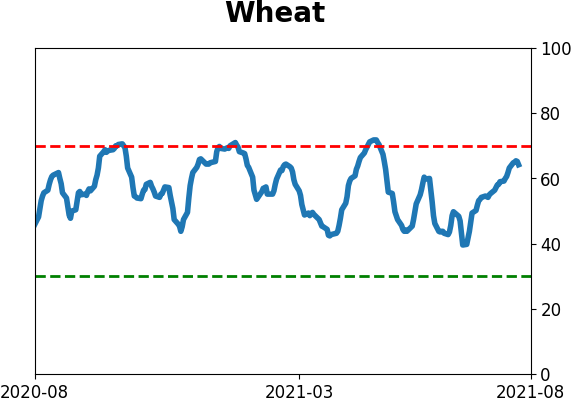
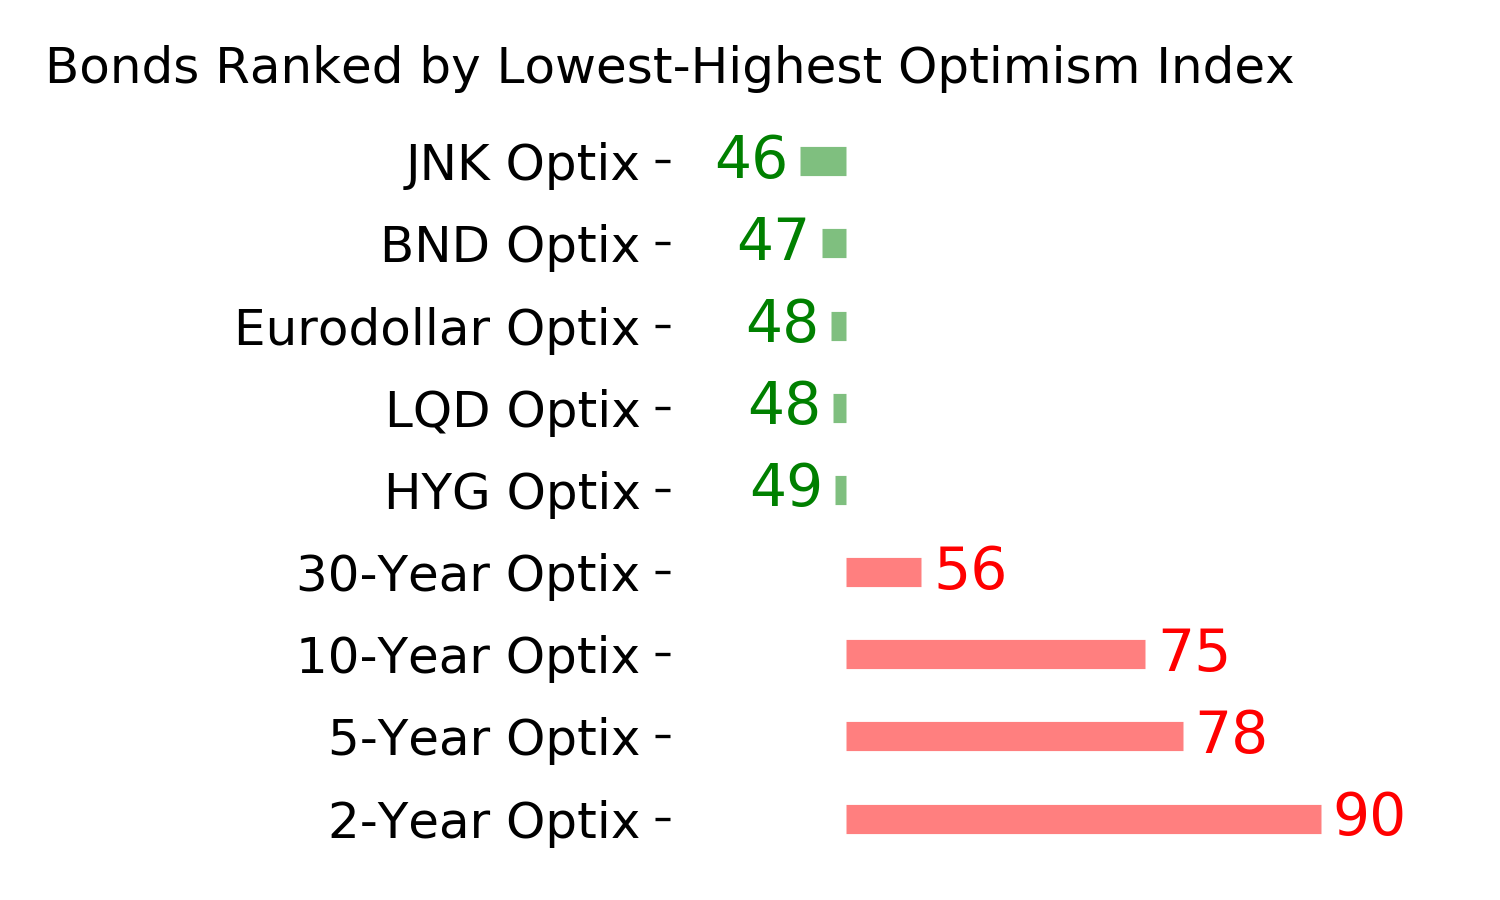
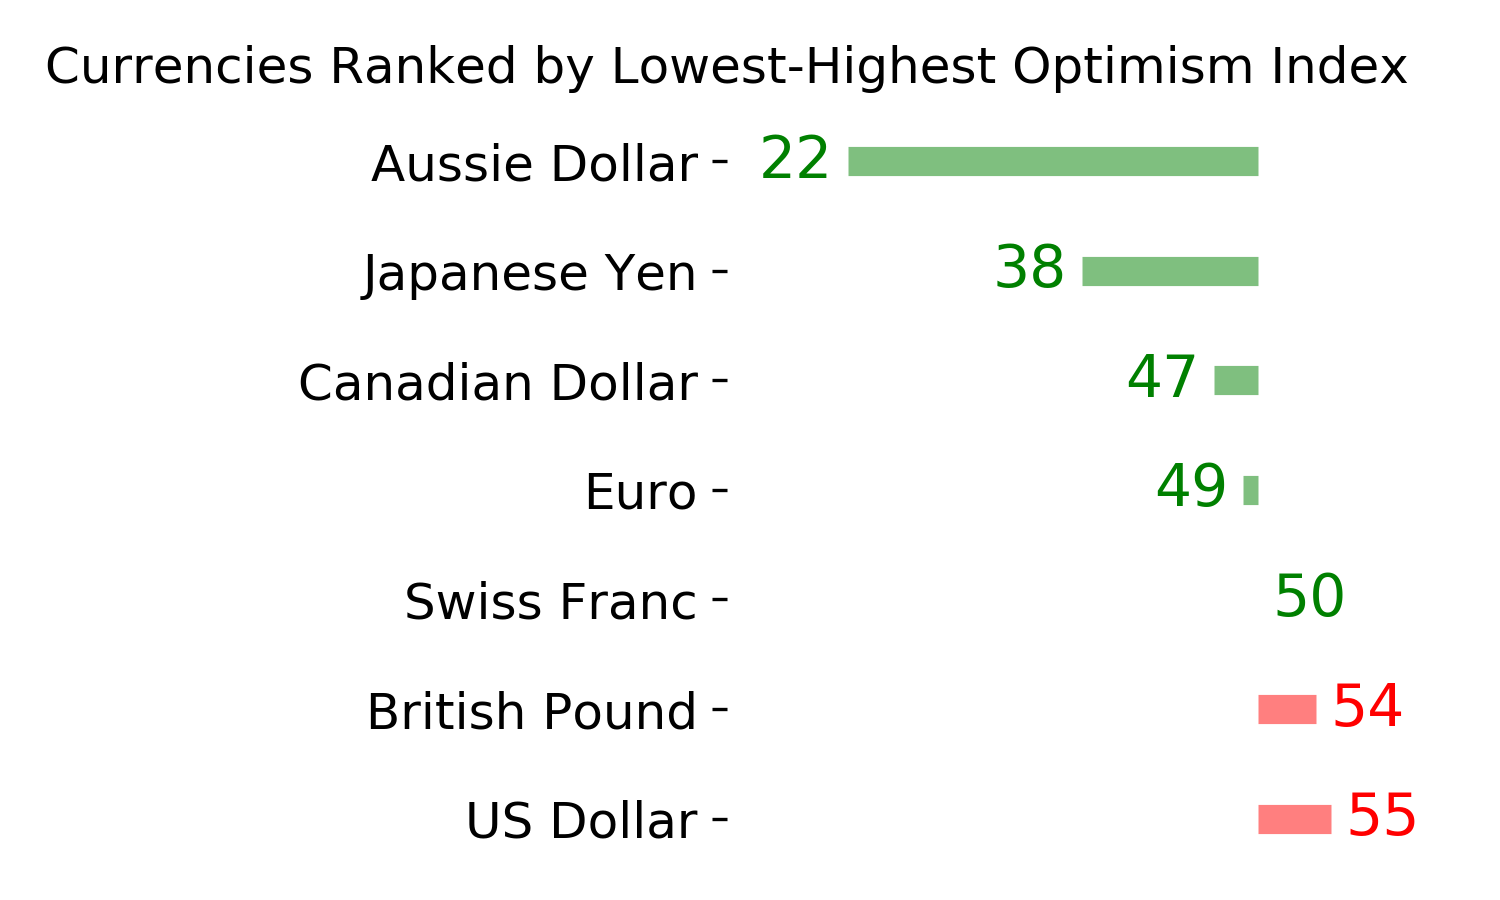
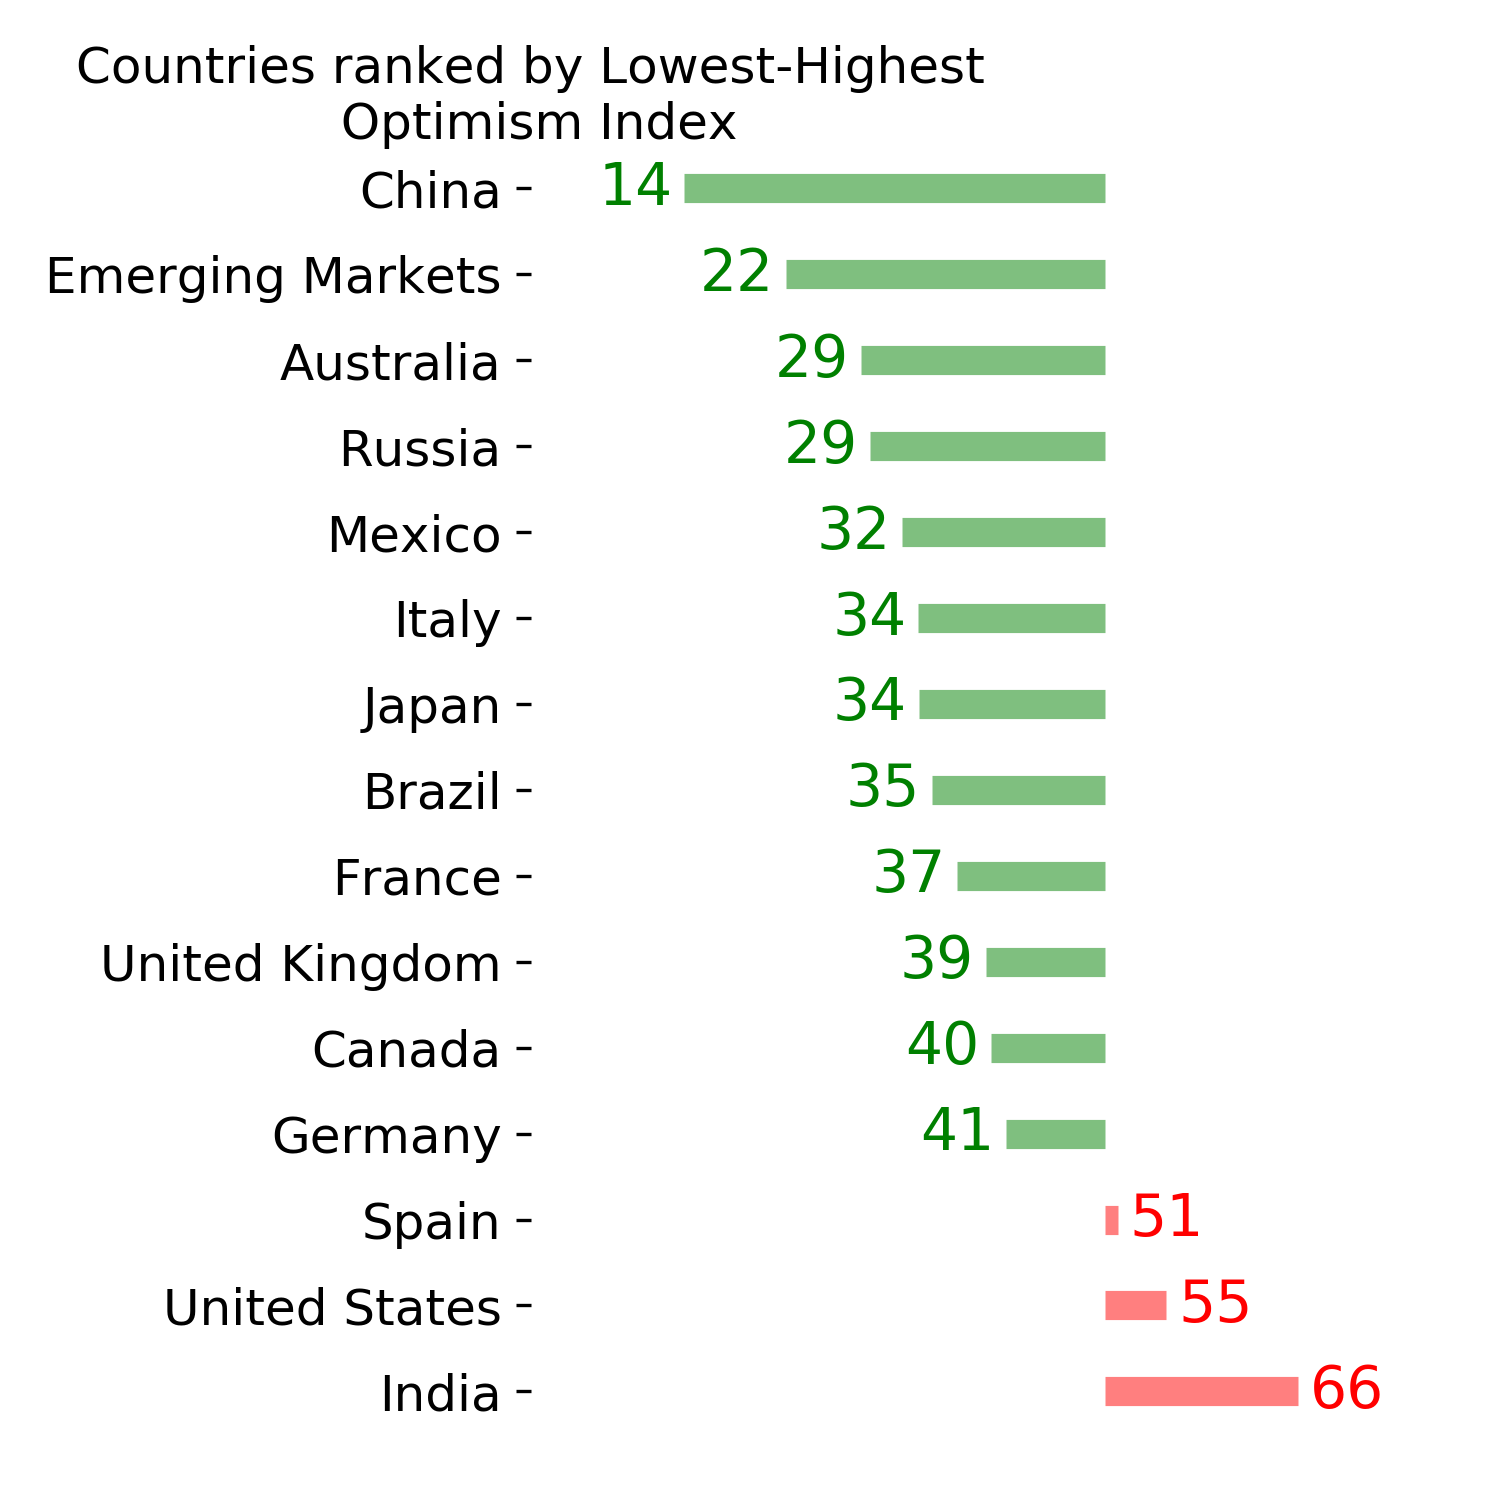
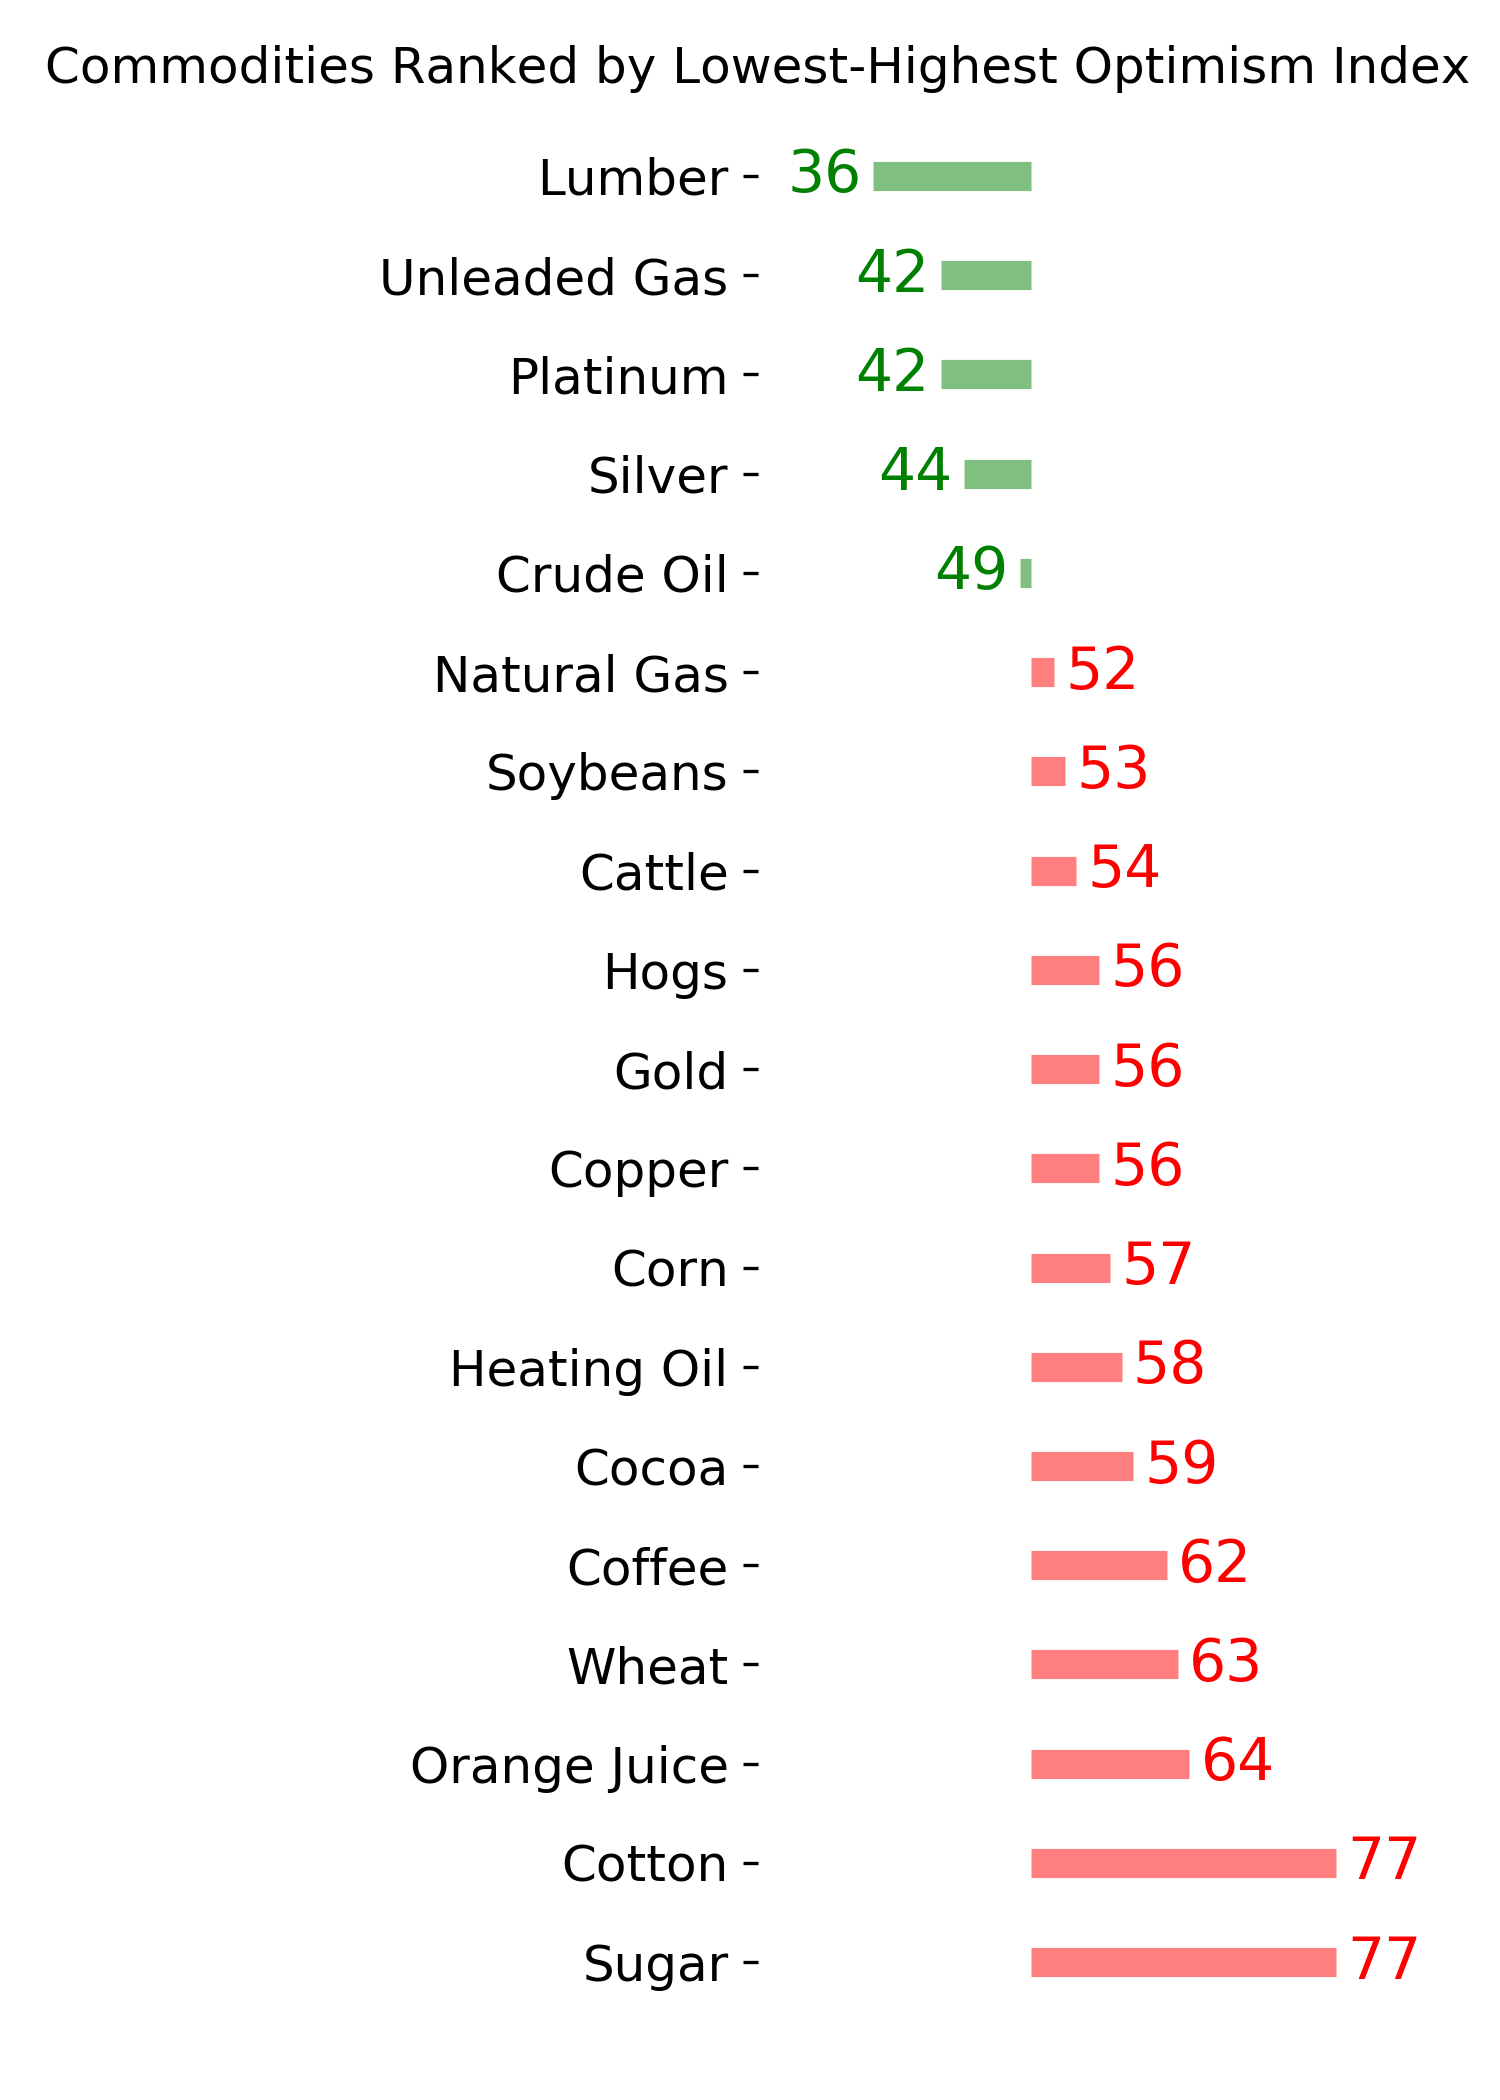
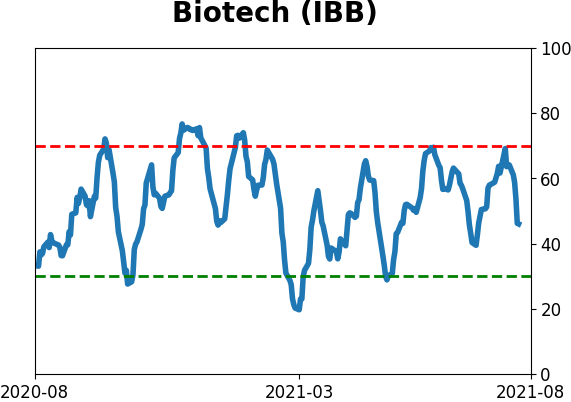
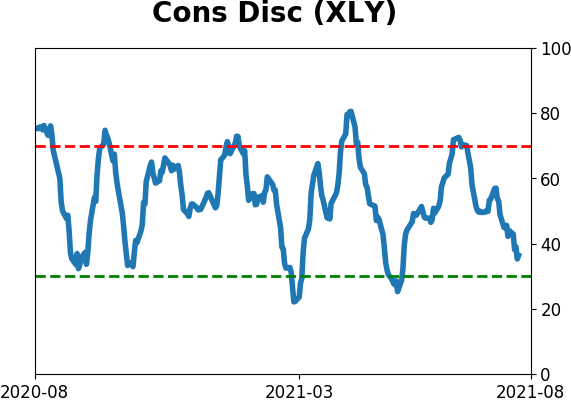
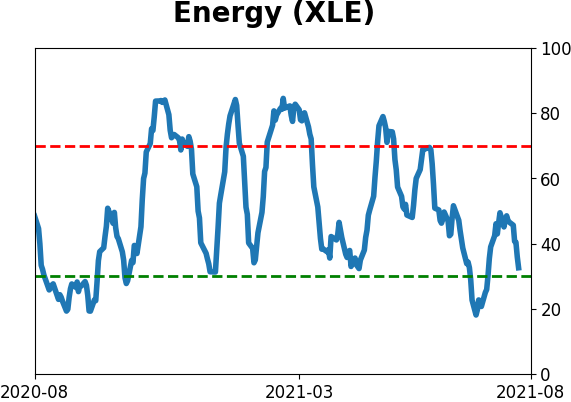
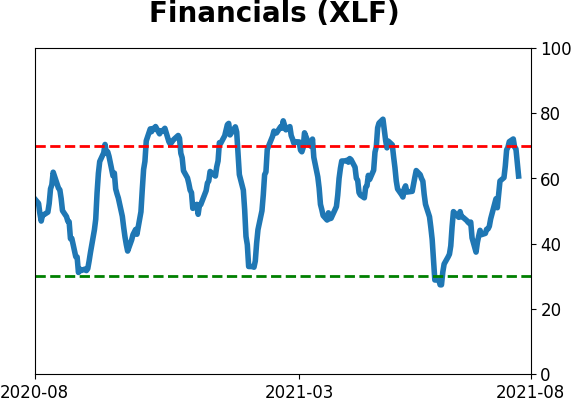
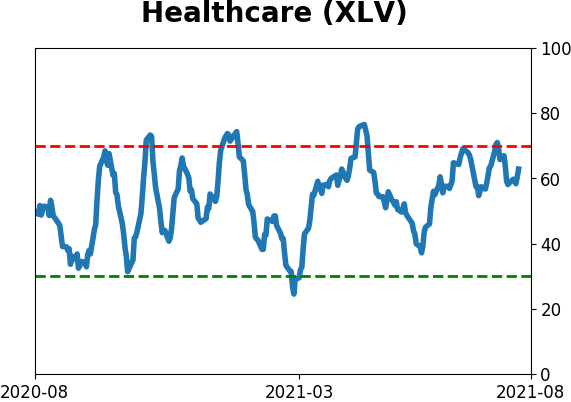
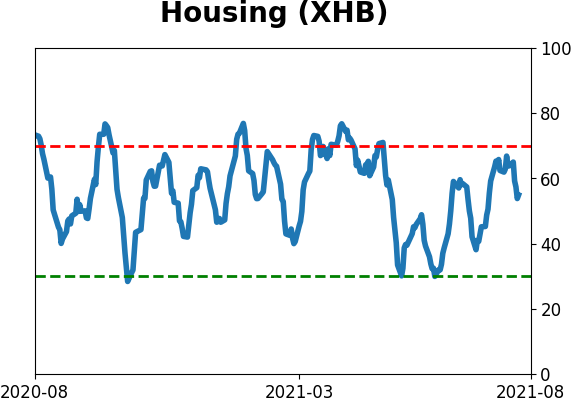
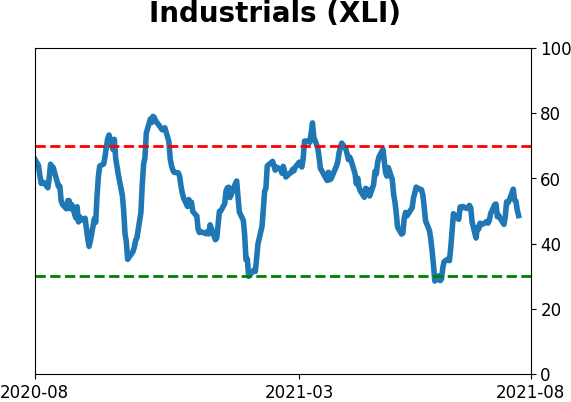
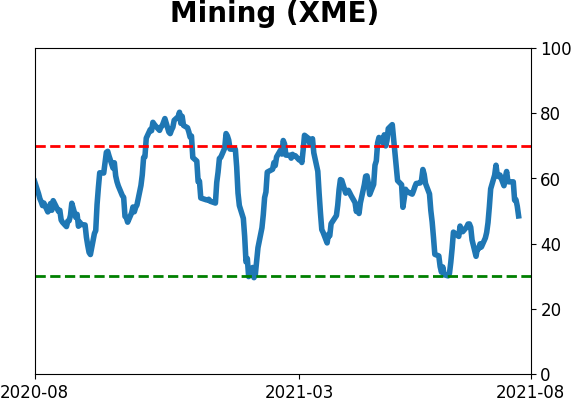
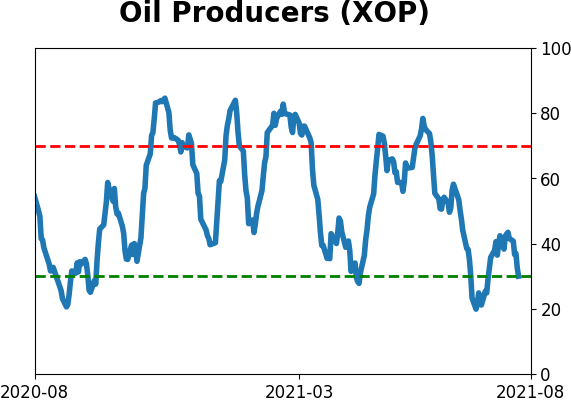
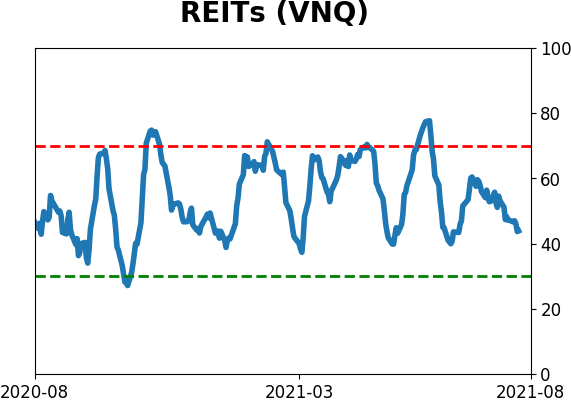
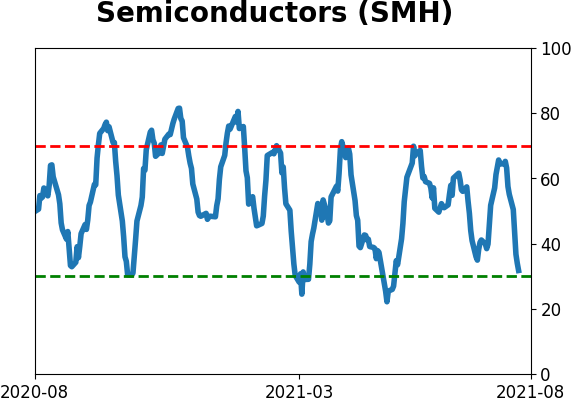
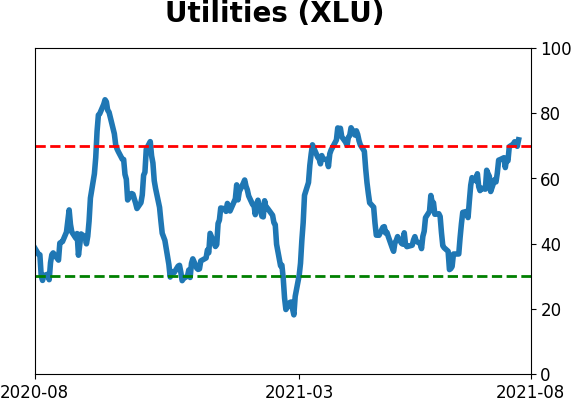
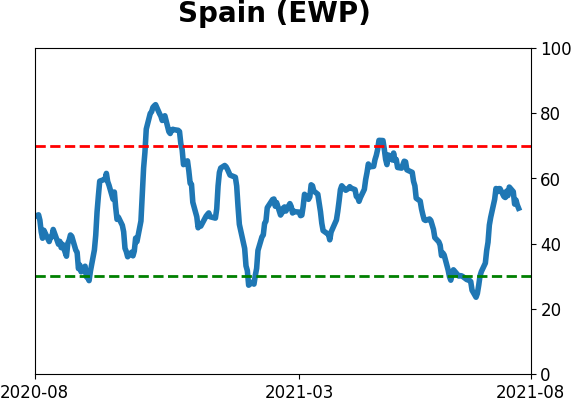
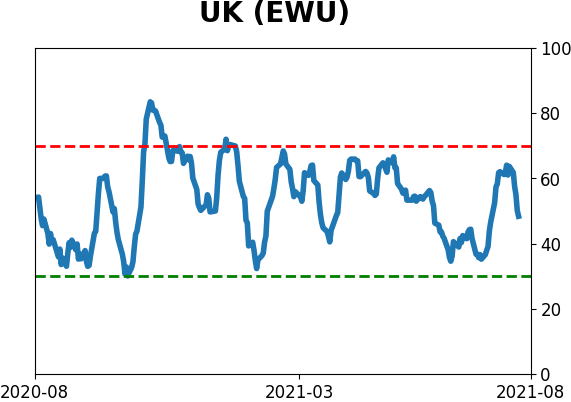
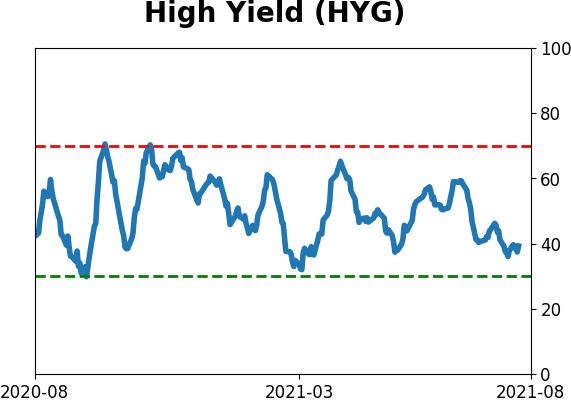
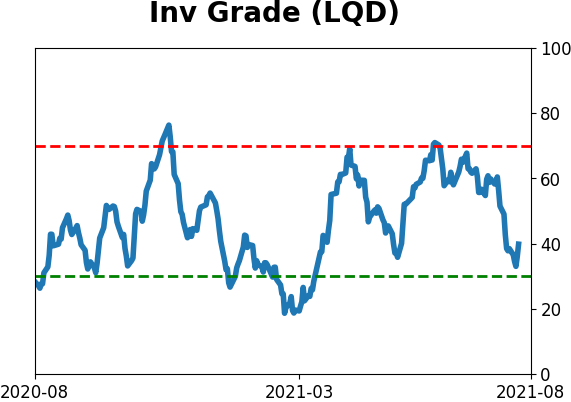
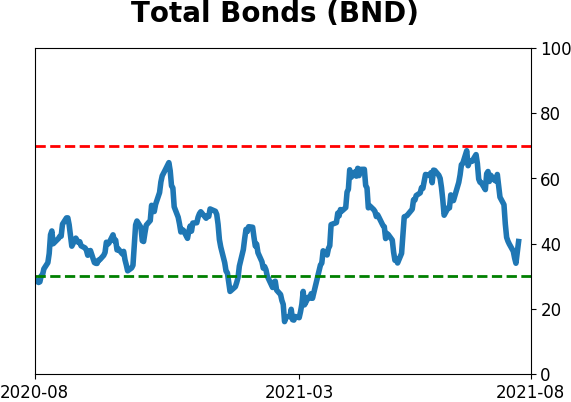
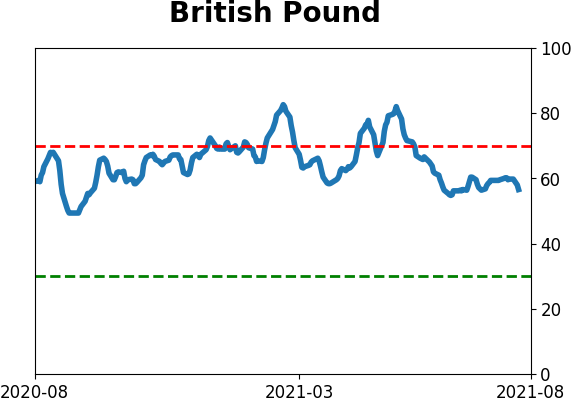
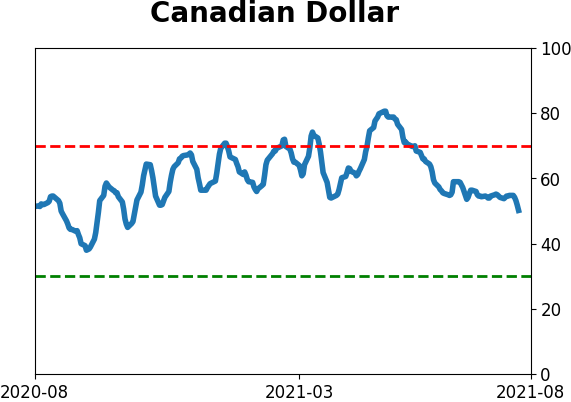
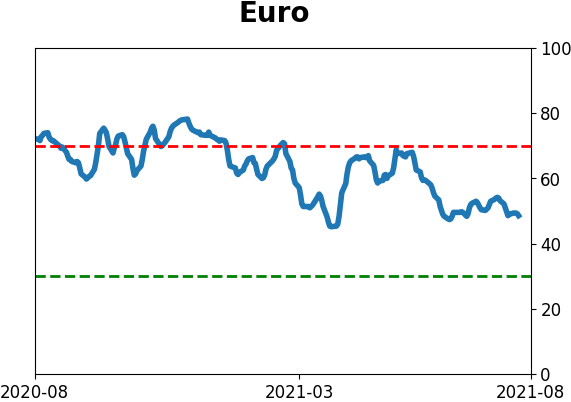
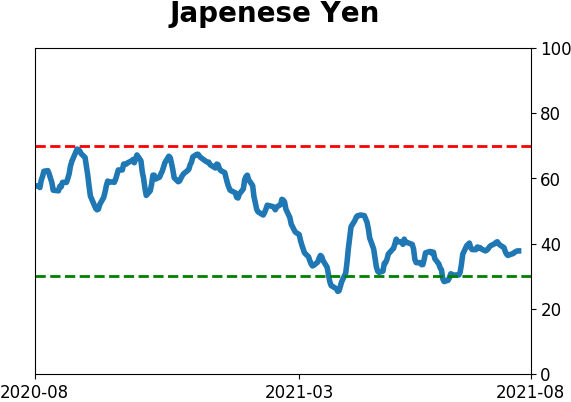
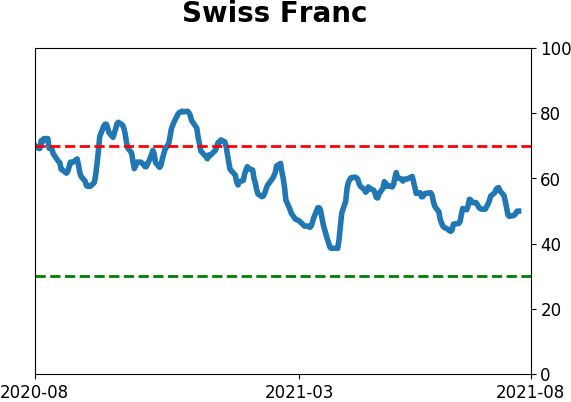
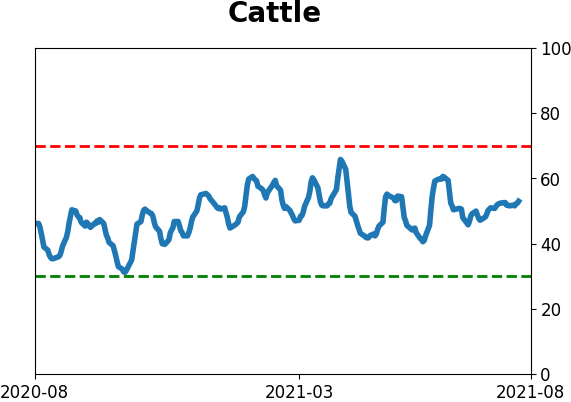
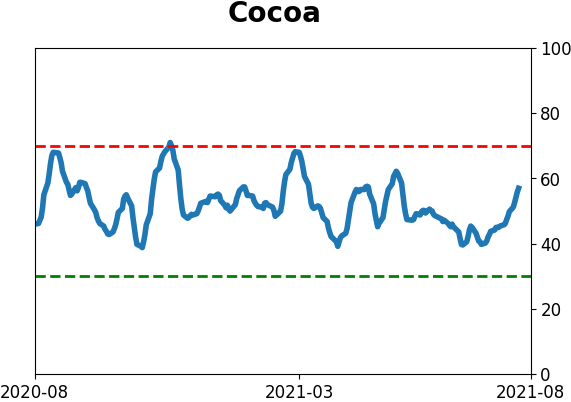
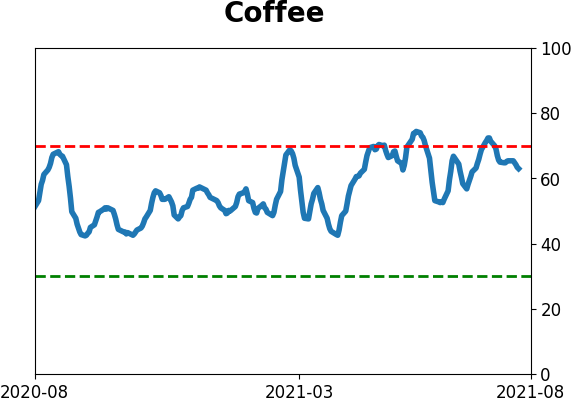
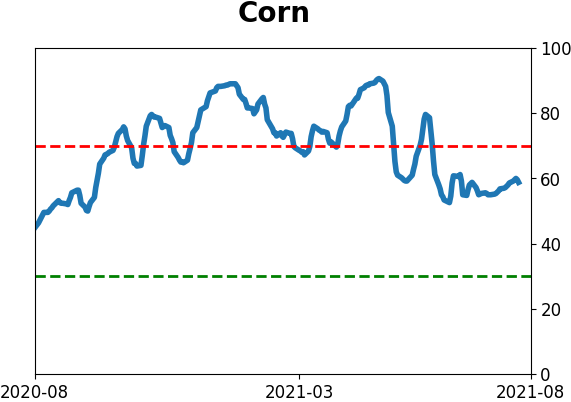
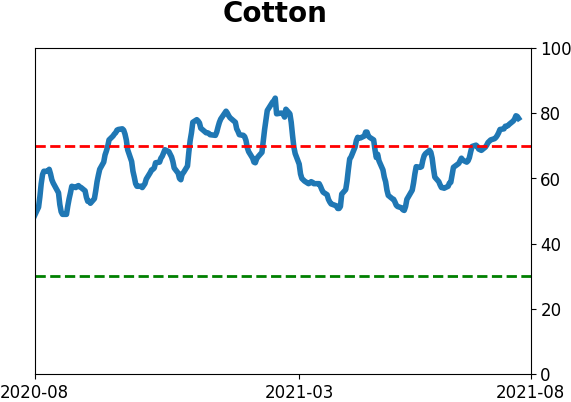
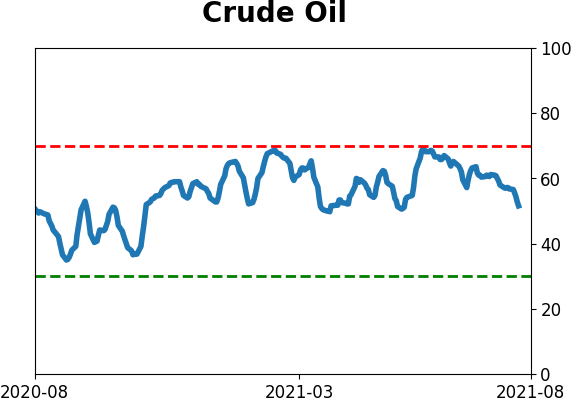
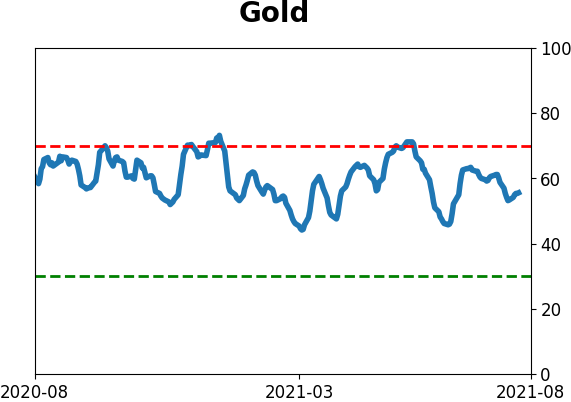
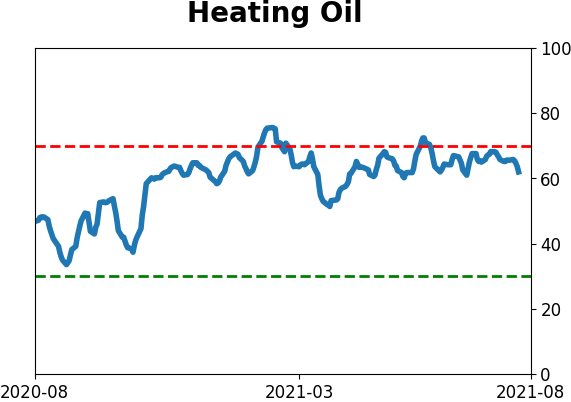
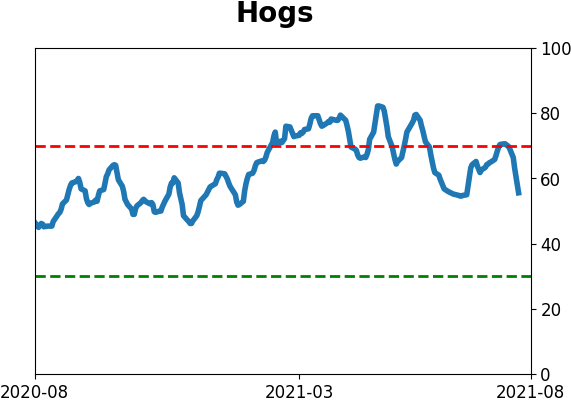
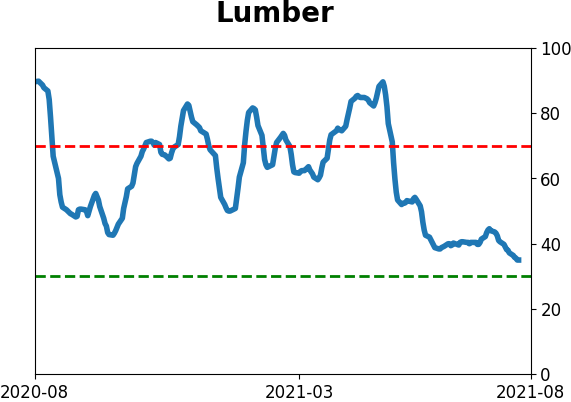
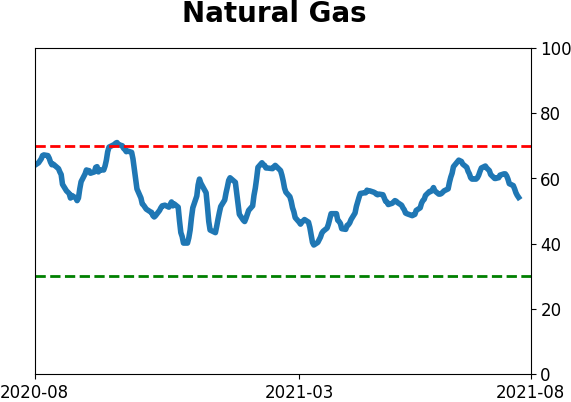
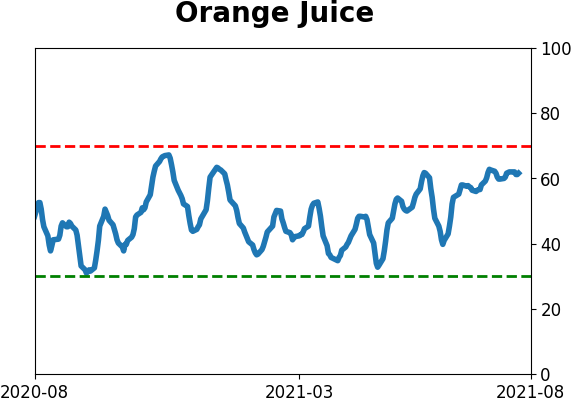
Optimism Index Thumbnails
|
|
|
|

|

|
|
|
|
|
|
|

|
|
|
|
|
|
|
|
|