
Global Leading Economic Indicators Update

Let's review the OECD Composite Leading Indicators data with some tables, charts, and signals to see how the economy is tracking through the lens of the stock market.
If you would like to review my previous OECD LEI note, please click here.
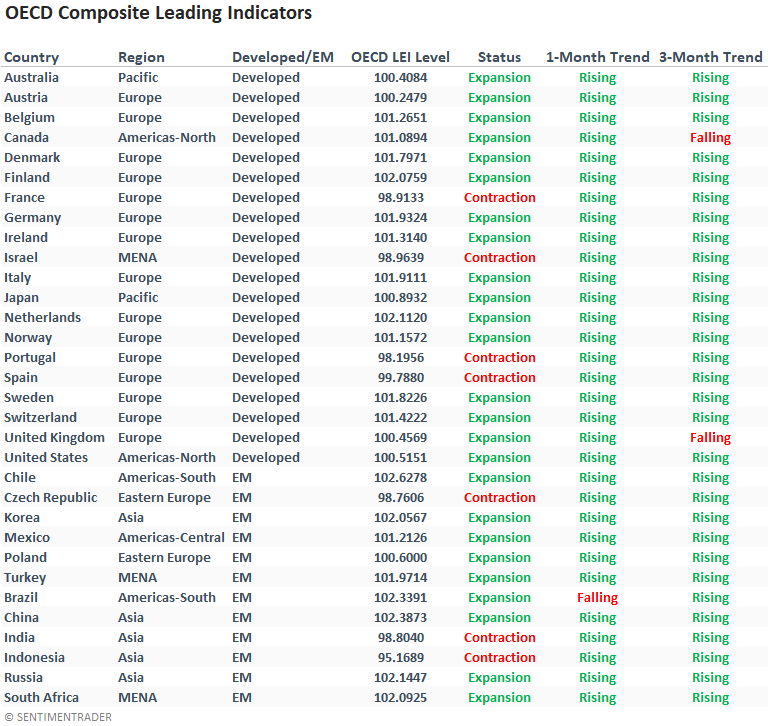
OECD COUNTRY DATA
Composite leading indicators remain in expansion territory (>100) for many countries, and the LEI's are rising on a one and three-month basis.
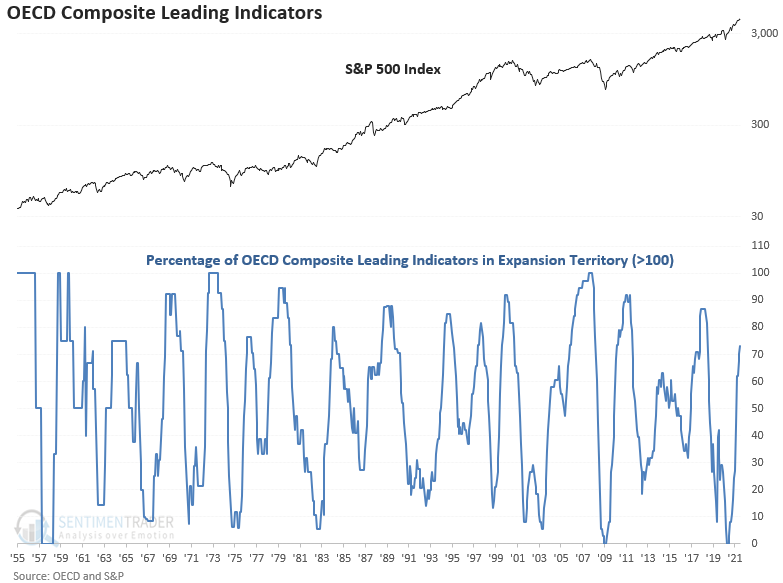
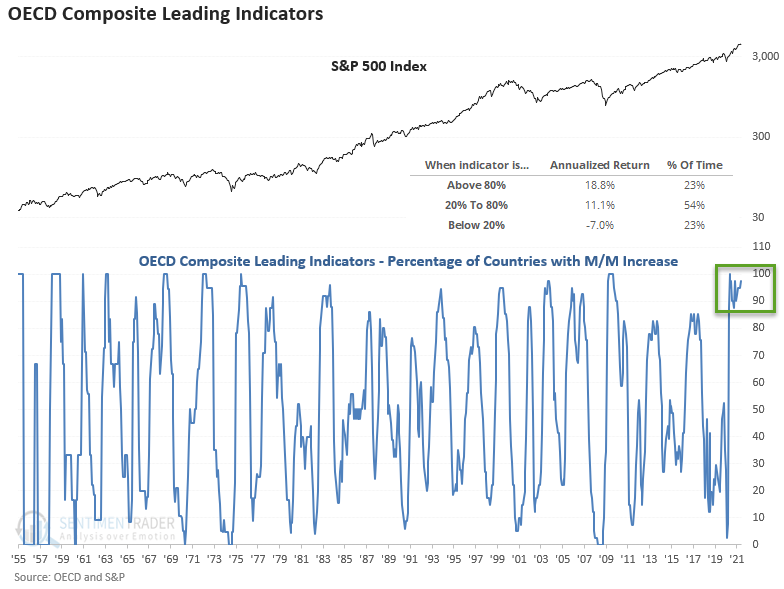
OECD LEI EXPANSION CHART
The percentage of countries with a composite leading economic indicator value of 100 or greater continues to rise and recently crossed above 72%.
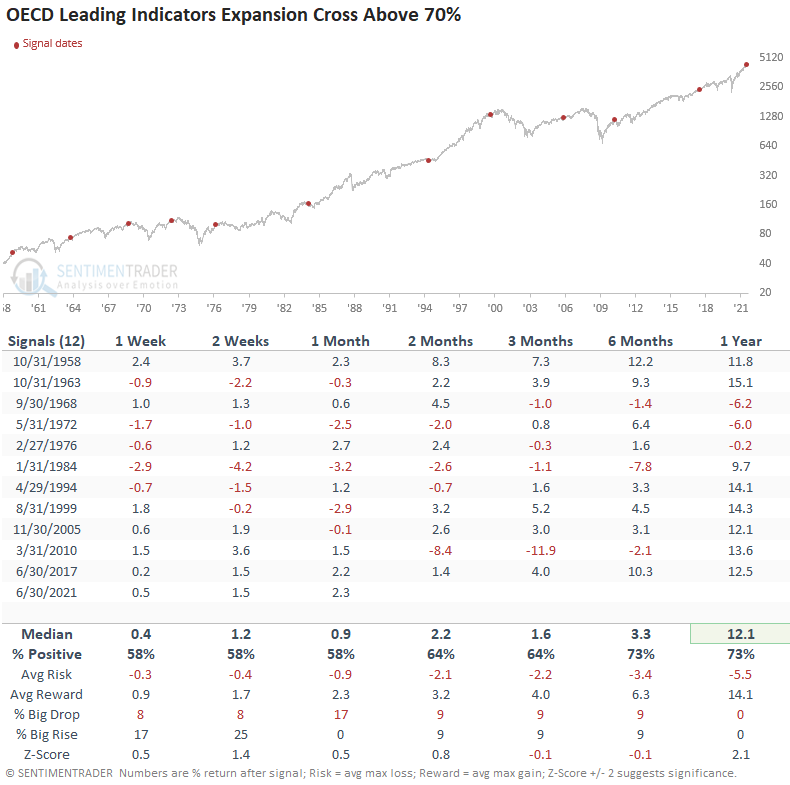
Let's assess the outlook for the S&P 500 index when the percentage of countries in expansion territory crosses above 70%.
SIGNAL PERFORMANCE
Besides the 1-year timeframe, returns look somewhat muted. Once the percentage of countries reaches 70%, the market is susceptible to a consolidation/correction as central bank policy is less accommodative.
I reviewed the outlook when the percentage of countries in expansion territory crossed above 50% in my previous note. Let's now compare the results for the cross above the threshold signal for the two different levels.
COMPARISON TABLE
The table shows that results are still positive but less consistent when the percentage crosses above 70%.
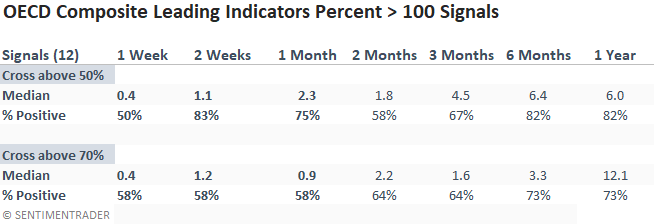
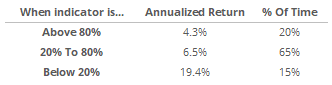
Suppose we use a threshold level method to calculate annualized returns. In that case, we can see that returns become more muted as the percentage of countries in expansion territory approaches 80%.
OECD LEI DIFFUSION CHART
The LEI diffusion index counts the number of countries with a month-over-month increase and measures it as a percentage of the total. The percentage of countries with a month/month increase continues to maintain a very high level. i.e., LEI's continue to rise.
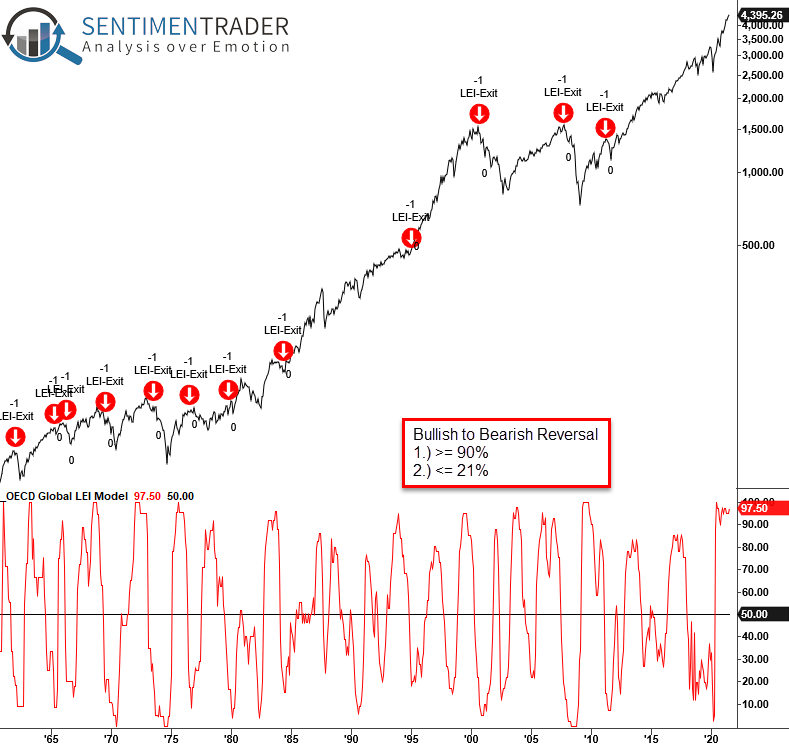
In my previous update, I shared a buy signal for the diffusion index that identifies a bearish to a bullish reversal. Let's now flip the model the other way and measure signal performance when the diffusion index reverses from a bullish to a bearish level.
SIGNAL CRITERIA
- OECD LEI diffusion index crosses above 90%. i.e., the reset after an expansion.
- OECD LEI diffusion index crosses below 21%.
If you were wondering, an optimization process determined the optimal threshold level for the warning alert.
CHART EXAMPLE
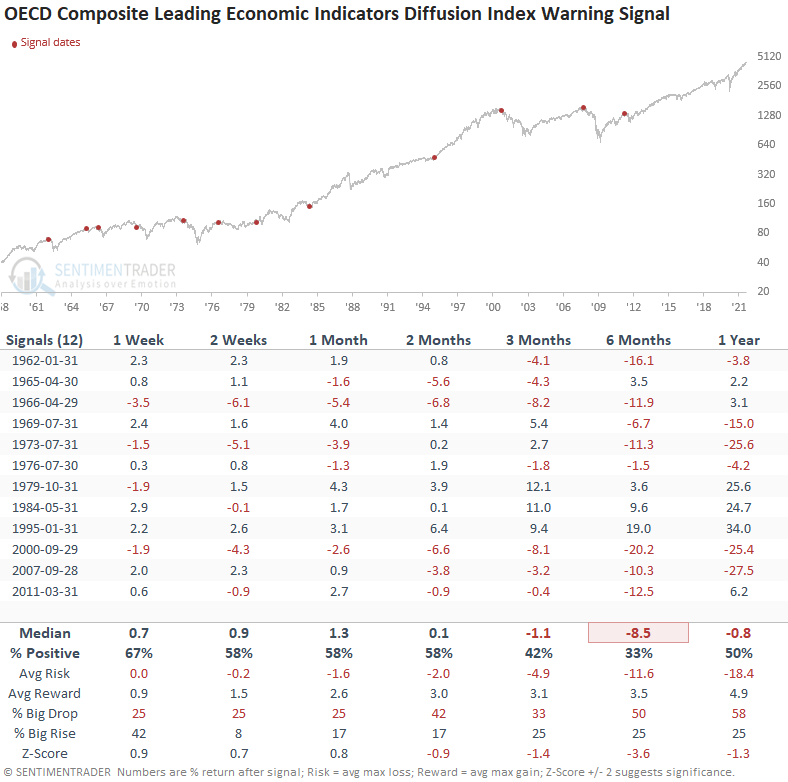
SIGNAL PERFORMANCE
The short-term results look somewhat consistent with historical averages, whereas long-term performance is much weaker.
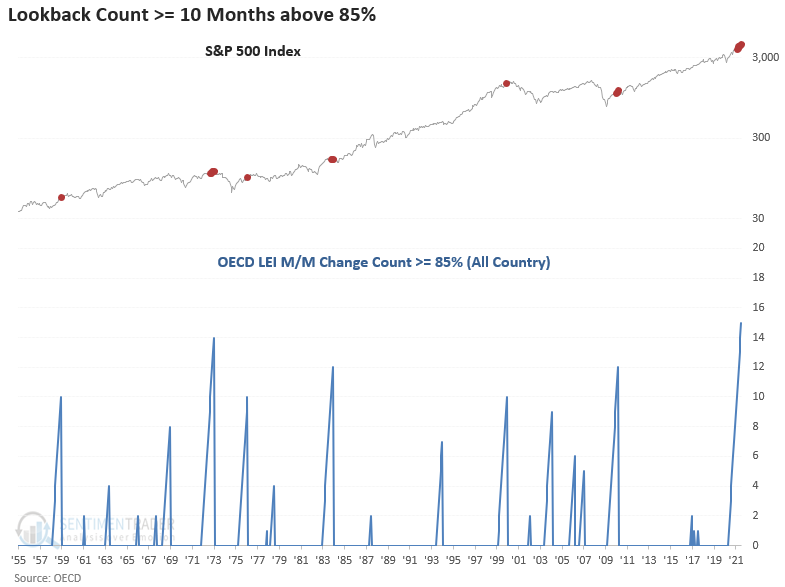
DIFFUSION COUNT
The following indicator measures the number of months when the diffusion index exceeds 85% over an 18-month lookback period. The diffusion index has now surpassed the previous record set in 1973 with a count of 15 months.
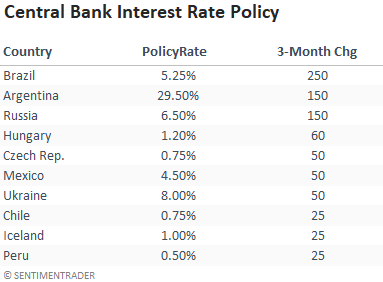
CENTRAL BANK POLICY
Typically, central bank policy impacts LEI data in a bullish and bearish manner. As the table shows, emerging market central banks are lifting policy rates.
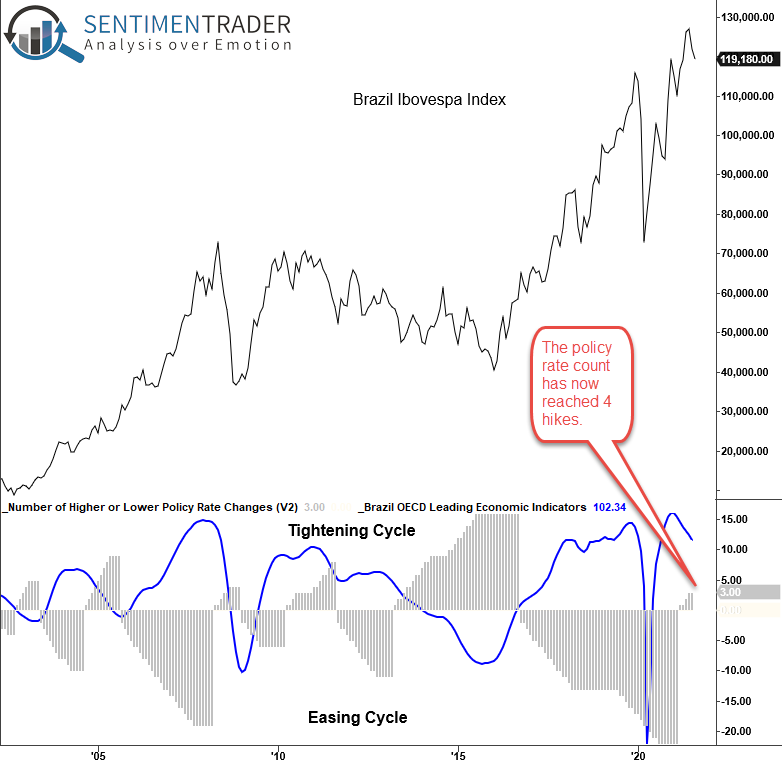
Let's use Brazil as an example as the country's central bank is increasing rates aggressively compared to other countries.
POLICY RATE CHART
As the chart shows, when policy rates increase, the LEI's contract.
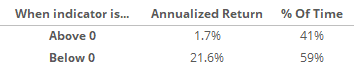
THRESHOLD LEVEL FOR CENTRAL BANK POLICY
When the policy rate count increases, the Brazilian stock market struggles with muted returns.
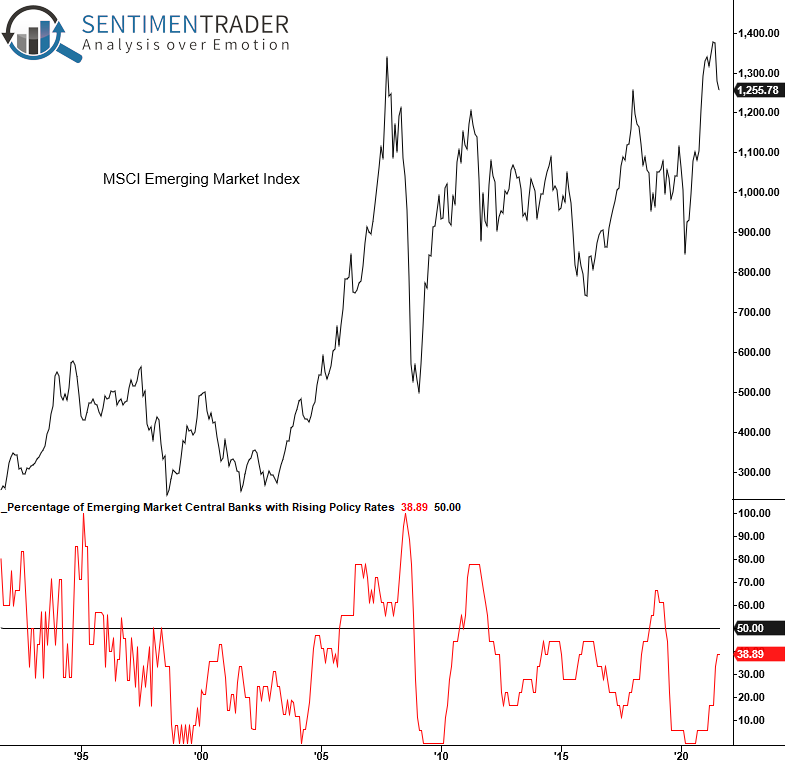
EMERGING MARKET POLICY RATES
Rates are on the rise. Take note.
The OECD composite leading indicators data still looks constructive, except for emerging markets. I would continue to monitor EM central bank policy rates as an aggressive tightening cycle will put further pressure on the LEI data and stock markets.