Seasonality
Unlocking Cyclical Market Patterns
Uncover the hidden rhythms of the market with SentimenTrader's Seasonality. This advanced analytics feature provides unparalleled insights into how specific symbols perform across various timeframes—from individual days of the month to annual cycles. By leveraging intuitive visualizations and detailed statistical breakdowns of average returns, win rates, and gain/loss extremes, Seasonality empowers you to identify historically repeatable patterns and integrate powerful seasonal edges into your trading strategies.
Key Features & Benefits
Pinpoint Daily & Specific-Day Performance
Precisely identify short-term seasonal biases and exploit recurring patterns tied to specific dates or events, enhancing tactical entry/exit decisions.
Actionable Seasonal Trading Edge
Confidently integrate historically validated seasonal trends into your trading decisions, optimizing timing and potentially improving overall profitability.
In-depth Annual & Daily Performance Breakdown
Uncover granular, recurring performance characteristics down to specific calendar days, providing a robust foundation for long-term seasonal strategy development.
Comprehensive Weekly & Monthly Cyclical Insights
Gain clarity on consistent weekly and monthly market behaviors, enabling more strategic planning around common cyclical trends.

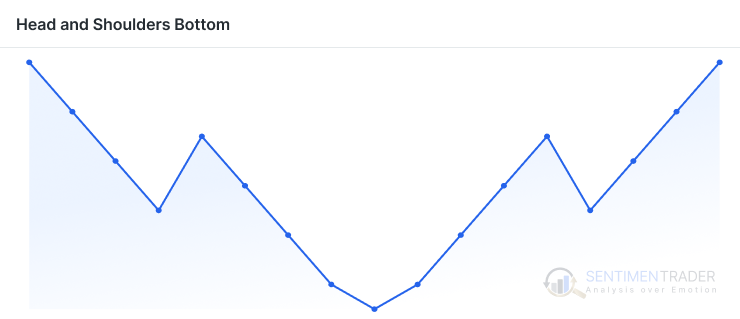
Correlation Pattern Match
A Novel Perspective on Market Patterns: Correlation Pattern Match
Discover SentimenTrader's Correlation Pattern Match solution, a revolutionary tool offering unparalleled insights into historical price pattern analogs for indexes, ETFs, stocks, and commodities. Set specific dates and correlation percentage levels to elevate your data analysis, empowering informed decisions to stay ahead of market trends.
Key Features & Benefits
Comprehensive Pattern Discovery
Uncover highly relevant historical market behaviors across a vast array of assets, precisely tailored to your analytical needs.
Intuitive & Customizable Analysis
Streamline your data analysis and adapt the tool to your unique research and investment strategies with ease.
Insightful Backtesting & Visualization
Validate trading strategies with historical performance data and easily visualize complex market Validate trading strategies with historical performance data and easily visualize complex customize patterns and
common patterns for clearer decision-making.
Empower Informed Decisions
Identify historical parallels with ease thanks to specially shaded charts.
Symbol Correlation
Unveiling Market Relationships: Symbol Correlation
Discover SentimenTrader's Symbol Correlation solution, a powerful tool designed to reveal the dynamic relationships between market assets. By allowing you to select a designated ticker and compare it against up to five other instruments over specified date ranges and time frames, this feature provides immediate access to invaluable correlation insights, helping you understand and navigate market interdependencies.
Key Features & Benefits
Extensive Symbol Coverage
Analyze correlations across a vast and diverse range of financial instruments.
Flexible Timeframe Analysis
Tailor your analysis to capture short-term trends or long-term structural relationships between assets.
Multi-Asset Comparison
Gain a comprehensive understanding of how your chosen asset moves in relation to multiple other key market players.
Dynamic Correlation Visualization
Quickly identify diversification opportunities, risk concentrations, and shifting market dynamics for more informed portfolio decisions.

Asset Correlation
Enhanced Market Relationships: Asset Correlation
Take your market insights to the next level with SentimenTrader's enhanced Symbol Correlation feature. Beyond just showing correlation, this powerful tool allows you to analyze a custom list of tickers (such as IVV, IJH, IJR, EFA, SCZ, EEM, AGG, SHY, IEF, TLT, TIP, LQD, VNQ, GLD, DBC, HYG, USO, DXY) within a user-defined time range. It not only presents a comprehensive correlation table but also integrates key performance metrics like Annualized Return, Daily Standard Deviation, Monthly Standard Deviation, and Annualized Standard Deviation for each ticker, providing a holistic view of both relationships and individual asset characteristics.
Key Features & Benefits
Batch Ticker Analysis
Efficiently assess the interconnectedness and individual characteristics of a diverse portfolio or watchlist of assets.
Custom Timeframe Insight
Gain insights specific to particular market cycles or investment horizons, ensuring the data aligns with your analytical needs.
Integrated Performance Metrics
Understand not only how assets move together but also their individual risk (volatility) and reward profiles at different frequencies.
Comprehensive Risk & Return Overview
Make more informed decisions regarding diversification, risk management, and asset allocation by seeing the full picture of relationships and individual asset characteristics.

My Indicator
A Novel My Indicator: Crafting Custom Market Indicatorson Market Patterns
Unlock unparalleled analytical flexibility with SentimenTrader's "My Signal," a powerful feature that empowers you to create bespoke market indicators tailored precisely to your unique trading insights. By allowing you to combine existing indicators, symbols, or their fundamental data (OHLCV) through various mathematical operations and weighting schemes, My Signal transforms raw data into actionable, custom-designed metrics. This advanced customization gives you the ultimate control to explore novel relationships and gain a distinctive edge in market analysis.
Key Features & Benefits
Dynamic Indicator & Symbol Combination
Generate unique insights and uncover novel market relationships that are not visible through standard, pre-defined indicators.
Advanced Weighted Indicator Blending
Develop highly sophisticated, multi-factor indicators that precisely reflect your nuanced market hypotheses and analytical preferences.
Granular OHLCV Data Integration
Build indicators that leverage the fundamental price and volume dynamics of individual assets, offering a deeper understanding of market action.
Intuitive Customization Workflow
treamline the process of custom indicator creation, making advanced analytical tools accessible for even the most complex strategies.
* Watch our video tutorial and discover how to craft your very own indicator.
My Screen
My Screen: Precision Market Filtering & Opportunity Identification
Discover high-potential trading opportunities with SentimenTrader's "My Screen," a powerful and intuitive stock screening tool designed to filter markets based on your precise analytical criteria. Whether you're seeking assets within specific sectors or broad market indexes, My Screen empowers you to combine various indicators with flexible logic to pinpoint instruments that perfectly align with your trading strategies. With direct integration to BacktestEdge, you can swiftly validate identified opportunities, transforming your market insights into actionable intelligence.
Key Features & Benefits
Targeted Sector & Index Filtering
Focus your analysis on relevant market segments, enhancing the efficiency and precision of your search for trading candidates.
Customizable Multi-Condition Logic
Craft highly specific screening criteria (e.g., "Trend Score = 10 AND Optix MA5 > 60") to precisely identify assets exhibiting desired characteristics.
Instant Opportunity Identification
Quickly discover actionable trading signals and investment candidates that perfectly match your pre-defined analytical framework.
Seamless Backtesting Integration & Pre-built Screens
Expedite your research workflow from discovery to validation, and leverage expert-designed screens to jumpstart your analysis.
* Watch our video tutorial and discover how to craft your very own screen.
My Signal
My Signal: Tailored Trading Alerts & Intelligent Signal Generation
Transform your market analysis into actionable trading opportunities with SentimenTrader's "My Signal" feature. This powerful tool empowers you to define highly specific trading signals based on a vast array of indicators and complex logical conditions, across any symbol and timeframe. Whether you're looking for simple single-condition triggers or intricate multi-step patterns, My Signal delivers real-time identification and customizable alerts, ensuring you never miss a critical market entry or exit point.
Key Features & Benefits
Highly Customizable Signal Definition
Create bespoke trading rules that perfectly align with your unique strategy, capturing nuanced market opportunities with unmatched precision.
Expansive Indicator & Relation Support
Access an unparalleled range of analytical tools to identify patterns and divergences, empowering deeper market insights for your custom signals.
Advanced Multi-Condition Logic
Build highly intelligent and adaptive trading signals that react to complex market dynamics and multi-stage confirmations, reducing false positives.
Real-time Monitoring & Notification
Act promptly on validated trading opportunities with immediate visual feedback and timely email alerts, ensuring you capitalize on market movements as they happen.
* Watch our video tutorial and discover how to craft your very own signal.
My Watch List
My Watch List: Personalized Market Monitoring & Instant Insights
Empower your daily market surveillance with SentimenTrader's "My Watch List," a highly customizable tool designed to give you instant access to the most relevant data for your chosen tickers. Beyond basic price tracking, My Watch List allows you to overlay a selection of proprietary and technical indicators, including Optix, Trend Score, RelTrend Score, and Moving Averages, across various lookback periods. This personalized dashboard ensures you quickly see the latest performance and sentiment data for your critical assets, all saved for effortless, continuous monitoring.
Key Features & Benefits
Personalized Ticker Tracking
Streamline your daily market review by concentrating on the instruments that matter most to your portfolio or research.
Customizable Indicator Overlay
Gain immediate, context-rich insights into the sentiment, trend strength, relative performance, and price momentum of your monitored assets.
Instant Data Visualization
Efficiently track key metrics for multiple assets simultaneously, allowing for rapid identification of opportunities or potential risks.
Persistent & Accessible Monitoring
Ensure continuous, effortless monitoring of your most important assets with personalized data delivered instantly upon access.

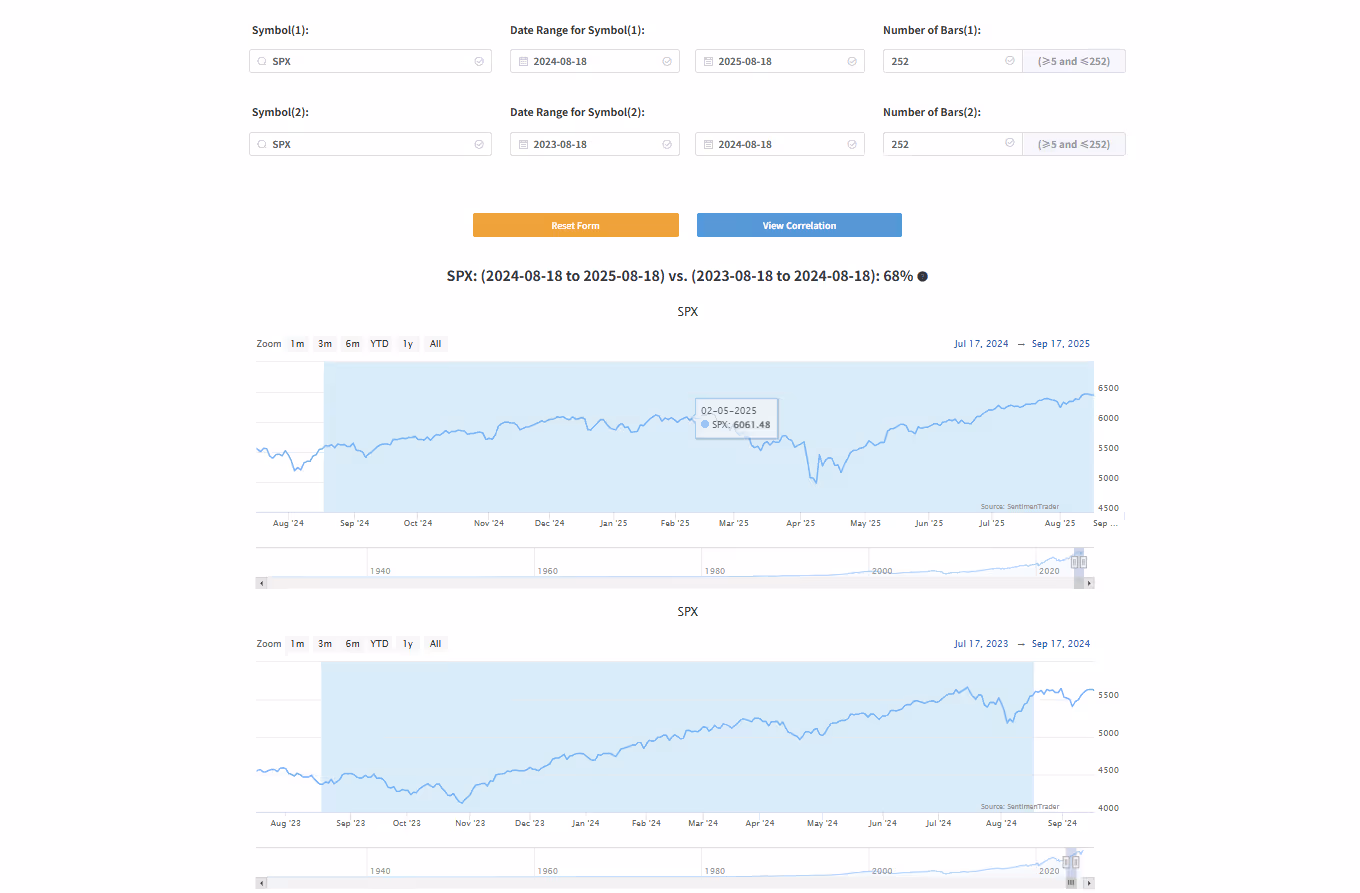
Date Range Correlation
Date Range Correlation: In-Depth Trend Comparison & Insights
Empower your market analysis with SentimenTrader's new "Date Range Correlation" feature. This powerful tool is designed to give you instant, detailed analysis of the trend similarity between different stocks over distinct time periods. Beyond basic price comparison, "Date Range Correlation" allows you to evaluate asset performance during specific historical events or different market cycles through a quantified correlation percentage. This feature ensures you quickly understand the relationships between different assets, providing crucial context for your research and decisions.
Key Features & Benefits
Multi-Dimensional Trend Comparison
Easily compare the performance of the same stock under different market conditions, or deeply analyze the trend relationship between two different stocks over the same or distinct time periods.
Customizable Date Analysis
Set unique date ranges for each stock, enabling you to precisely focus on specific events or time periods of most interest for in-depth research.
Instant Data Visualization
The system immediately generates clear trend charts with a correlation percentage, helping you efficiently identify potential correlations or risks.
Persistent & Accessible Insights
Gain quick access to key insights about the market and your critical assets through an intuitive interface, supporting continuous, systematic market research.