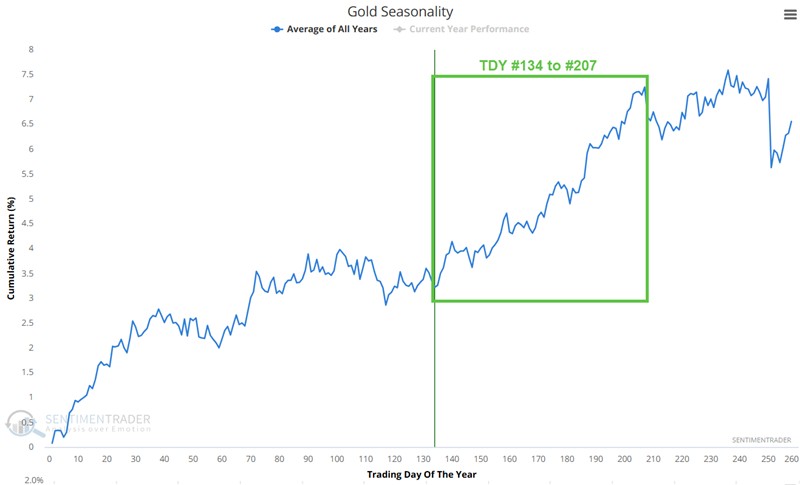
SentimenTrader Reports
Your go-to source for data-driven research, analysis and tools.
- All
- TradingEdge
- SentimentEdge
- Kaeppel's Corner
- ModelEdge
- PortfolioEdge
- Public
ModelEdge report
An expansion in 52-week highs bodes well for stocks
For the first time in more than 18 months, the 10-day average of NYSE 52-week highs as a percentage of highs and lows exceeded 90%, triggering a buy signal for stocks. With more and more issues reaching new highs and transitioning to long-term uptrends, the case for a new bull market looks encouraging.
Kaeppel's Corner
The McClellan indicators join the breadth parade
The McClellan Oscillator and McClellan Summation Index measure the strength or weakness of breadth in the stock market at any given time. Like many breadth indicators, they have both given given favorable signals recently. Herein we take a closer look at what this typically means for the stock market.
SentimentEdge report
Optimism is high after completely reversing last year's panic
After reaching deeply pessimistic territory last fall, the spread between Dumb Money and Smart Money Confidence has fully cycled to the opposite extreme. During bear markets, high optimism is worrying. But after sentiment cycles from one extreme to the other, returns tend to be positive, and short-term performance should give a clue as to whether it's more likely to fail.
TradingEdge Weekly
TradingEdge Weekly for Feb 3 - Signs of momentum are everywhere, seasonal positives, struggling commodities
This week, we saw a continued surge in many momentum and trend-following buy signals. They have a good track record at preceding medium- to long-term gains for stocks. The pre-election seasonal bias is another tailwind, especially for certain sectors. Some have gotten a head start, like Homebuilders. Commodity trends are getting weaker.
ModelEdge report
Industry groups are surging, triggering several bullish alerts
More than 75% of sub-industry groups closed up more than 20% from a 1-year low. After similar signals, the S&P 500 was higher at some point in the next year in every case since 1938. And a majority of groups are now more than 5% above their 200-day average, suggesting long-term trends are more sustainable.
ModelEdge report
A new IBD power trend signal for the Nasdaq Composite
The Investors Business Daily Power Trend strategy triggered a new buy signal for the Nasdaq Composite. After similar trend changes, the composite showed an annualized return of 18.1% versus only 5.4% when a sell signal occurs.
Kaeppel's Corner
A three sector portfolio for the next three months
An old market adage states, "the market doesn't repeat, but it often ryhmes." Overall historical stock market performance during pre-election years is one example. The performance of certain sectors during the current three-month period within an election year is another. In this piece we take a closer look.
Kaeppel's Corner
A long-term momentum indicator turns favorable
Momentum is an important factor in the stock market. A simple but effective momentum indicator flashed a favorable signal at the end of January. This piece details the indicator's history and what it may mean for investors in the year ahead.
SentimentEdge report
Investors continue to pull back on leverage
Even though stocks stabilized in October, investors keep pulling back on margin loans. Debt has declined for 14 out of 18 months, and the year-over-year plunge is dramatic. Behavior like this has tended to precede very good returns over the medium- to long-term in the S&P 500.
ModelEdge report
The homebuilders suggest the bear market is over
Homebuilders transitioned from a downtrend to an uptrend, triggering a buy signal for the group and the broad market. After similar conditions, the builders and the S&P 500 were higher in all but one case a year later.