The 200-Day Moving Average for Copper

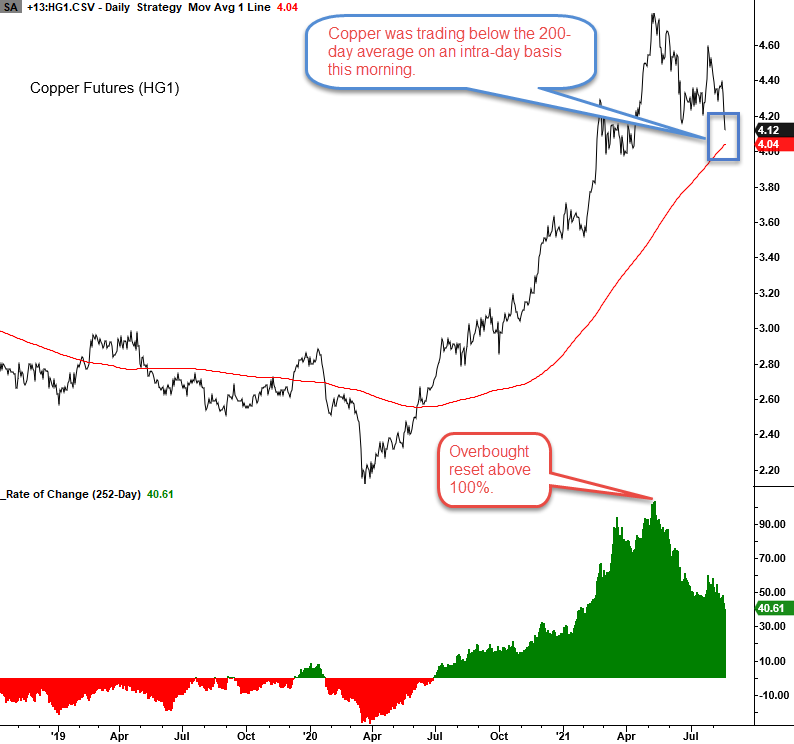
When I fired up the quote machine this morning, I noticed that copper (HG1) was trading below its 200-day moving average on an intraday basis. The moving average is a popular indicator for assessing the underlying trend condition of an asset. While a cross above or below the moving average might not seem noteworthy, the context around a potential trend change can be meaningful.
Until its peak in May, copper had been ripping higher in one of the strongest rallies from a significant low in history. The rally was so substantial that the 252-day rate of change crossed above 100%. If you've studied momentum as I have, you will know that intense upward thrusts in price rarely form a V-top. Typically, you see a correction in price that slows the upside momentum. Once the strong momentum is gone, the market is more vulnerable to a correction that can flip the trend from positive to negative.
Let's conduct a study to assess the forward return outlook for copper when the metal closes below its 200-day average and include the following condition. The 252-day rate of change for copper must have crossed above 100% for a signal to be considered.
So, the study captures the first close below the 200-day moving average after the 252-day rate of change has crossed above 100%.
CURRENT DAY CHART
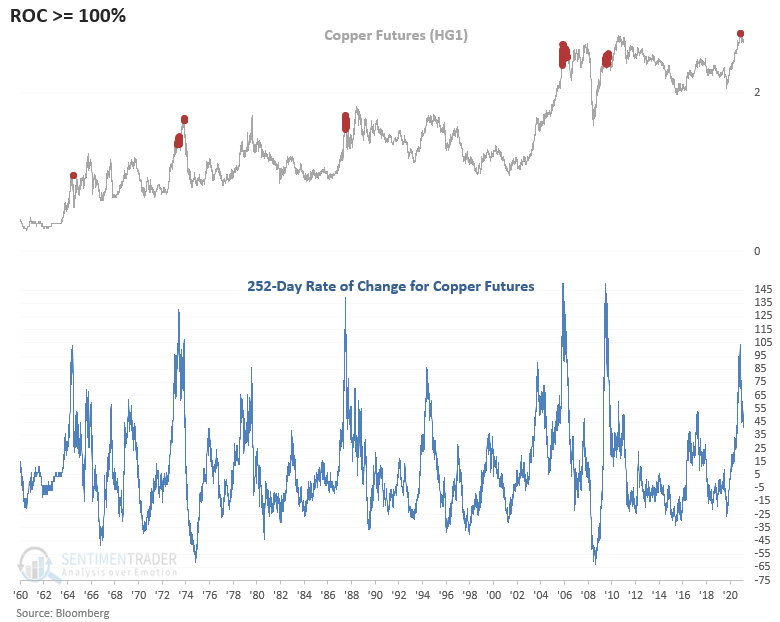
HISTORICAL CHART
Since 1959, the 252-day rate of change for copper has crossed above 100% only six times. Momentum off the pandemic crash low was historic.
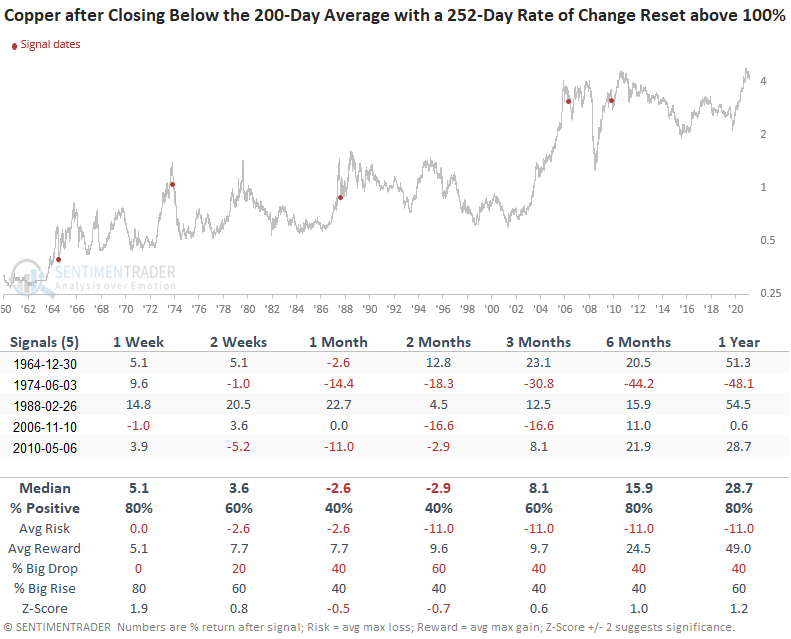
HOW THE SIGNALS PERFORMED
One can see a pretty clear pattern even though the sample size is small. Once copper closed below the 200-day average, it tended to rebound in the short term. After the bounce ran its course, the metal would back and fill lower, followed by a resumption of the uptrend. 1974 is the exception.