
Small-Cap Breadth Hasn't Done This Since The Pandemic Crash

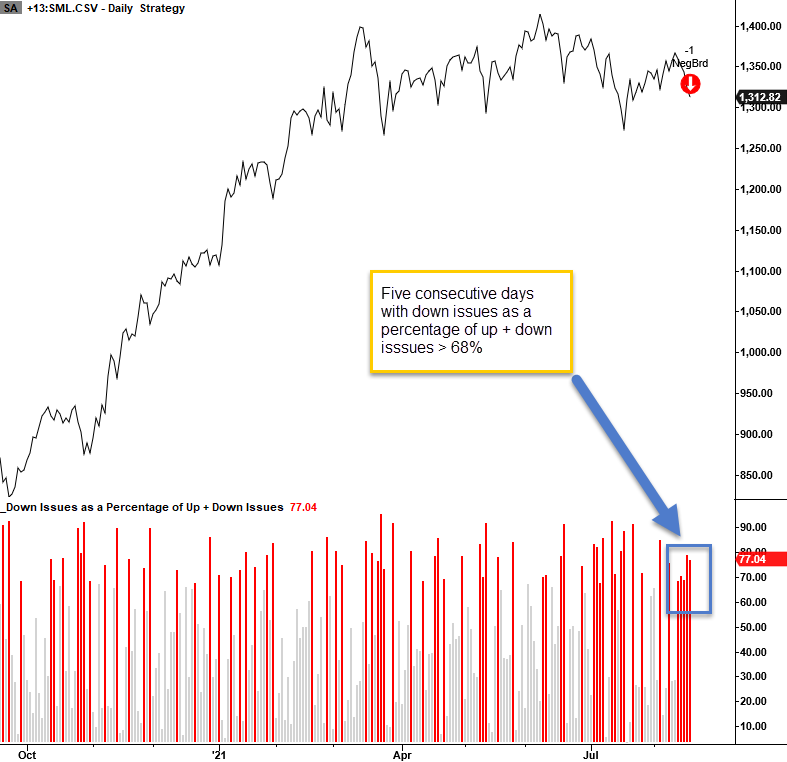
The S&P 600 small-cap index has now recorded five consecutive days with down issues as a percentage of up and down issues greater than 68%. The weak breadth pattern is typically only seen during major market corrections or bear markets. The last instance occurred during the pandemic crash.
Let's conduct a study to assess the outlook for the small-cap index when down issues as a percentage of up and down issues are greater than 68% for five consecutive days.
CURRENT CHART
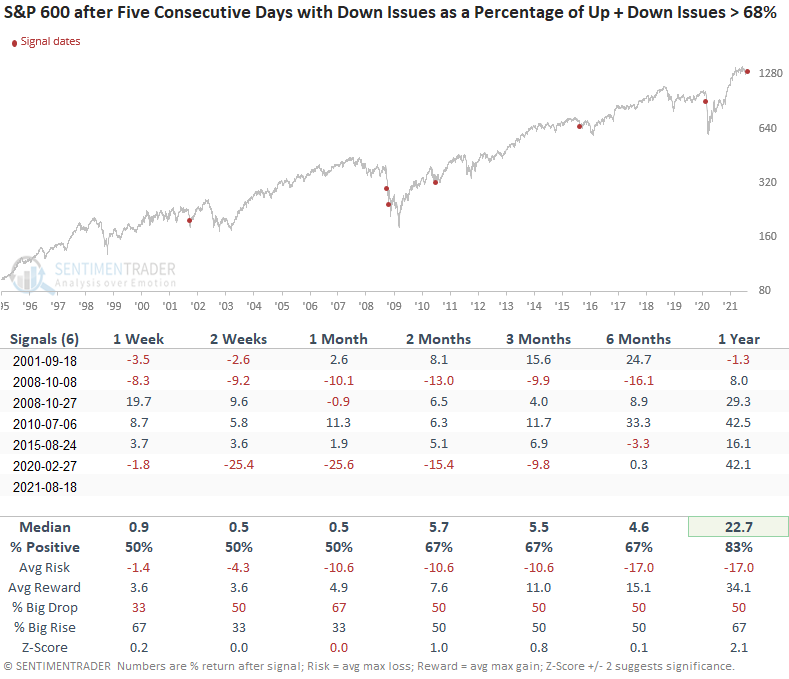
HOW THE SIGNAL PERFORMED
Results look somewhat anemic during the first month and then get better through time. With signals occurring during corrections and bear markets, it's not a total surprise to see solid 1-year numbers.
Please note the small sample size.
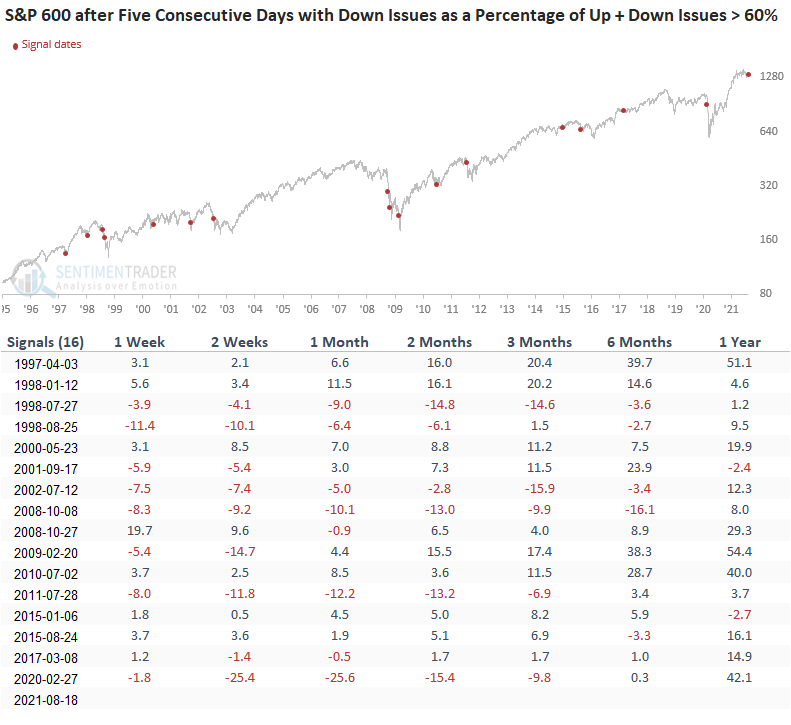
Let's drop the down issues parameter to 60% and keep the five consecutive days condition to see if we can assess a larger sample size.
HOW THE SIGNAL PERFORMED
Results look weak in the first 1-4 weeks, especially the 2-week window. As was the case with the original study, performance gets better with time.
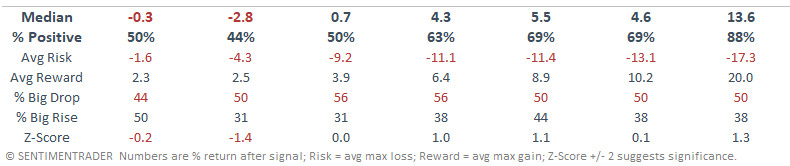
I've been highlighting the deteriorating absolute and relative trends for small-cap indexes for some time now in my weekly ETF trend update on Mondays. Given today's study, I don't see any reason to change my thinking on the group-Small-caps remain in the penalty box.