Transports Reverse Up Signal

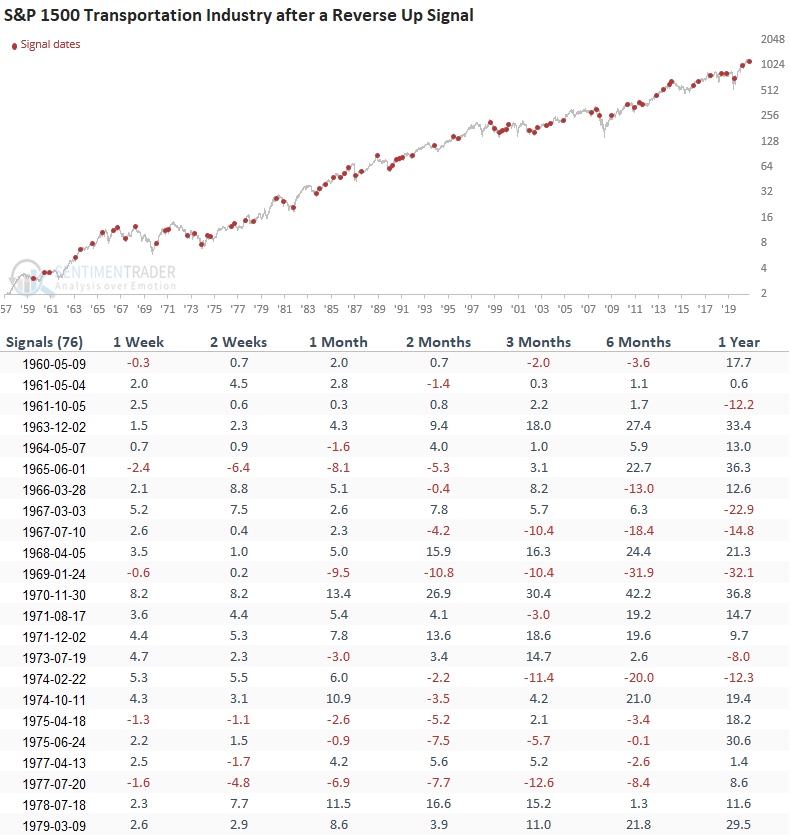
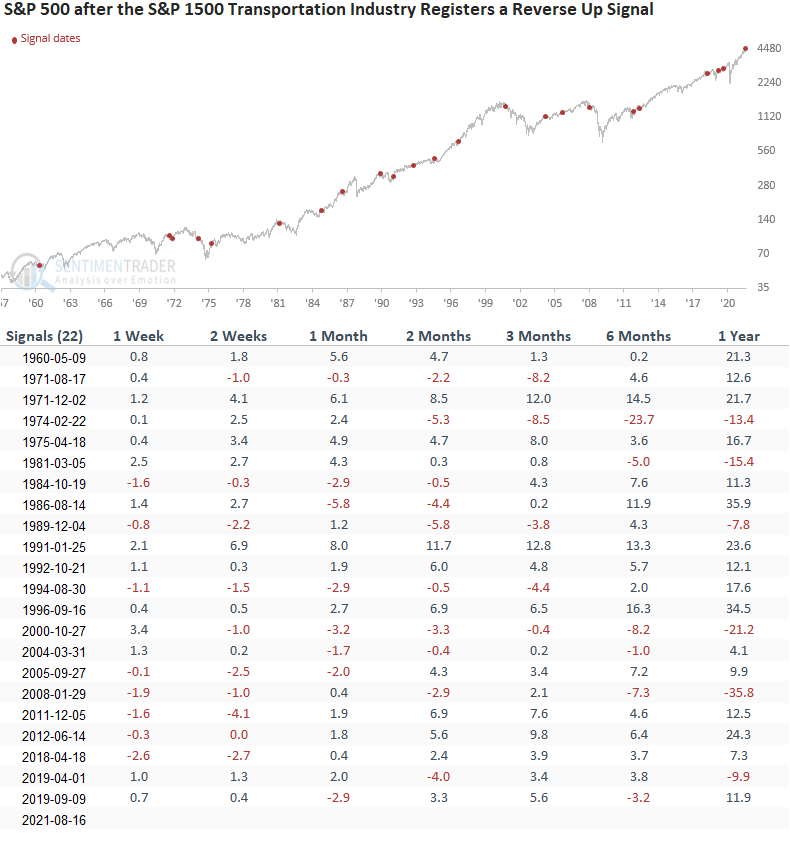
The S&P 1500 Transportation Industry Group registered a reverse-up buy signal at the close of trading on 8/16/21. If you recall, the reverse-up concept identifies when an asset closes at a 1-month low and reverses higher to close at a 1-month high in less than ten trading days. If you're interested in reading the original concept note, please click here.
While I monitor the concept for alerts across a broad basket of securities, I closely watch a handful of cyclical industries that provide an important economic message. The transports are one of those groups.
Today's note aims to review the outlook for the transportation industry group after a reverse-up signal and assess the overall market message.
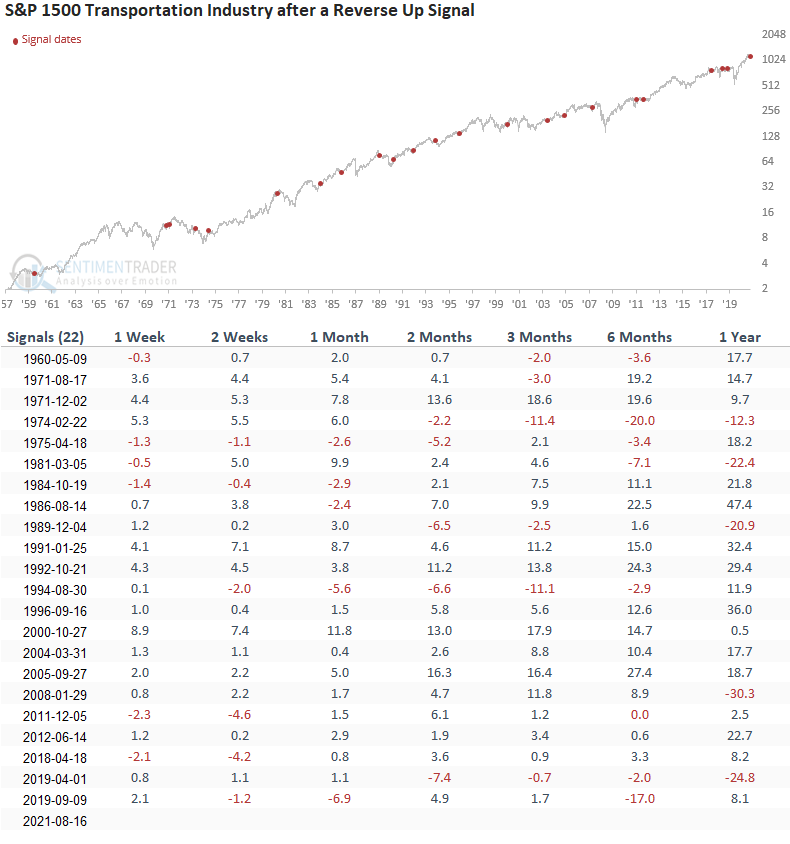
HOW THE SIGNALS PERFORMED
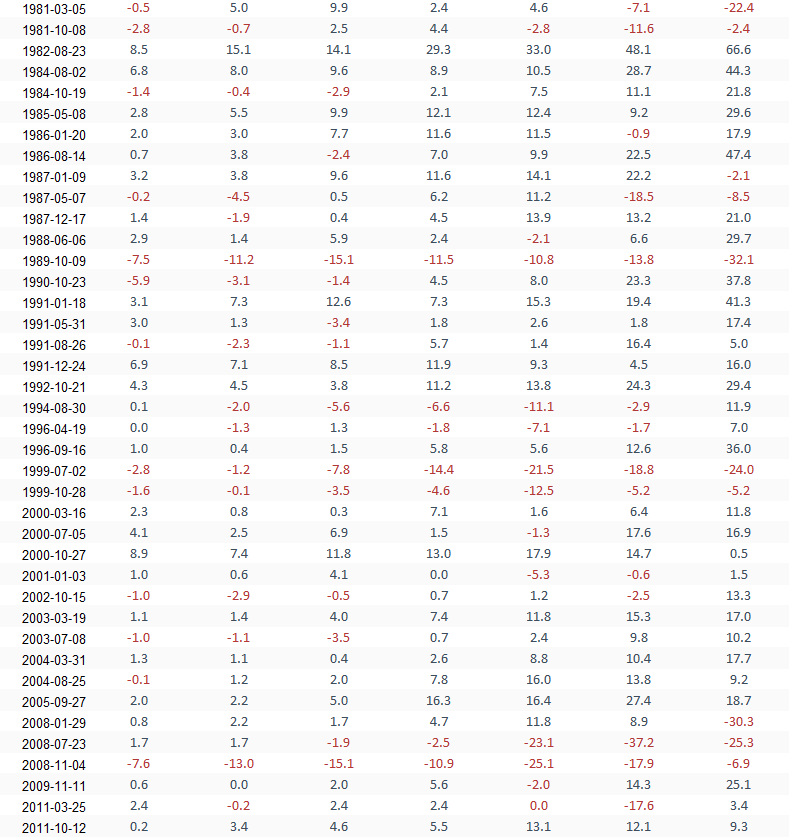
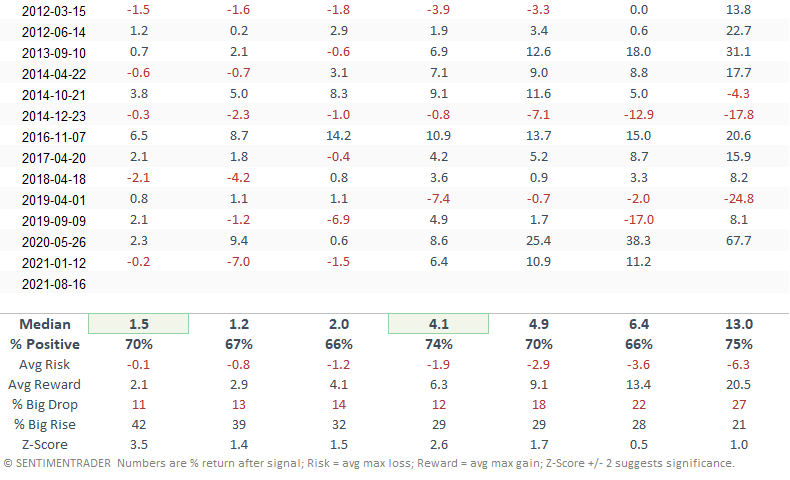
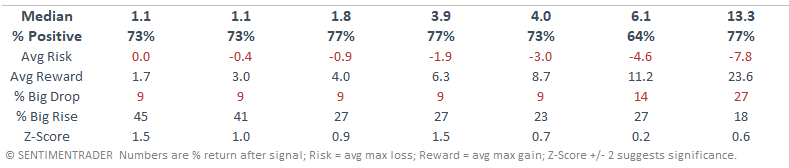
Performance looks good in the short term, especially the 1-week results.
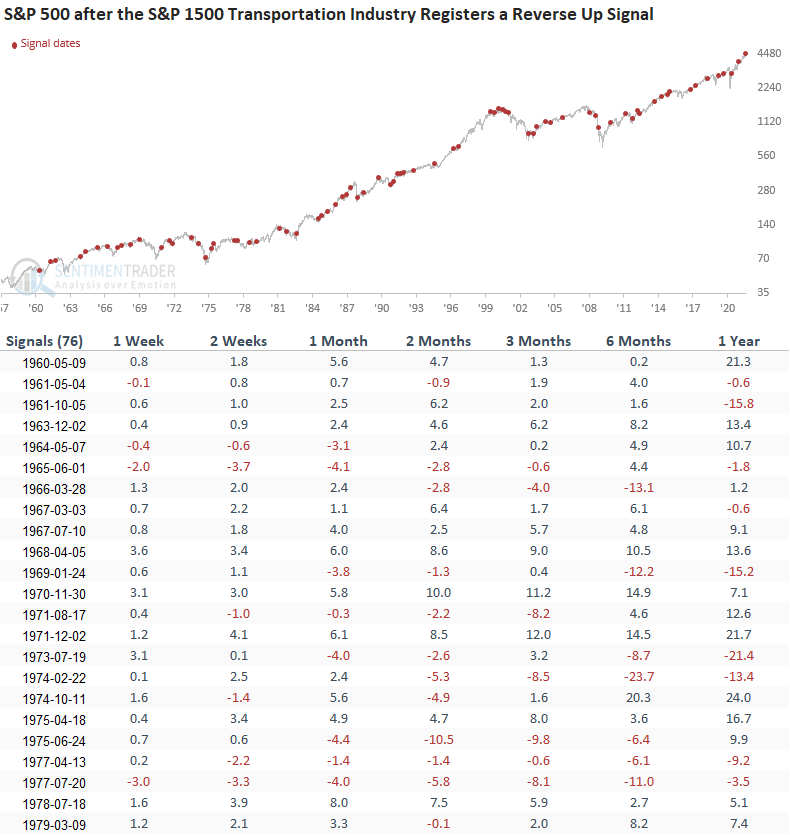
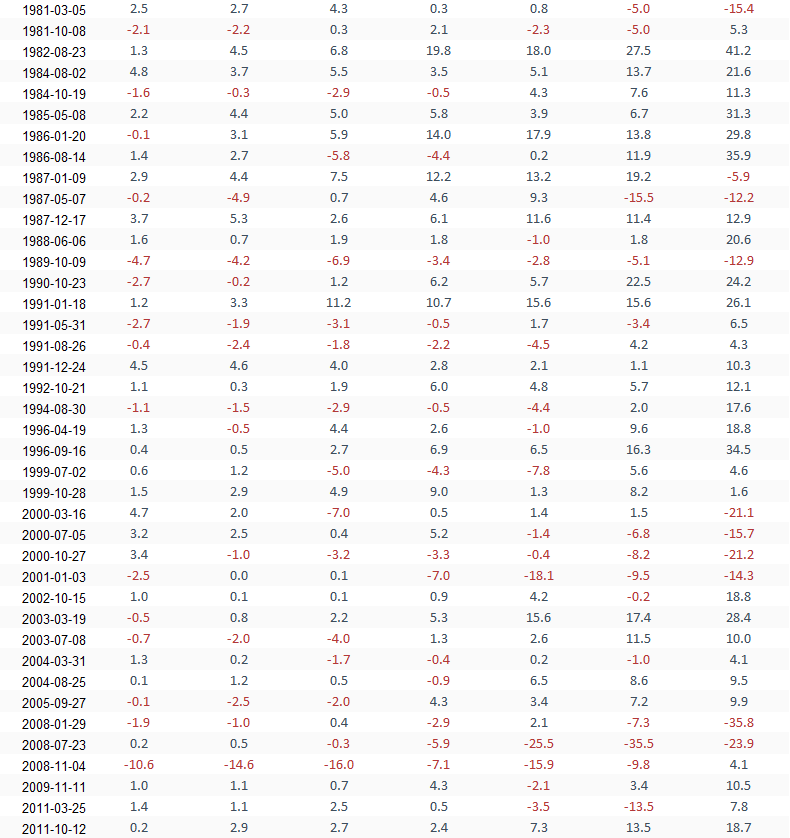
Let's apply the same signals to the S&P 500 to assess the outlook for the broad market.
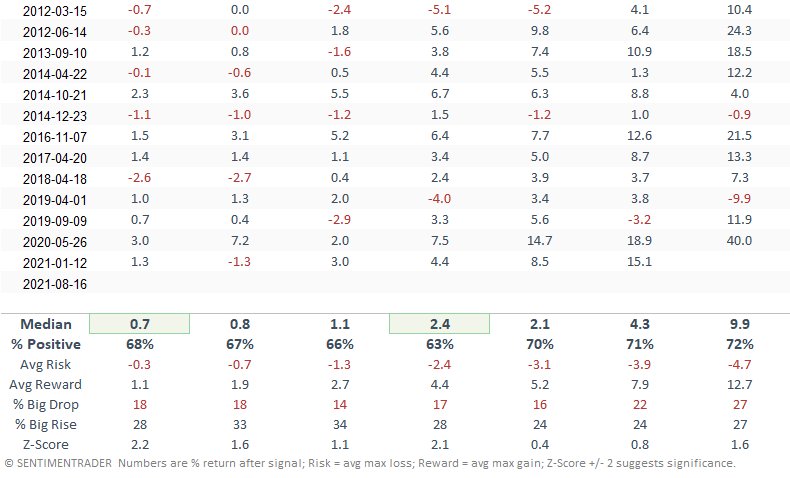
HOW THE SIGNALS PERFORMED - S&P 500
While the results look pretty good for the broad market, I would note that the transports provide a better opportunity.
Let's include some additional parameters to identify other historical instances that look similar to the current pattern. We will require that the transports have not made a new high in more than 2-months, and when a signal occurs, the industry is trading down greater than 5% but less than 15% from a 252-day high. i.e., a consolidation with similar parameters to the current pattern.
HOW THE SIGNALS PERFORMED
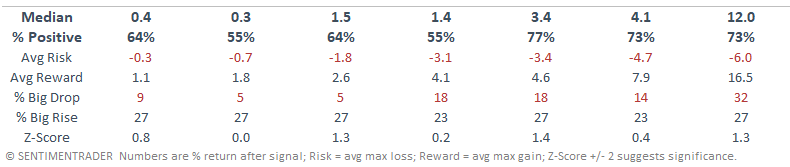
The results continue to look good in the short term, even though none of the timeframes showed a notable z-score. However, the consistency of the signal improved across several windows.
Let's apply the same signals to the S&P 500 Index
HOW THE SIGNALS PERFORMED - S&P 500
While not detrimental, the short-term results are less favorable.
Given today's study results, one could argue that transports outperform in the short-term as the broad market takes a breather.
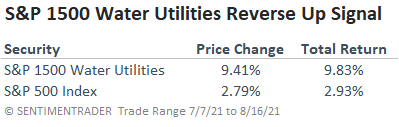
In my original reverse-up concept note, I shared a real-time signal for the S&P 1500 water utilities sub-industry group. If you were wondering how that signal is performing, please see below.