
A Closer Look at Drawdowns

So far, 2021 has been the "What, Me Worry" year in the stock market. Ironically, many people that I talk to seem to be worried about all kinds of things. But whatever the concerns, the stock market has just shrugged it all off. At least so far.
And - ironically - that seems to be one of the things raising concern among some investors, i.e., that the market is due to fall solely because it hasn't so far in 2021.
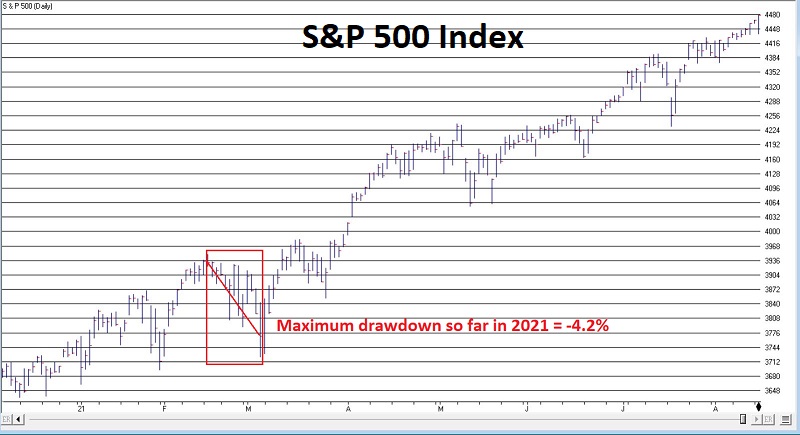
To this point in 2021, the largest peak-to-valley decline for the S&P 500 Index (using daily closing prices) was just -4.2%, registered between February 12th March 4th (you don't even remember it, right?). This decline - and the S&P 500 Index for the year - appears in the chart below (courtesy of AIQ TradingExpert).
Of course, the year is far from over, and the occasionally troubling months of September and October still lie directly ahead. As a result, there seem to be many people thinking that a sharp selloff is due.
So, is it OK to think it might be "smooth sailing" for the rest of the year? Or are we edge on the of the precipice? The truth is we cannot predict. But we can look at history to try to put things in some perspective.
In a nutshell:
- There are any number of reasons why a sharp selloff in the market could begin at any time (for example, see here from Jason)
- HOWEVER, the fact that it hasn't had much of one so far this year is NOT one of those reasons
HISTORICAL PERSPECTIVE: THE "EASY" YEARS
All drawdowns discussed below are measured using daily closing prices for the S&P 500 Index and measure the largest peak-to-valley decline within a given calendar year.
In terms of drawdown performance, 2021 is in rare company but is not unprecedented:
- The current maximum drawdown for 2021 is -4.2%
- In the past 93 calendar years (1928 through 2020), there have been 3 calendar years that witnessed a maximum drawdown for the full year that did not exceed -4.2%
Those "Goldilocks" years were:
- 1995 - maximum Intra year drawdown of -2.5%
- 2017 - maximum Intra year drawdown of -2.8%
- 1964 - maximum Intra year drawdown of -3.5%
The table below displays the 10 years since 1928 with the smallest Intra year close-to-close decline.
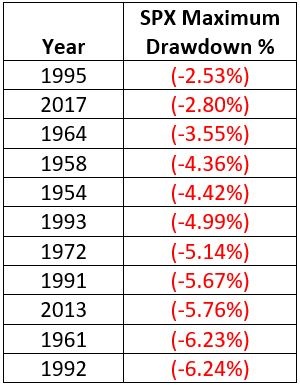
While it may sound ominous to some that the maximum drawdown so far this year is a mere -4.2%, the table above argues that it does not necessarily portend that some major decline is lurking out there before the end of the year.
HISTORICAL PERSPECTIVE: THE "TOUGH" YEARS
The table below displays the 10 years that witnessed Intra year declines of over -30% to cover all the bases.
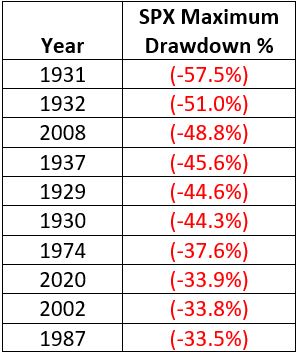
Most of the years listed in the table above were tough years for the stock market throughout. The two notable - and most comparable - exceptions are 1929 and 1987. Both of those years saw the market rally sharply for the first eight or nine months before "crashing" in October. Hopefully, 2021 will avoid a similar type of fate.
But for now, it is fair to note that a "great bull market year that falls completely apart" is also not unprecedented. So investors need to remain alert.
HISTORICAL PERSPECTIVE: THE DECILES
The table below displays results in deciles. The 10% of years with the lowest Intra year drawdowns and the range of those drawdowns appear in Row 1 of data, and so forth, until the worst 10% of years appears in the last Row.
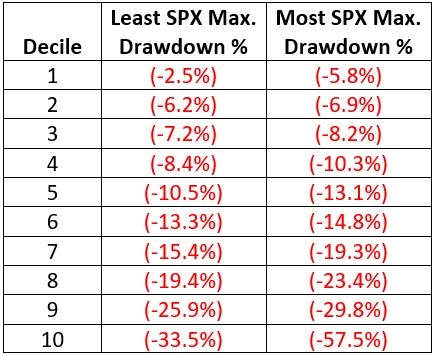
It is interesting to note that fully 34 years (or 35% of all 97 years in our test) never saw a market decline of more than -10%.
SUMMARY
So, in sum:
- There is no guarantee that the market will not falter between now and the end of the year
- September has historically been the worst-performing month for the market, and October has a history of sharp, occasional selloffs, so investors must pay close attention in the months ahead
- But, on the positive side, just because the market has been strong so far throughout the year IS NOT by itself a sign that trouble lies ahead