
Energy Bad News and Good News - Part I

There is good news and bad news in the energy sector. In this piece - Part I - we will highlight the bad news, and in Part II, we will highlight the potential good news.
SEASONALITY - PART I
- The chart below displays the Annual Seasonal Trend for ticker XLE (Energy Select Sector SPDR Fund ).
- The average performance for the sector during the period that extends from Trading Day of Year #156 through Trading Day of the Year #208 is highlighted in the chart above, as well
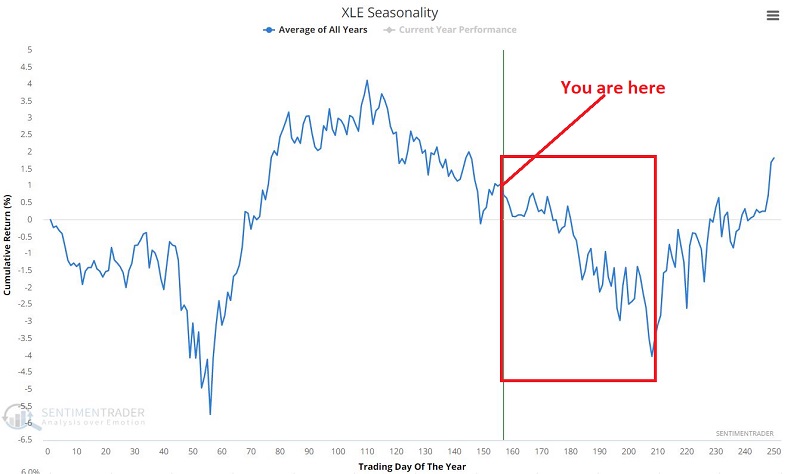
The implications for the immediate future are fairly obvious in the chart above (with the standard warning that seasonality is climate, not weather, and that there is no guarantee that XLE will do what it has typically done in the past in the days, weeks, and months ahead).
The chart below displays the cumulative % +(-) for the S&P 500 Energy Sector during this period each year since 1953.
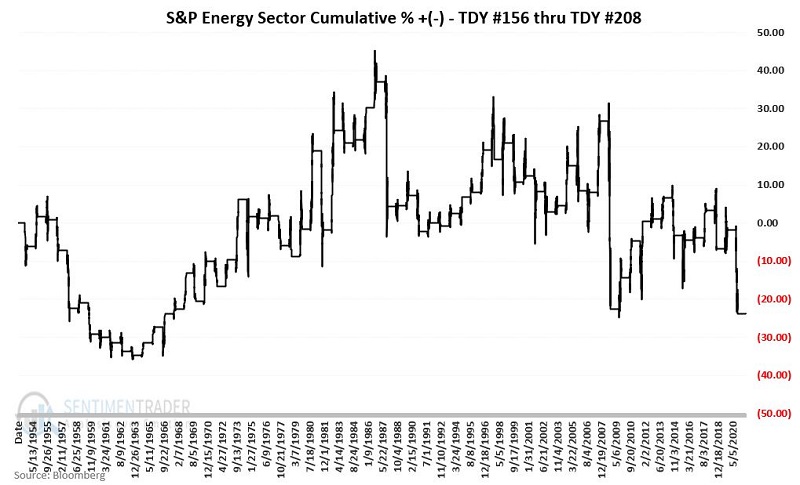
The results are not "disastrous" but rather a picture of "inconsistency." Some years are great, some years are awful, and good luck predicting one from the other in advance every year. It should be noted that:
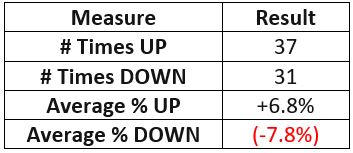
- Although the energy index experienced a net loss during this period, it actually showed a gain more often than a loss
- But the average losing period was larger than the average winning period
The obvious rhetorical question is, "Why bother investing here during this time?"
In 2021, this "unfavorable" period extends from the close on 8/16/2021 through the close on 10/26/2021.
SEASONALITY - PART 2
The table below displays the cumulative % return for the S&P 500 Energy Sector by month from January 1953 through December 2020.
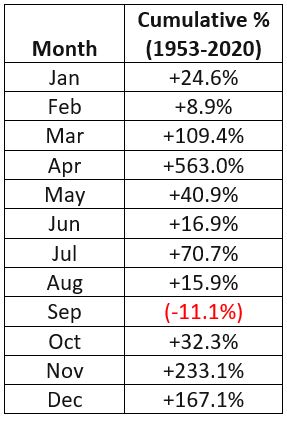
Does anything jump out at you? Anything at all? Perhaps you noticed that only one month - the month of September - has shown a net loss over the 68-year test period.
The chart below - which looks a lot like the chart above - displays the cumulative % return for the S&P 500 Energy Sector ONLY during September every year since 1953. These results also raise the question, "Does this look like a good time to commit money to the energy sector?"
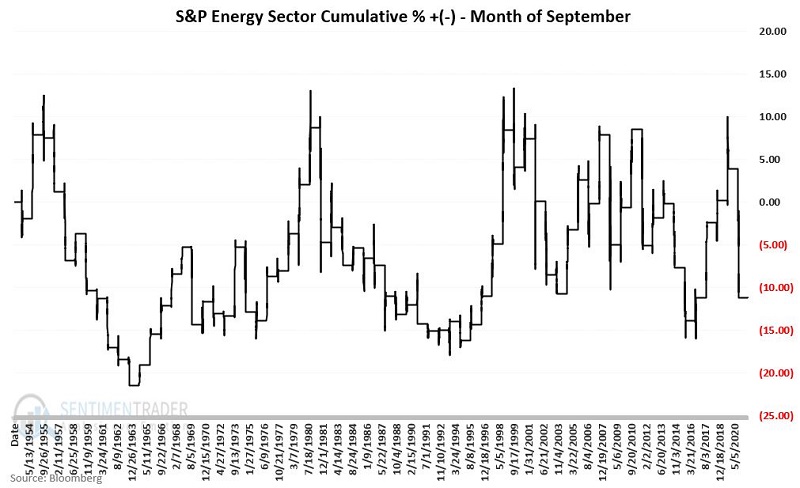
For the record, September has shown a gain 35 times and a loss 33 times. So, we are basically talking about a coin flip.
Still, the real overarching point is - Does a "coin flip" sound like a good trading strategy to you? If so, please consider the following:
Jay's Trading Maxim #48: One of the keys to long-term success is putting the odds on your side as much as possible, trade after trade after trade.
SUMMARY
The mistaken assumption that people often make when looking at the information above is to assume that "energy will decline" in the weeks and months ahead. But that's not really true. The real implication of all of the above information is:
- Energy could easily rally sharply in the months ahead
- However, unless you like roller coasters and low probability trades, you'd better have a very compelling reason to play the long side