Headlines
|
|
Weekly Wrap for Mar 19 - A few cracks as energy and bonds get hit:
This week, there were more signs that internals remain healthy, with the biggest worry simply that things have been so positive for so long, that forward returns tend to be muted at best. Bonds got hit hard, but signs are mixed about whether similar declines preceded higher prices.
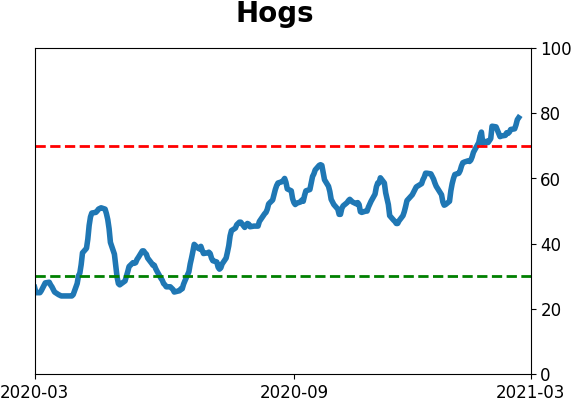
The latest Commitments of Traders report was released, covering positions through Tuesday: The 3-Year Min/Max Screen shows that "smart money" commercial hedgers established a multi-year high net long position in the Mexican peso, accounting for nearly 25% of open interest. The Backtest Engine shows that forward returns were better when hedgers reversed a net long position. When it crossed back below zero, the peso gained 64% of the time over the next 2 months. Hedgers sold hogs aggressively, now holding more than 27% of open interest net short, nearly a record amount of short exposure. Whenever it was below 25% net short, hogs were positive 6 months later only 24% of the time per the Backtest Engine. Their positions in 10-year Treasuries, 30-year Treasuries, and major stock indexes were just minor reversals from prior weeks and not giving much of a signal.
Bottom Line:
See the Outlook & Allocations page for more details on these summaries STOCKS: Weak sell
The extreme speculation registered in January and February is starting to get wrung out. Internal dynamics have mostly held up, so a return to neutral sentiment conditions would improve the forward risk/reward profile substantially. We're still a ways off from that. BONDS: Weak buy
Various parts of the market have been hit in recent weeks, with mild oversold conditions. The Bond Optimism Index is now about as low as it gets during healthy bond market environments. Fixed income isn't responding well, so that needs to be monitored in case it's transitioning to a longer-term negative market environment. GOLD: Weak buy
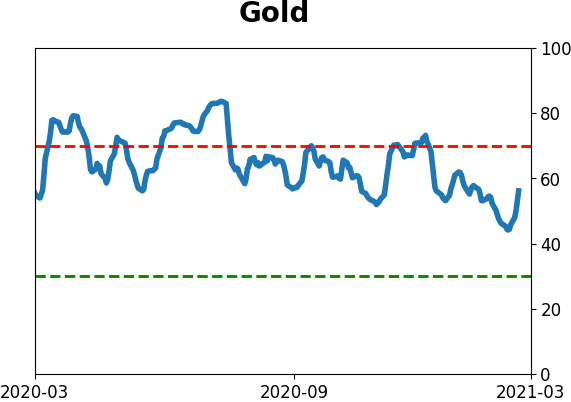
A dollar trying to rebound from a severe short position has weighed on gold and miners. The types of signals they've given in recent weeks, within the context of their recent surge, have usually resulted in higher prices over a medium- to long-term time frame. Like bonds, gold and miners aren't responding very well, and this needs to be monitored.
|
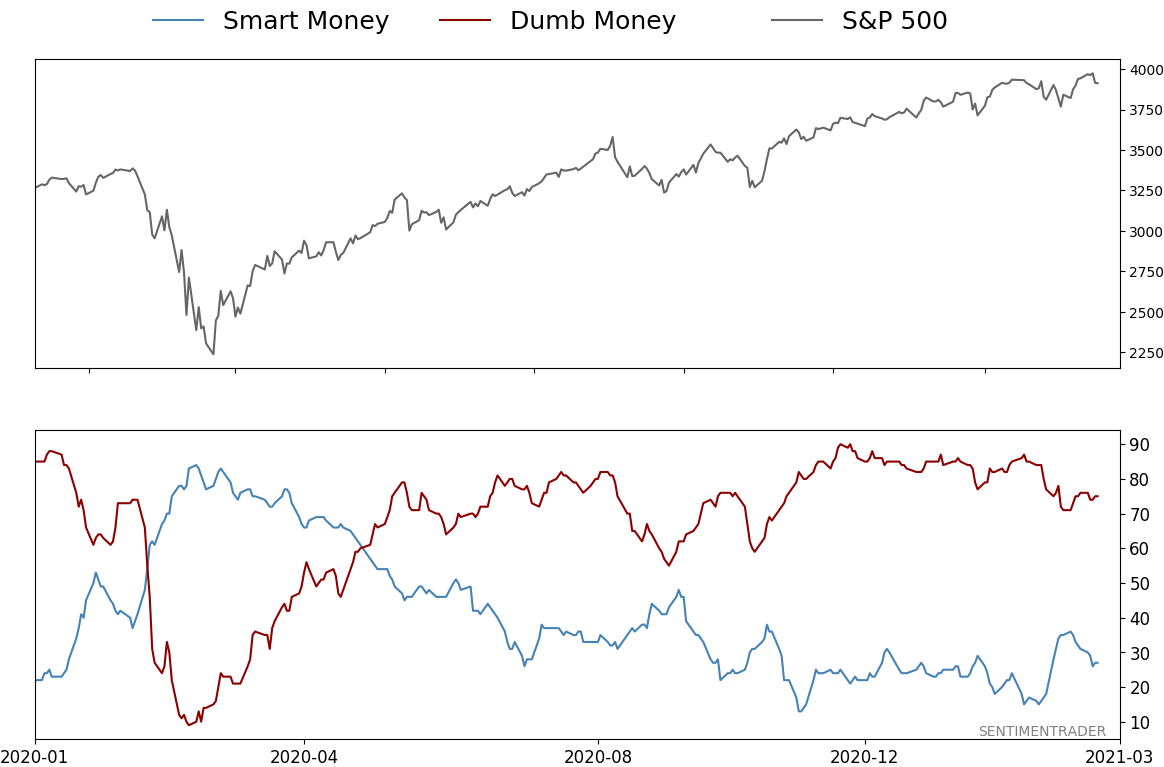
Smart / Dumb Money Confidence
|
Smart Money Confidence: 27%
Dumb Money Confidence: 75%
|
|
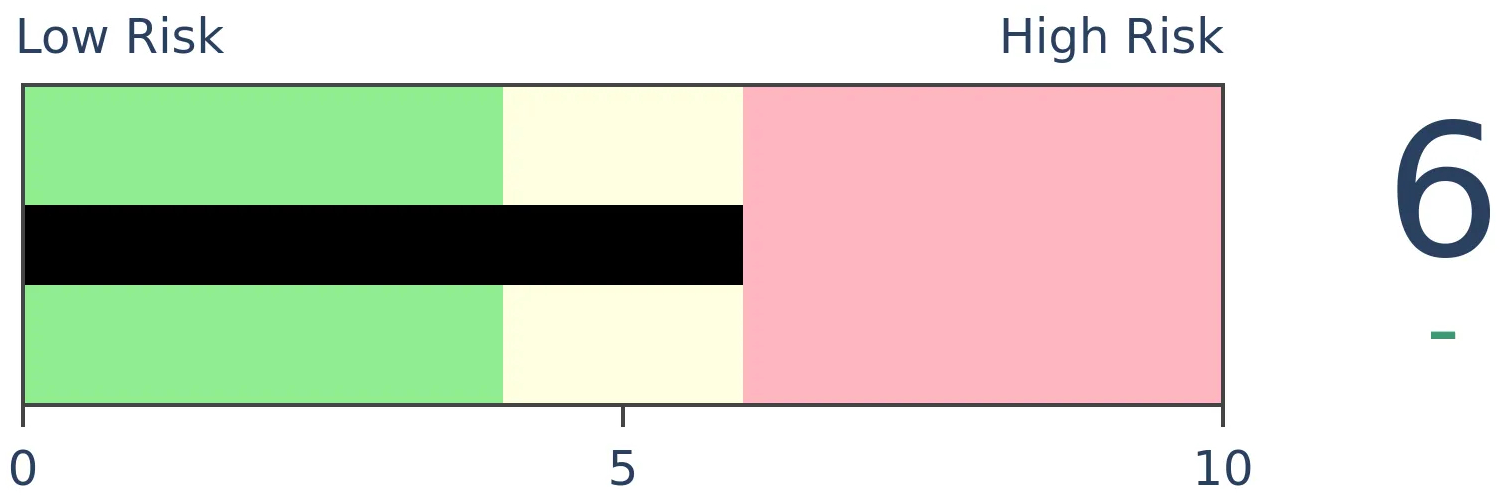
Risk Levels
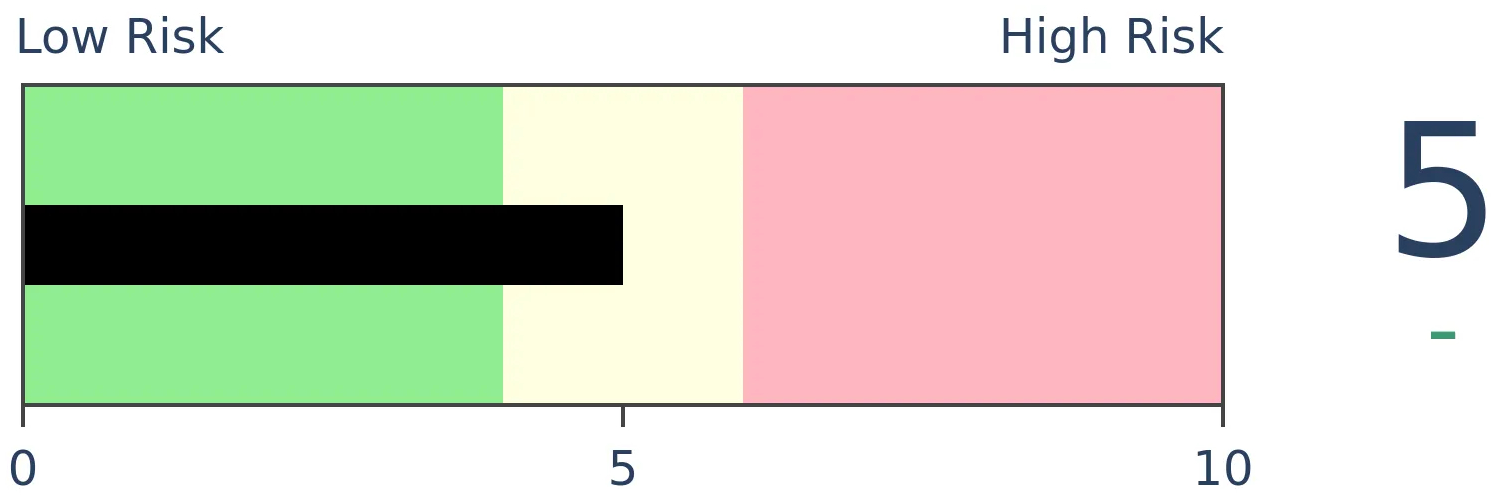
Stocks Short-Term
|
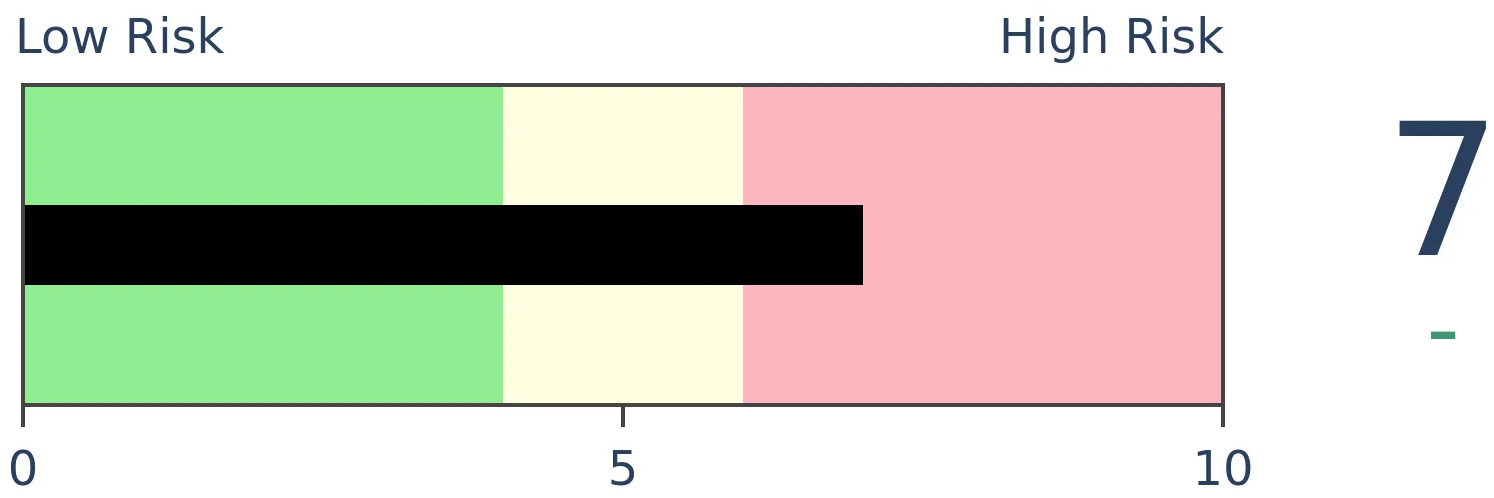
Stocks Medium-Term
|
|
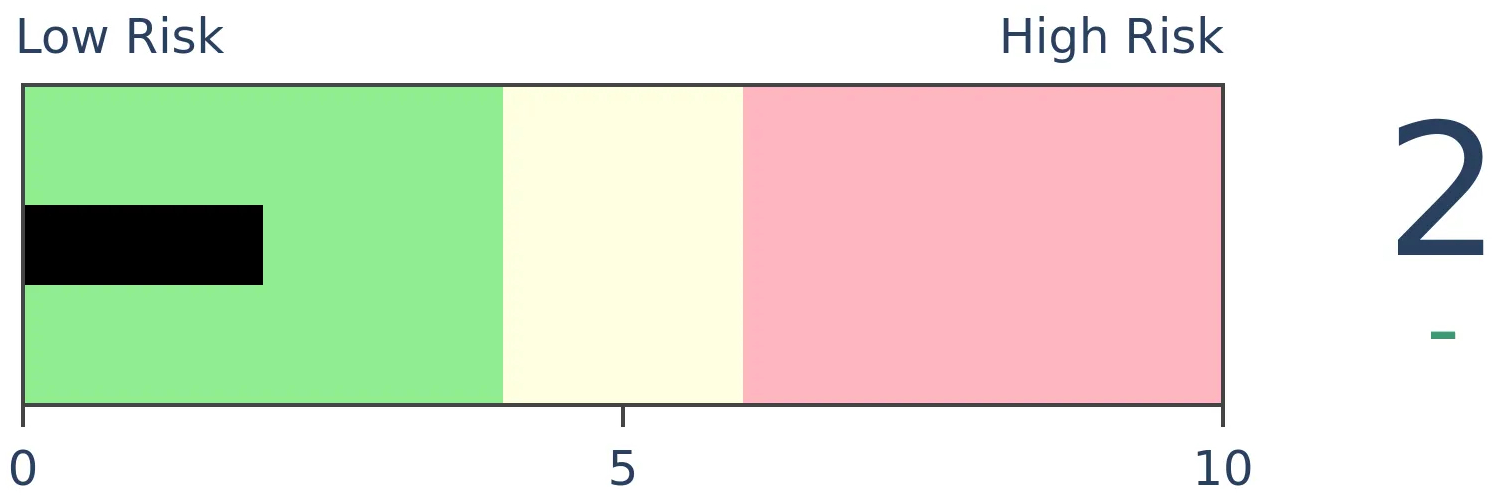
Bonds
|
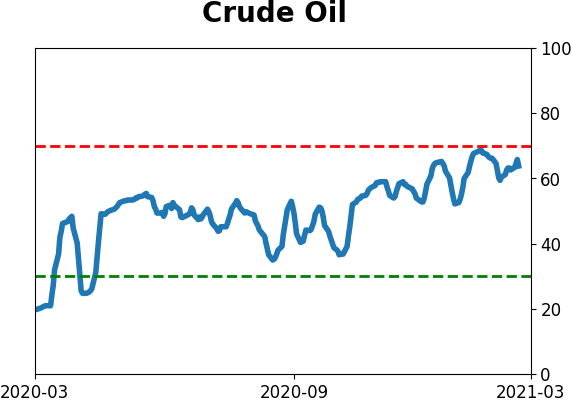
Crude Oil

|
|
Gold

|
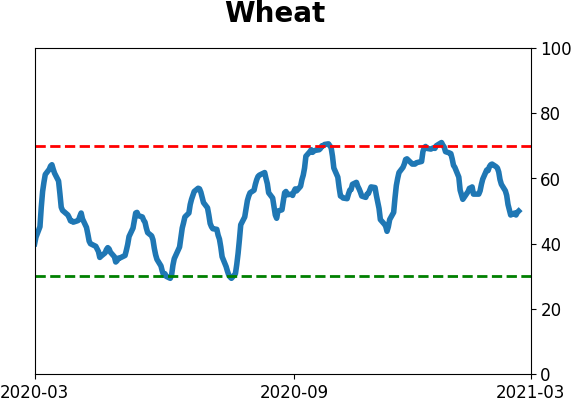
Agriculture
|
|
Research
BOTTOM LINE
This week, there were more signs that internals remain healthy, with the biggest worry simply that things have been so positive for so long, that forward returns tend to be muted at best. Bonds got hit hard, but signs are mixed about whether similar declines preceded higher prices.
FORECAST / TIMEFRAME
None
|
The goal of the Weekly Wrap is to summarize our recent research. Some of it includes premium content (underlined links), but we're highlighting the key focus of the research for all. Sometimes there is a lot to digest, with this summary meant to highlight the highest conviction ideas we discussed. Tags will show any related symbols and time frames related to the research.
Still in risk-on mode
The new Risk-On / Risk-Off Spotlight page shows that most of the core indicators are still in risk-on mode. As long as that's the case, investors tend to be in buy-the-dip mode.
Like many other positive developments we've looked at over the last month or two, the biggest caveat is simply that the environment has been so positive for so long. The 50-day average of the aggregate indicator has climbed above 90.5%, meaning that an average day over the past 50 sessions has seen more than 90% of the indicators displaying risk-on behavior.
If we only look at the first signal in 3 months, then all of them saw any further short-term gains peter out or turn to an outright negative in the months ahead.
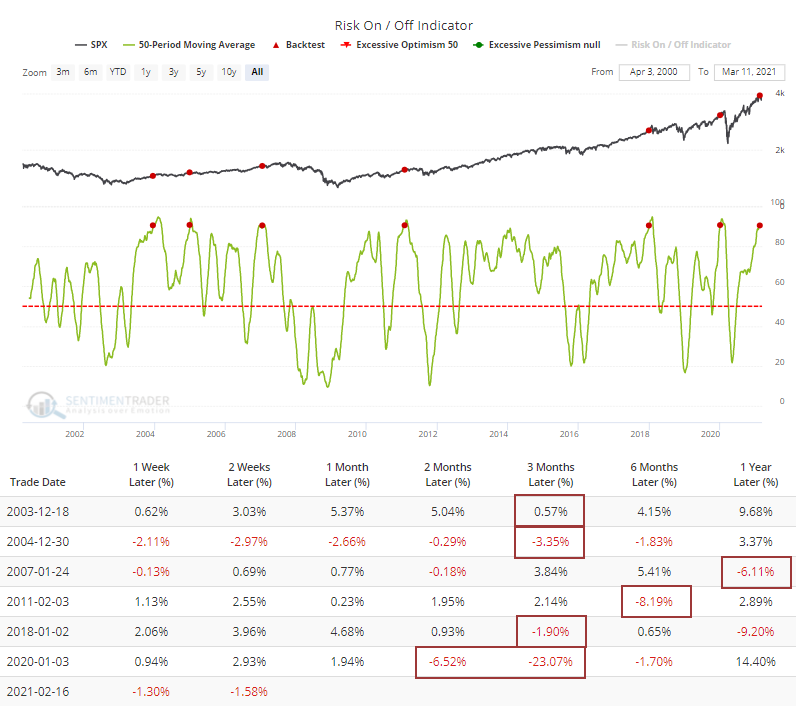
Higher-beta indexes like the Nasdaq Composite fared even worse. Using that index in the Backtest Engine, the median 3-month return was -3.9% with only a 24% probability of seeing a positive return.
Based on the historical relationship between stock prices and margin debt, and how stocks have done so far this month, we can reasonably expect debt to exceed $831 billion when March's numbers are reported in April, assuming that stocks don't completely crater in the next 2 weeks.
Using some conservative assumptions, the below chart shows what the year-over-year rate of change in margin debt should look like when the next round of numbers are reported.
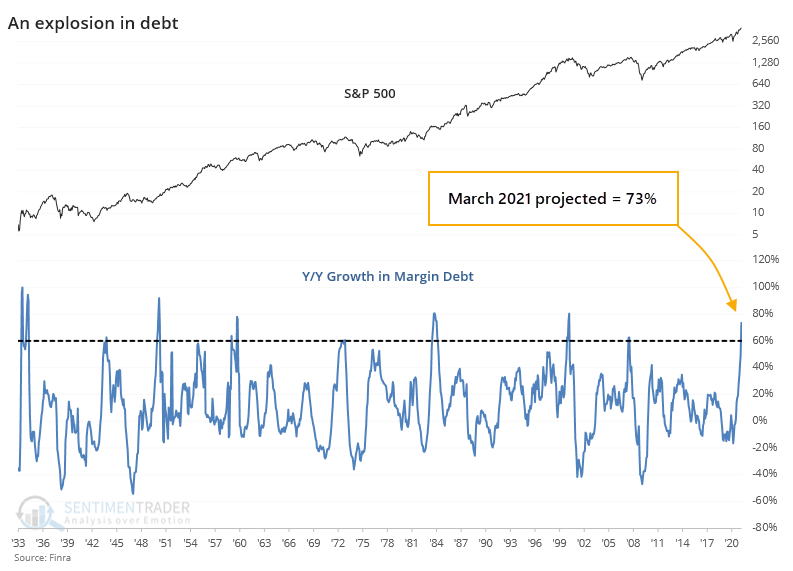
Particularly in recent decades, this kind of excessive and persistent growth in debt, on both an absolute and relative level, has been a boogeyman for forward returns. The last 9 instances, dating back to the 1950s, have all shown a negative return somewhere between the next 9-24 months.
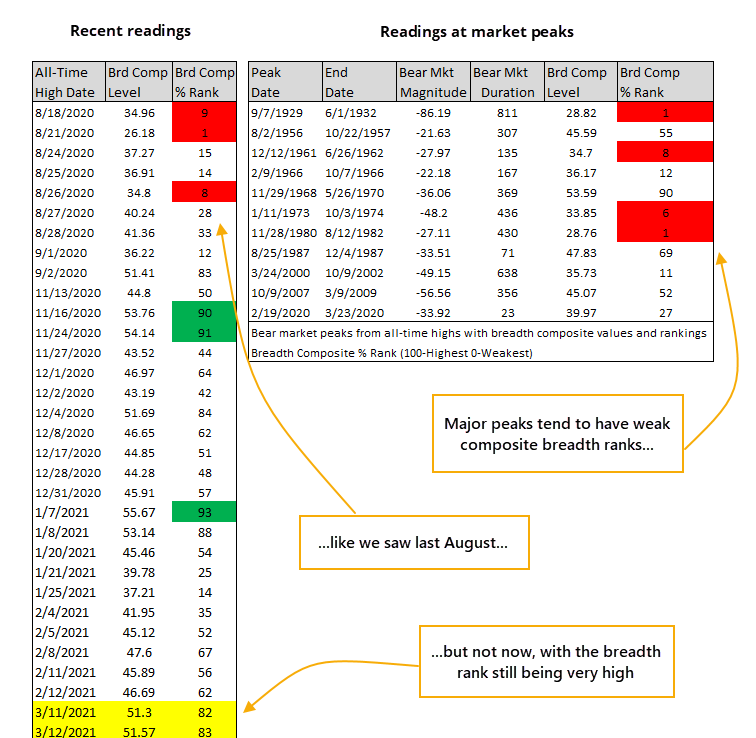
And breath is still good
Dean dove more in-depth into the good breadth environment, which hasn't faltered much.
To see if the troops are still participating, he reviewed a composite market breadth gauge, comparing it to all historical dates when the S&P 500 is registering new all-time highs, which it did earlier in the week.
Rankings in this composite gauge range from 100 (strongest) to 0 (weakest). By ranking each all-time high in the S&P, we can make an apples-to-apple comparison of their internal health throughout history.
The breadth composite rankings for the new all-time highs last week look solid, with readings in the 82nd and 83rd percentile. As the table below shows, breadth rankings typically register lower readings at major market peaks.
Market breadth remains firm even with the substantial internal rotation between growth and value. Historically, small-cap stocks will be among the first groups to exhibit internal weakness ahead of broad market corrections and bear markets as they are more economically sensitive. Given the strength in small-caps and several other indexes, a clustering of divergence signals appears unlikely in the near-term.
Watching yields and inflation
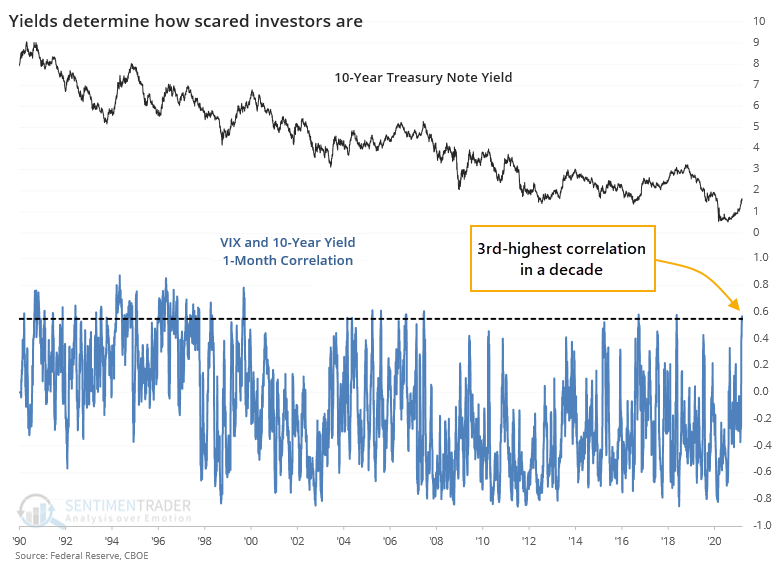
What's been scaring investors over the past month? Rising yields.
Over the past month, yields have been influencing the VIX at one of the highest levels in a decade. The chart below shows a rolling 1-month correlation between daily changes in the VIX and 10-year Treasury yields. The higher the blue line, the more that yields seem to be influencing stock investors' volatility expectations.
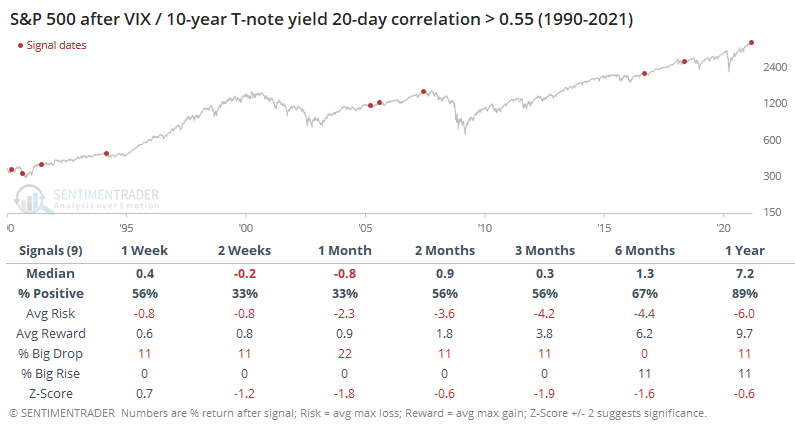
When rising yields have been such an influence on volatility expectations, it's been a modest shorter-term negative for stocks. The table below
Jay highlighted another model using inflation as a risk on or off signal for stocks, adding to a discussion from last week (see here, here, and here).
When comparing core inflation to the CPI and allowing for reporting delays, there has been a marked difference in forward returns in the S&P 500 depending on whether core inflation is higher or lower. When the growth in core inflation is higher, we assume that consumers (and investors) are in risk-on mode.
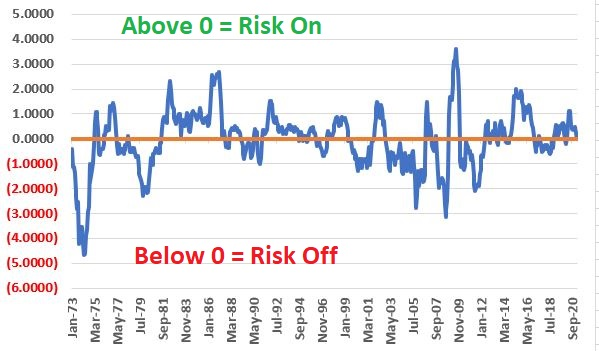
Based on current inputs, this will be in risk-off mode in April. The chart below displays the cumulative growth from holding the S&P 500 Index ONLY during Risk Off Months. The cumulative return of 209% compares to a return of 4,151% during Risk On months.
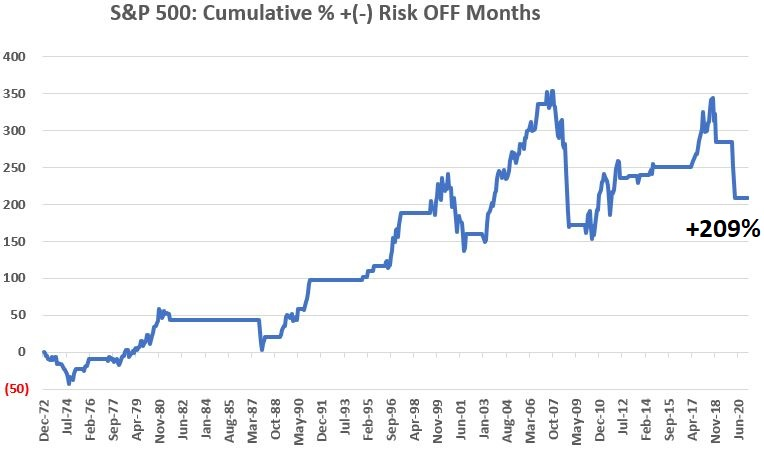
When we consider that his particular model does not take into account market price action nor any fundamental information beyond simply the state of inflation, the best use of this particular model is probably as a "weight of the evidence" type of indicator, rather than as a standalone investment model.
Stocks and sectors
Jay discussed a way to structure an options trade to take advantage of one's outlook on Alibaba (BABA) stock, the Diagonal Calendar Spread. It gives investors options if they think a stock (or ETF or index) will work higher but may be limited by overhead resistance.
If you never have any intention of ever trading options then it is "class dismissed" because this won't be applicable.
He highlighted an example using call options, but the strategy can be used with put options as well. The strategy using calls involves:
- Buying a longer-term call option at a given strike price AND
- Selling a shorter-term call option at a higher strike price
Rather than try to spell out every possible permutation and outcome, he focused on one example. As always, it needs to be pointed out that the example trade I will discuss is just that - an example - and NOT a specific trade recommendation.
The figure below shows risk curves for both trades as of 3 different dates leading up to July option expiration.
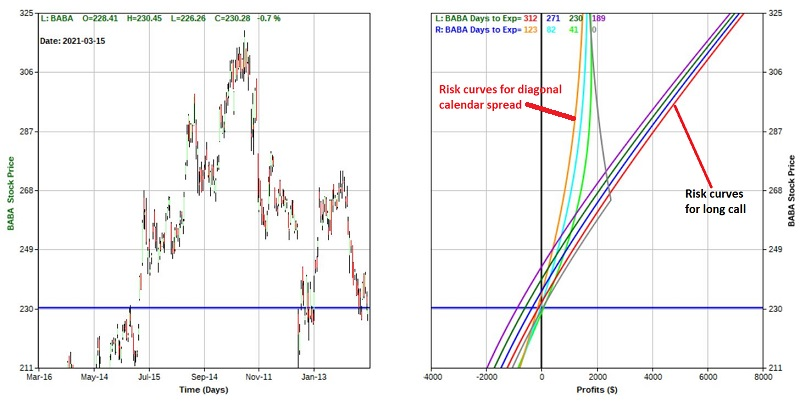
Here is what we find:
- At any price up to roughly $274 a share, the calendar diagonal spread shows a higher dollar profit even though it costs $920 less to enter (by virtue of having sold the July 265 call)
- At any price above $274 a share, the long call will show a higher profit
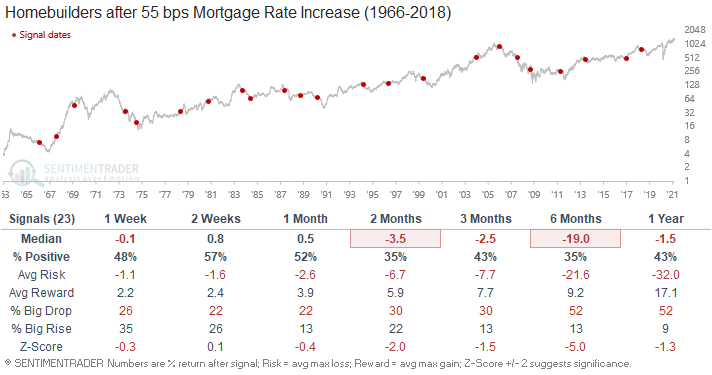
Dean looked at the recent change in mortgage rates and updated a prior signal on homebuilding stocks.
He created a standalone interest rate signal to assess the impact of rising rates on homebuilding stock performance. The optimization showed that when the 30-year fixed-rate mortgage rate rose by 55 bps over a 32-week period, stocks underperformed.
As the table below shows, a 55 bps increase in mortgage rates impacts homebuilders across all time frames.
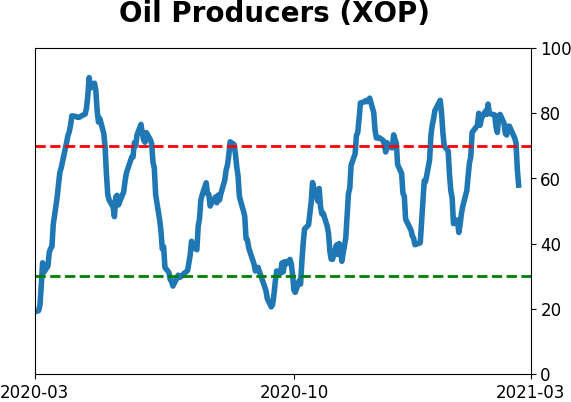
Dean showed that energy stocks got hit hard with the big drop in crude oil during the week. Since they've shown such impressive longer-term momentum, more than 95% of them are still holding above their 200-day moving averages. But the short-term selling knocked all of them below their 10-day averages.
Similar bouts of heavy short-term selling in long-term uptrends had a strong tendency to lead to higher prices for the sector.
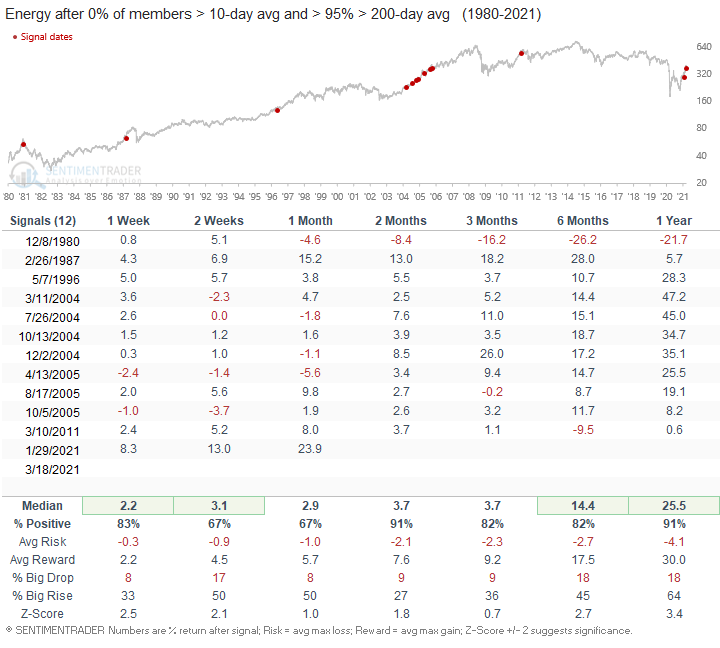
There were a couple of other signals using energy stock breadth which confirmed the generally bullish longer-term bias given recent momentum.
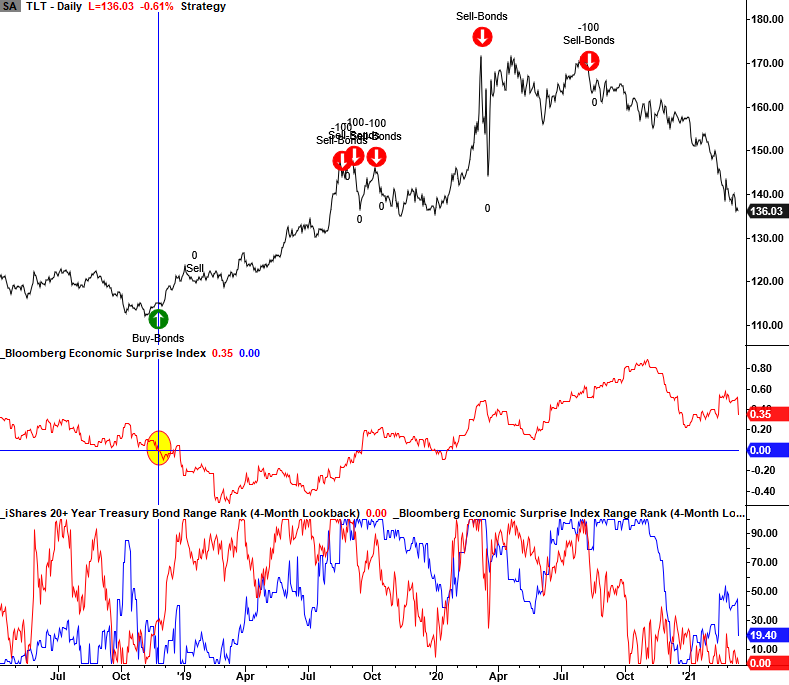
Dean showed that bonds could be nearing a buy if economists start to ratchet down their expectations some more.
The 1-day change in the Bloomberg Economic US Surprise Index dropped sharply earlier in the week as the actual vs. survey missed expectations for several components.
An economic surprise index model for bonds seeks to enter a long position when the 4-month Bloomberg surprise index and bond price range rank close in the 20th percentile or less. i.e., bond prices are falling in the face of economic disappointment relative to expectations.
As the chart below shows, the surprise index is well above zero, and prices continue to fall. Therefore, we shouldn't expect a signal from this particular model in the near-term.
Continuous 30-year Treasury bond futures have now dropped more than 8% below the 100-day average, one of the most oversold readings since the contract's inception.
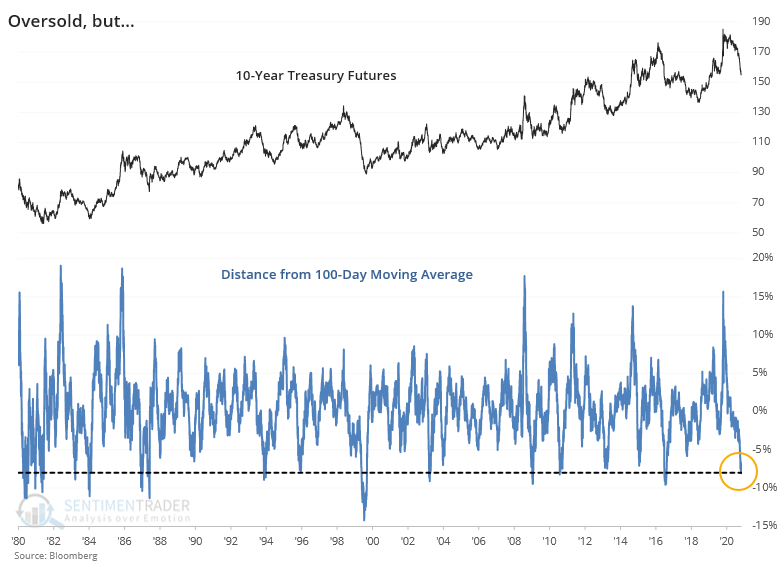
"Oversold" doesn't always mean "buy" and this seemed to be the case here. This is somewhat surprising given the long-term bull market in bonds. Usually, oversold in an uptrend gives more consistently positive forward returns.
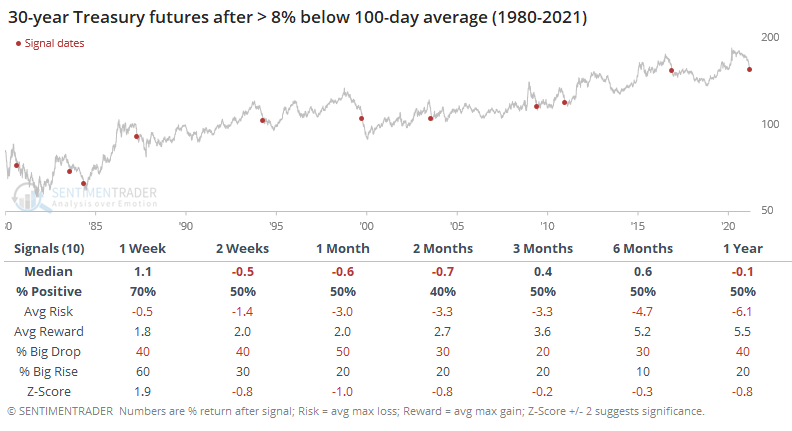
There are some compelling signs that bond sellers have gone too far, too fast, and pessimism is building rapidly, but we're just not seeing an overwhelming and consistent tendency in the studies that point to higher prices.
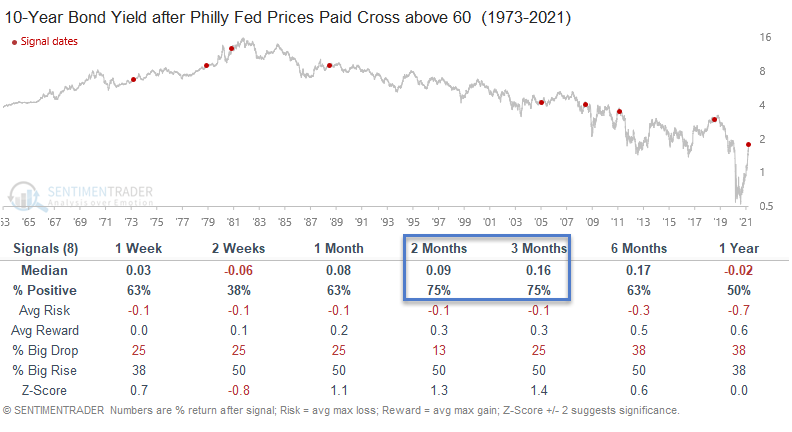
Also, Dean noted that the Federal Reserve Bank of Philadelphia released its manufacturing business outlook survey for March today. The prices paid index increased from 54.4 to 75.9, the highest reading since March 1980.
The table below shows the net change in bond yields after similar jumps. The consistent rise in yields means that bond prices typically fell over the next 2-3 months.
Jay outlined a consistent seasonal bias in gold futures.
Gold has been a major disappointment to many of late. Yet given its historical seasonal tendencies, perhaps the recent weakness should not come as a complete surprise.
He focused on two trading periods, one unfavorable and one favorable. For 2021:
- the Unfavorable period extends from the close on 2/25/2021 through the close on 4/1/2021
- the Favorable period extends from the close on 4/6/2021 through the close on 4/14/2021
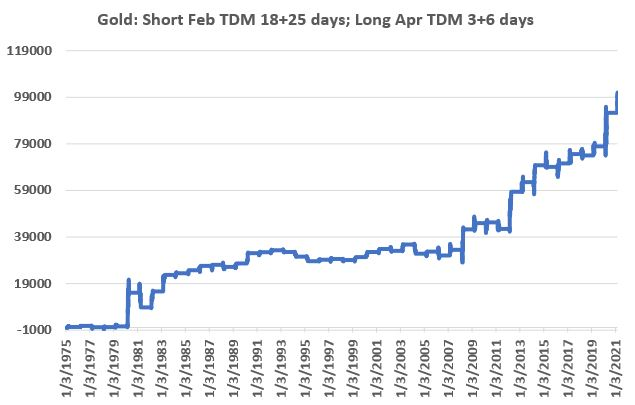
There are no "sure things" here. Still, the long-term tendencies are clear. Gold tends to show weakness during the first period, then "boomerangs" and tends to show strength during the second period. To further illustrate this, let's test the following hypothetical strategy:
- Short 1 Gold futures for 25 trading days following the close on Feb TDM 18 (that's the 18th Trading Day of the Month)
- Long 1 Gold futures for 6 trading days following the close on Apr TDM 3
The chart below displays the hypothetical cumulative dollar gain or loss achieved by holding a short 1-lot of gold futures during the first period and a long 1-lot position of gold futures during the second period every year since 1975.
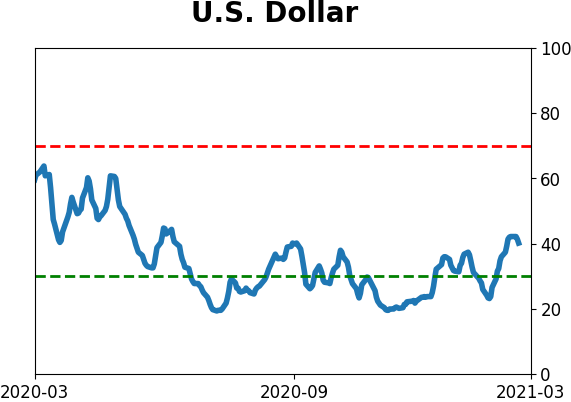
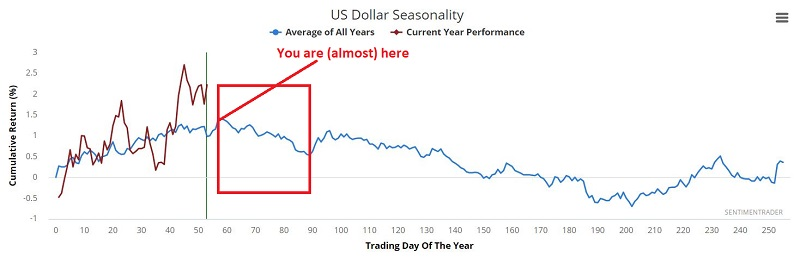
Jay also noted that the dollar is about to enter a seasonally weak window.
The chart below displays the annual seasonal trend for the dollar. Note the period of weakness from the close on Trading Day #57 through the close on Trading Day #89. This seasonally unfavorable period this year extends from the close on March 23rd through the close on May 7th.
Active Studies
| Time Frame | Bullish | Bearish | | Short-Term | 0 | 0 | | Medium-Term | 2 | 10 | | Long-Term | 16 | 4 |
|
Indicators at Extremes
Portfolio
| Position | Description | Weight % | Added / Reduced | Date | | Stocks | RSP | 4.9 | Reduced 4% | 2021-02-09 | | Bonds | 30.0% BND, 8.8% SCHP | 38.8 | Added 15.1% | 2021-02-18 | | Commodities | GCC | 2.3 | Reduced 2.1%
| 2020-09-04 | | Precious Metals | GDX | 9.0 | Added 0.1% | 2021-02-18 | | Special Situations | 7.3% XLE, 4.8% PSCE | 12.1 | Reduced 5.6% | 2021-02-18 | | Cash | | 32.8 | | |
|
Updates (Changes made today are underlined)
With a market that has seen the kinds of broad participation and big breath thrusts like we did in the fall, it's hard to become too negative. Those kinds of conditions have consistently preceded higher returns over the next 6-12 months. It's the interim that's more of an issue. Even conditions like that haven't prevented some shorter-term pullbacks. And when we combine an environment where speculation is rampant and recent days have seen an increase in cracks under the surface of the indexes, it's enough to become more defensive over a short- to medium-term time frame. We still don't have much confirmation from the price action in the indexes, so those who are more conservative would likely wait before increasing cash levels. I've decreased risk exposure a bit more, mainly in terms of energy stocks and the ANGL fund, while adding more to the broader bond market. RETURN YTD: 6.1% 2020: 8.1%, 2019: 12.6%, 2018: 0.6%, 2017: 3.8%, 2016: 17.1%, 2015: 9.2%, 2014: 14.5%, 2013: 2.2%, 2012: 10.8%, 2011: 16.5%, 2010: 15.3%, 2009: 23.9%, 2008: 16.2%, 2007: 7.8%
|
|
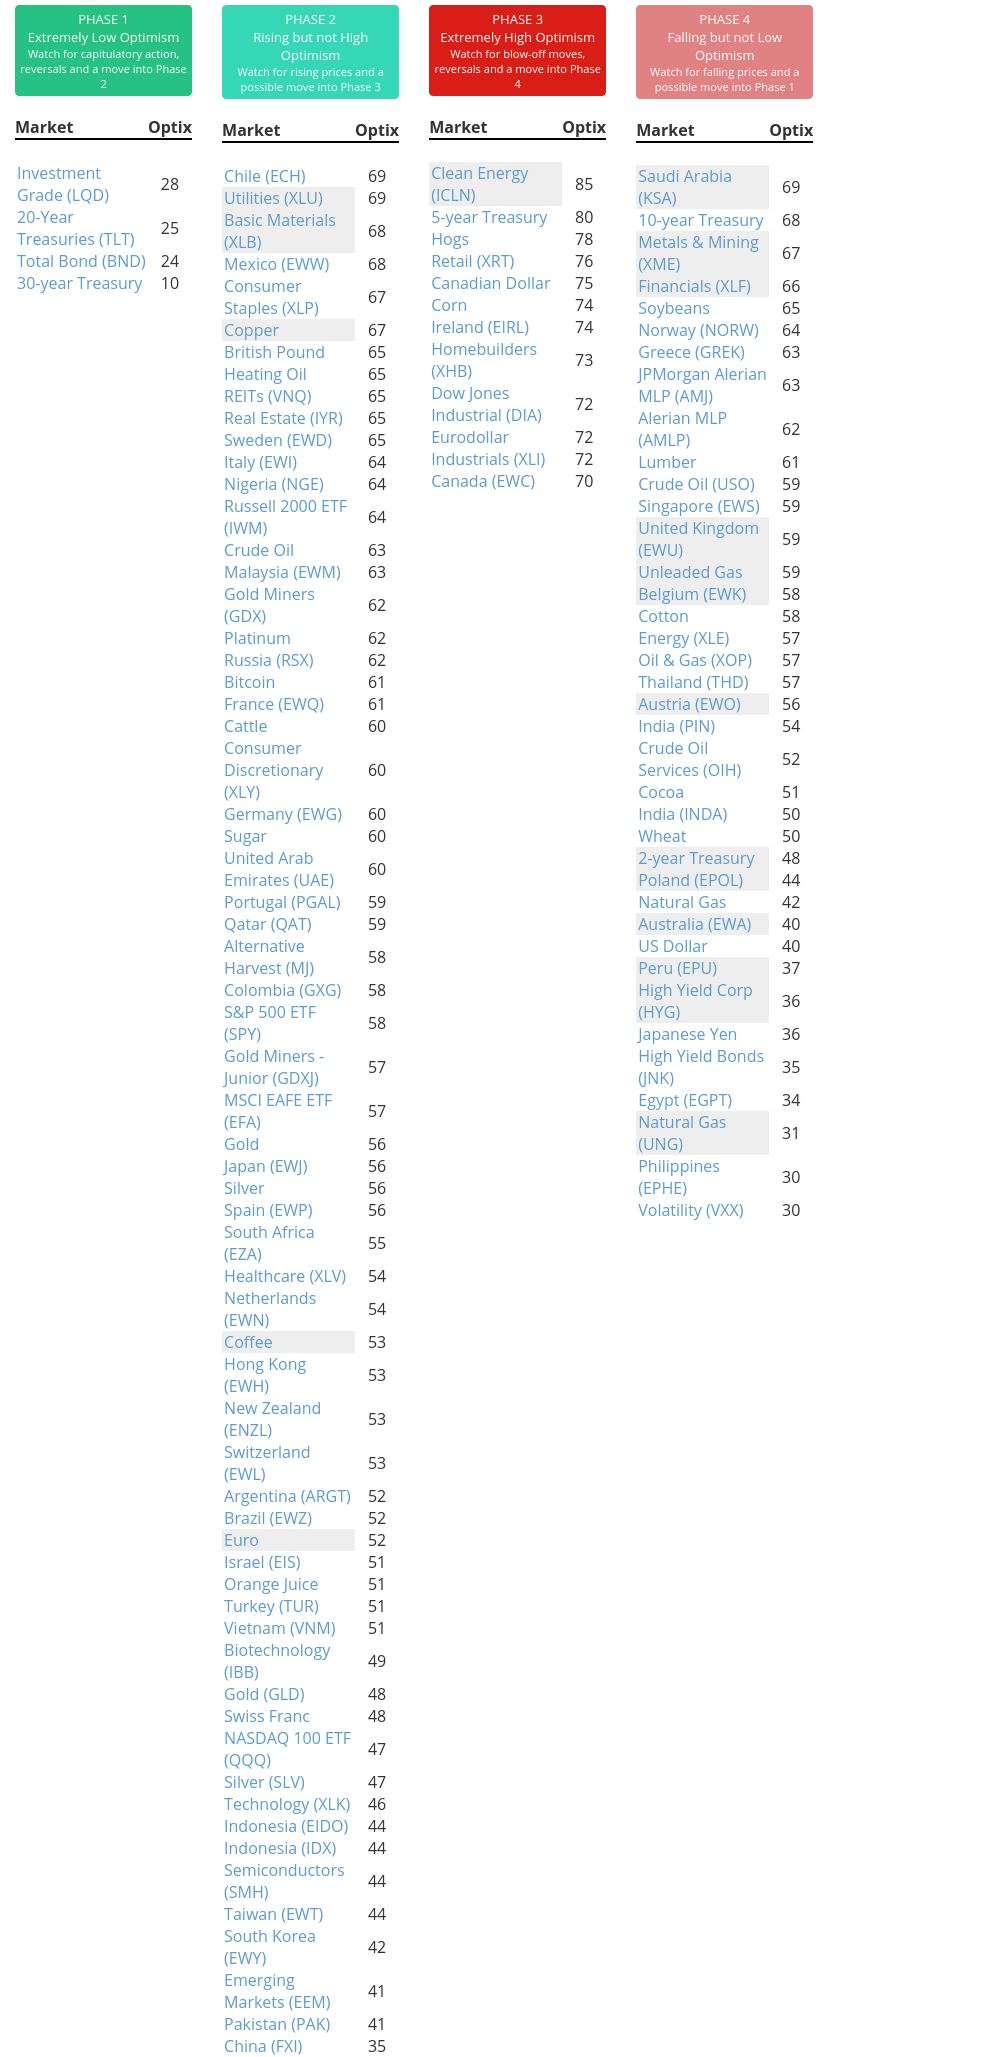
Phase Table
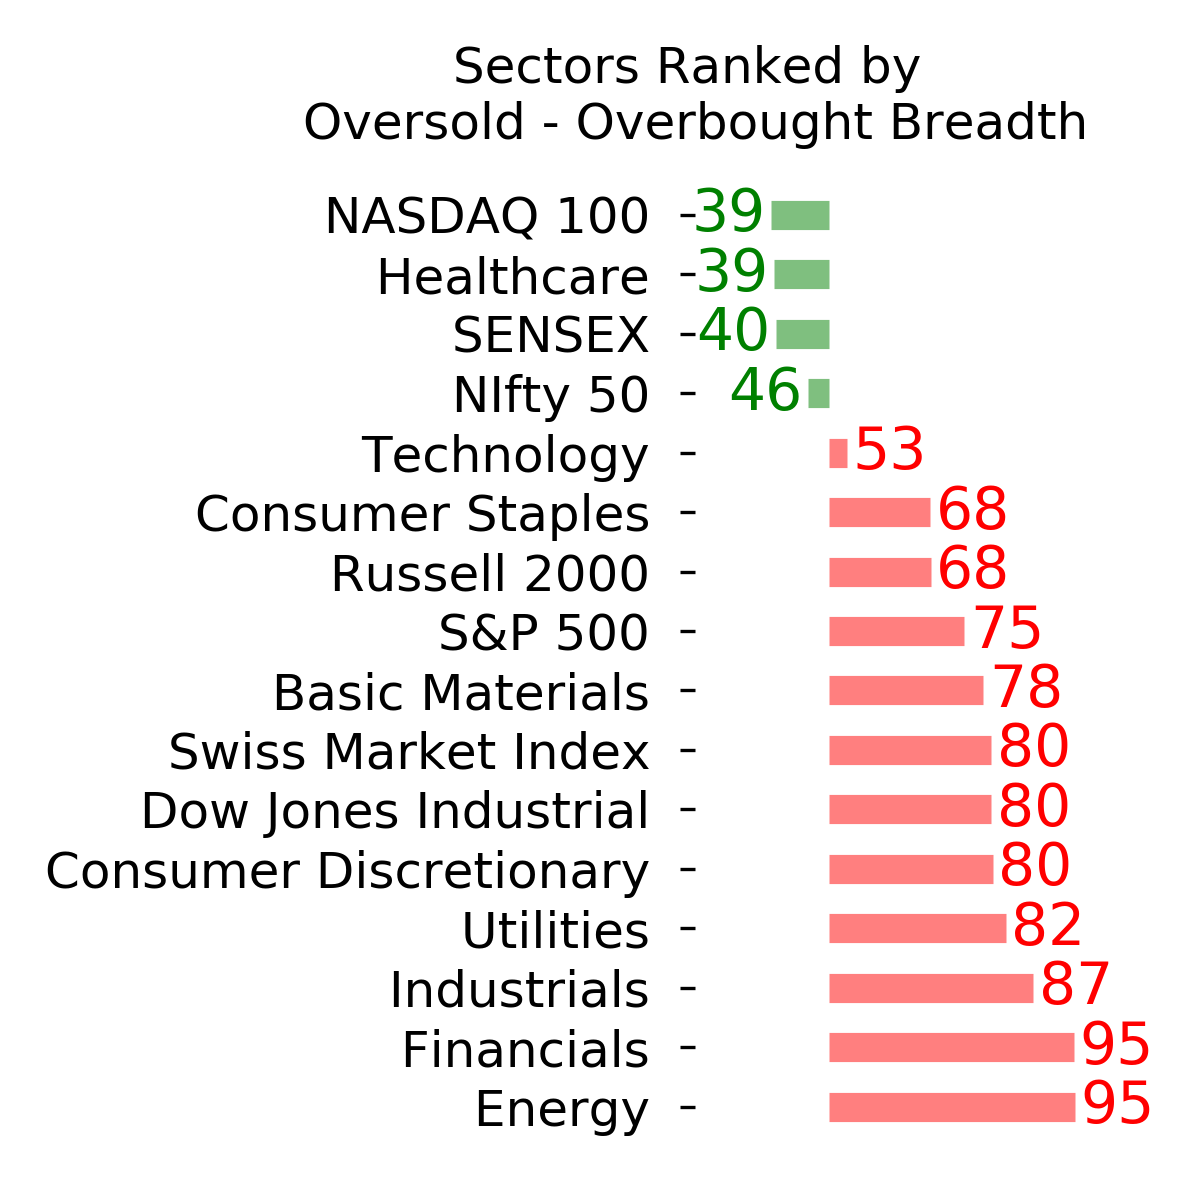
Ranks
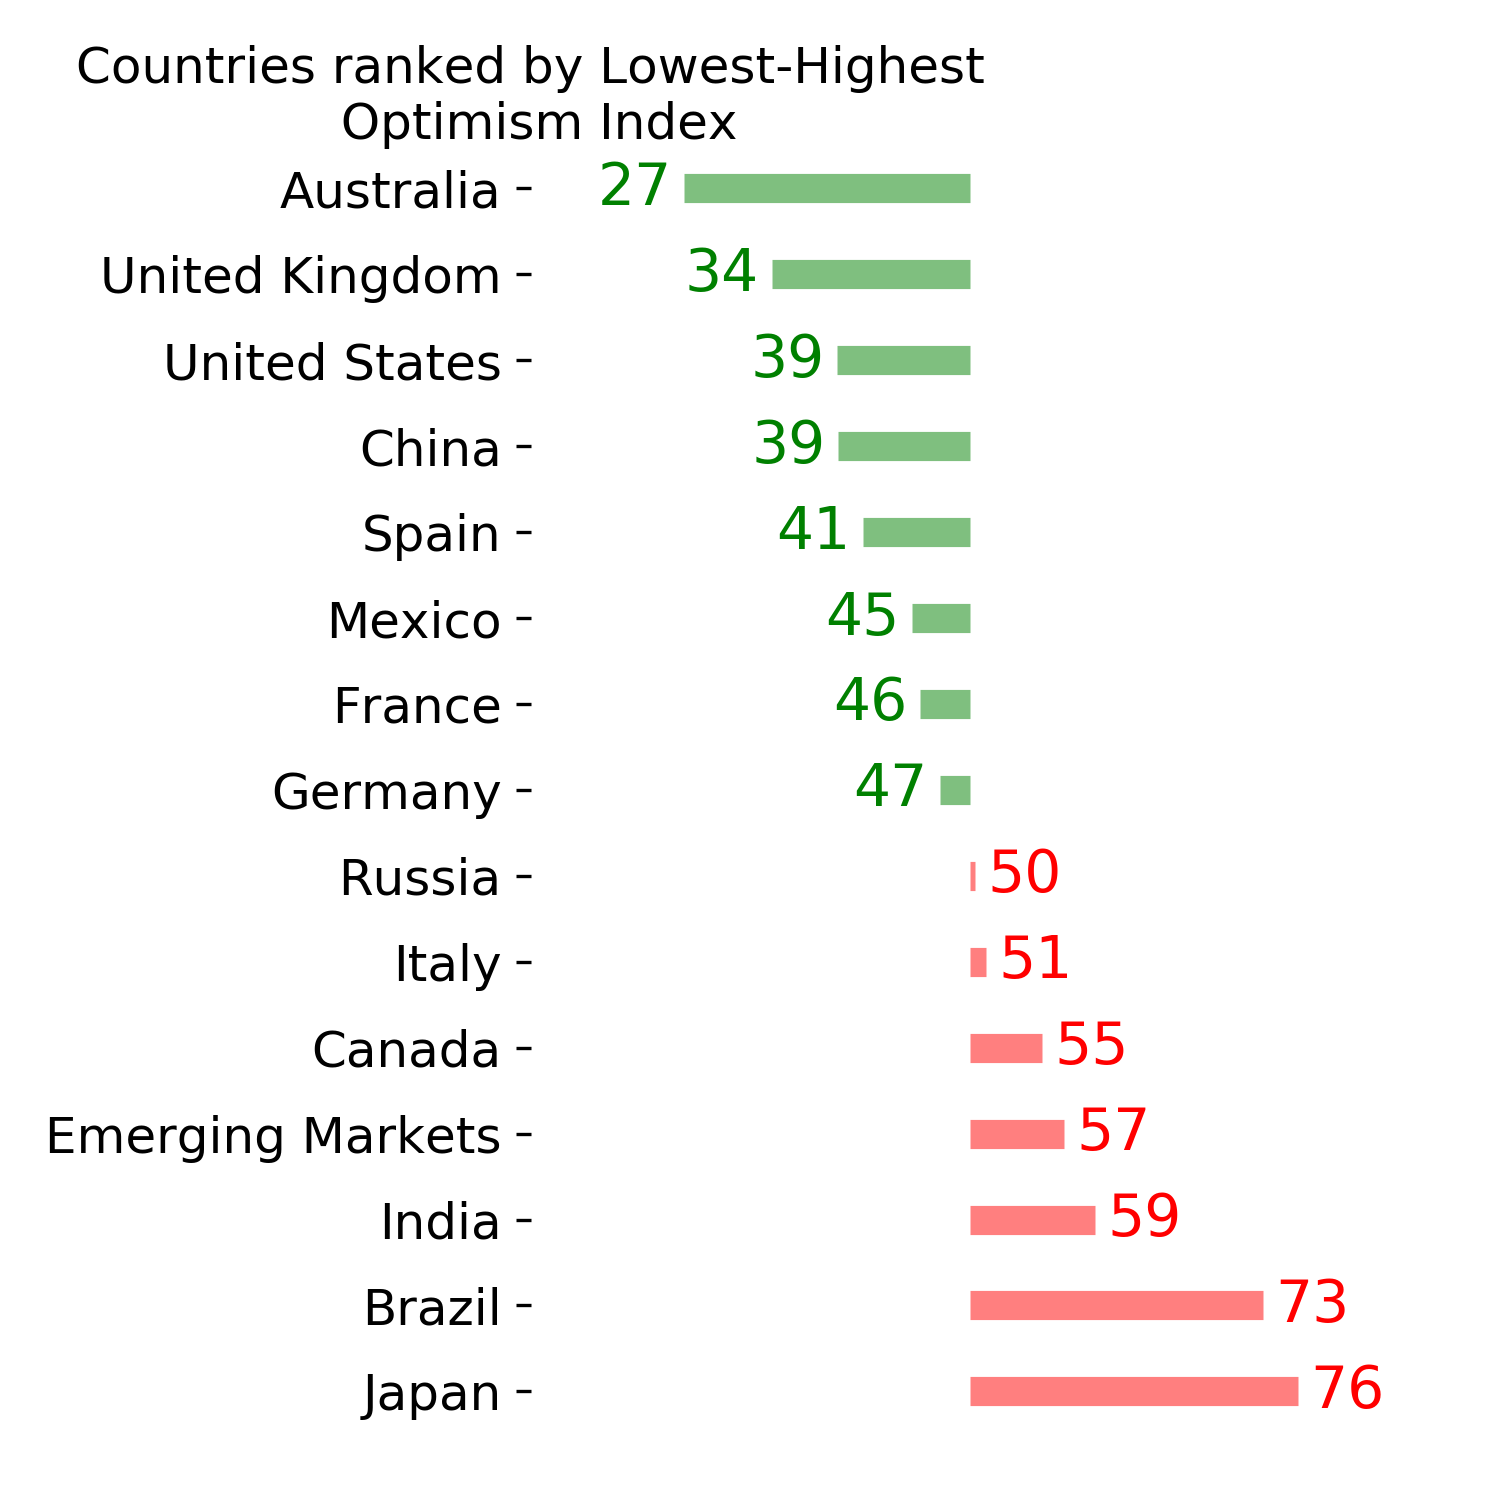
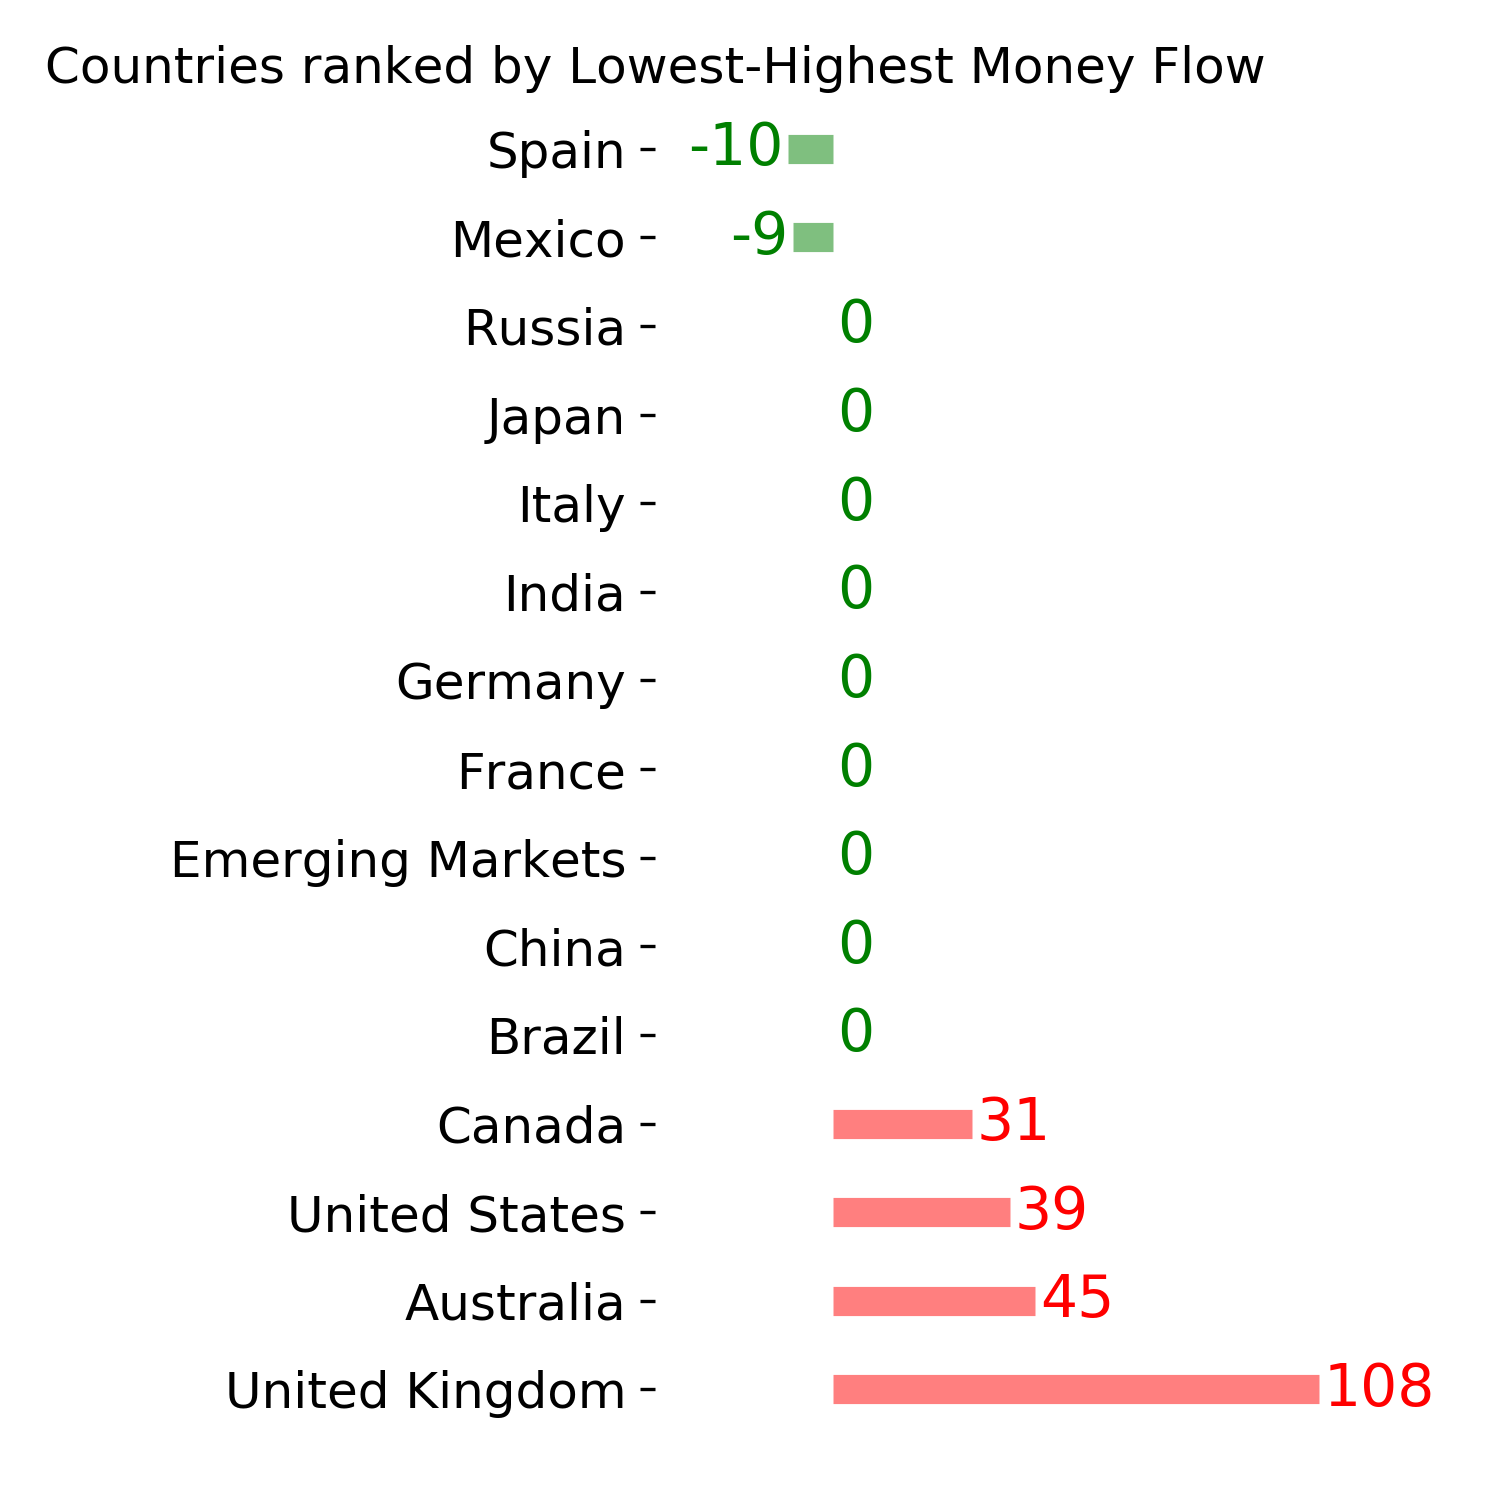
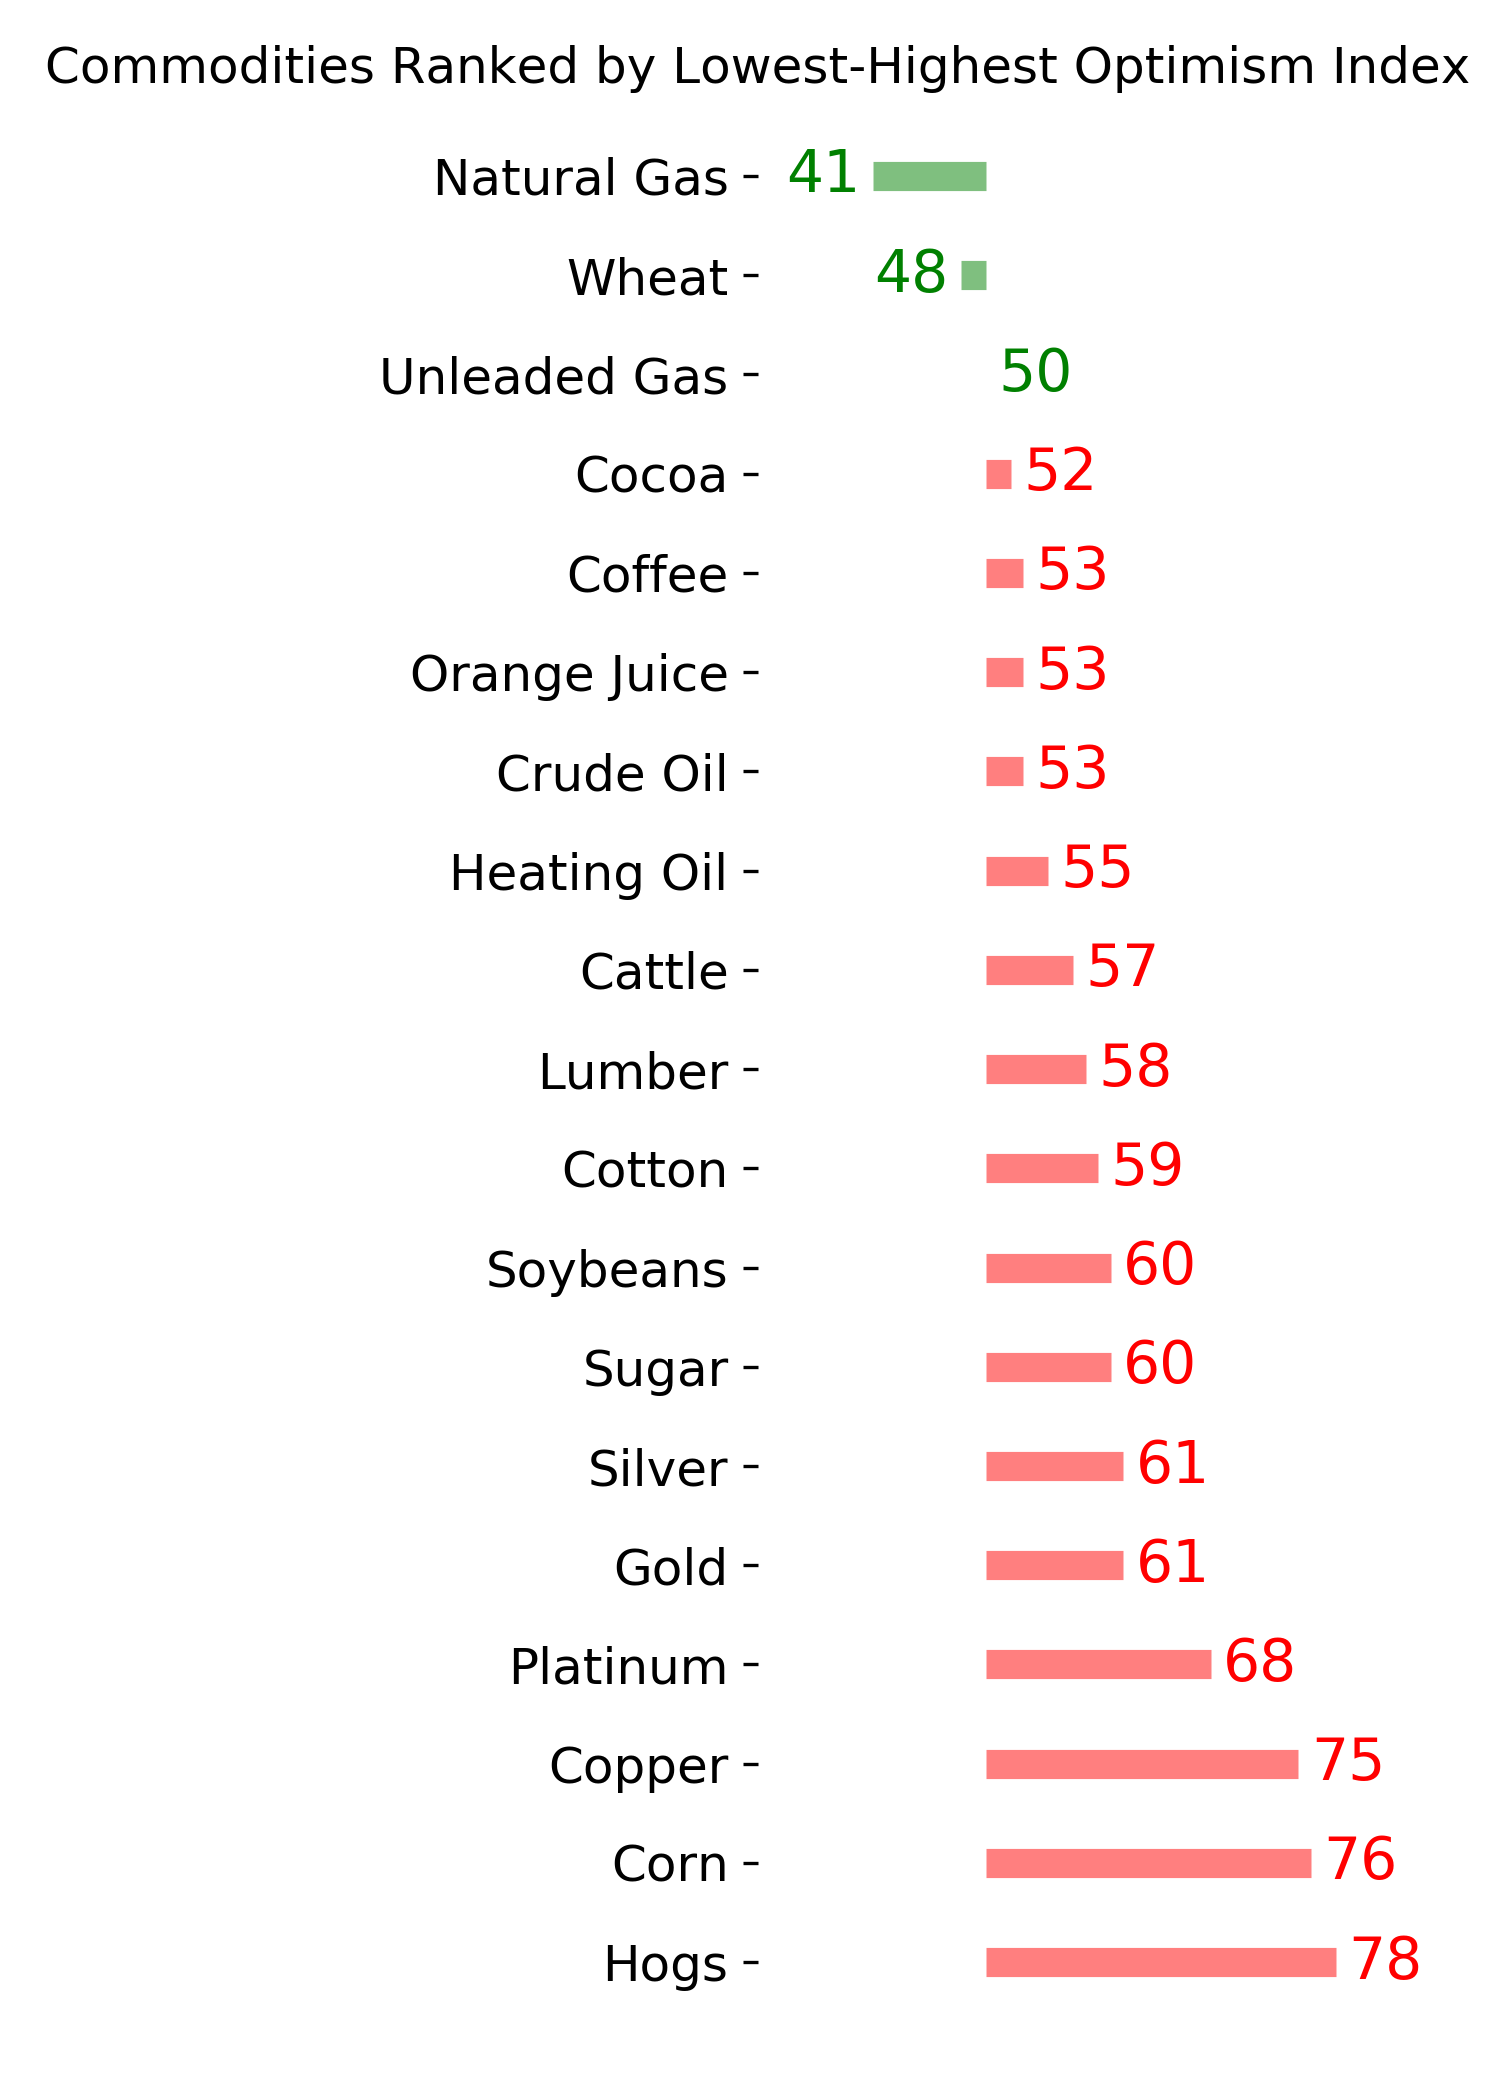
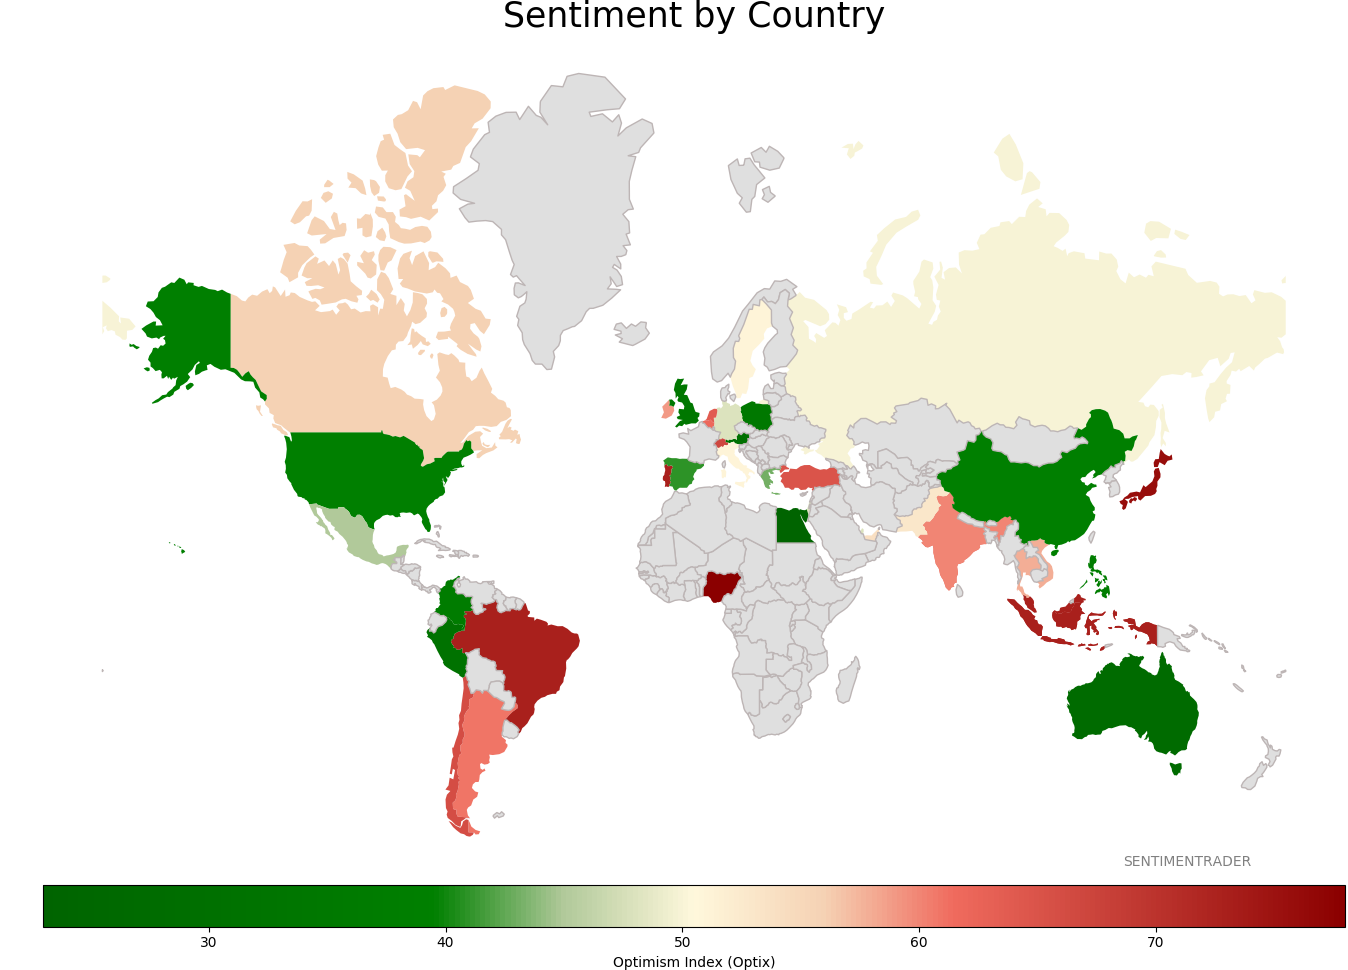
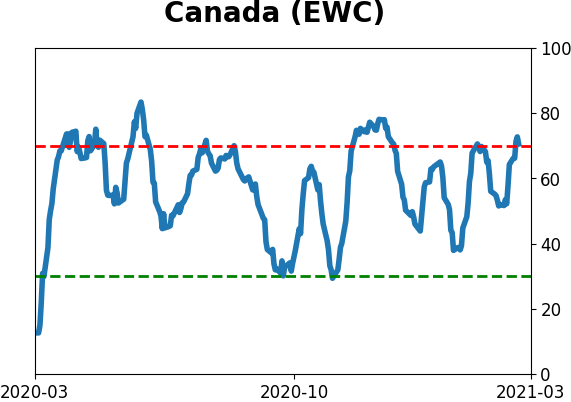
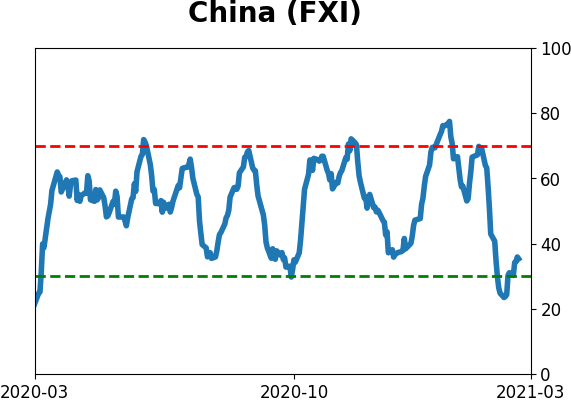
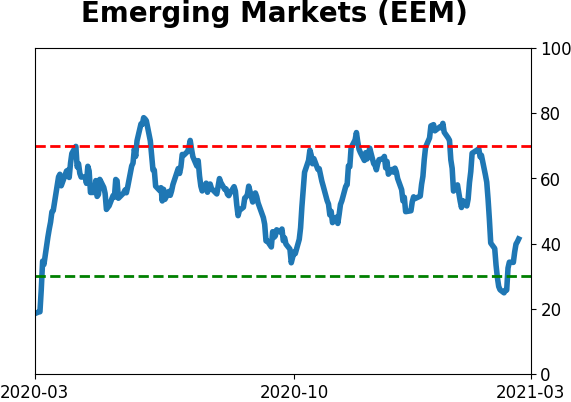
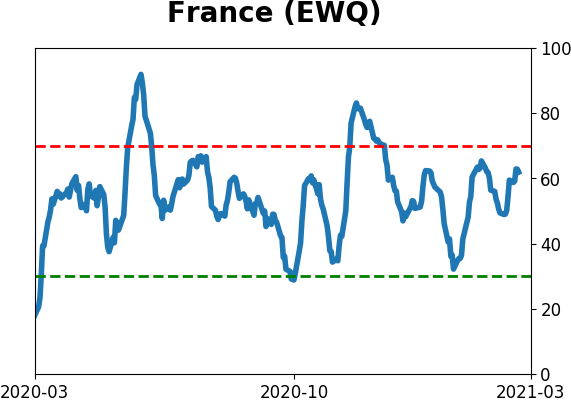
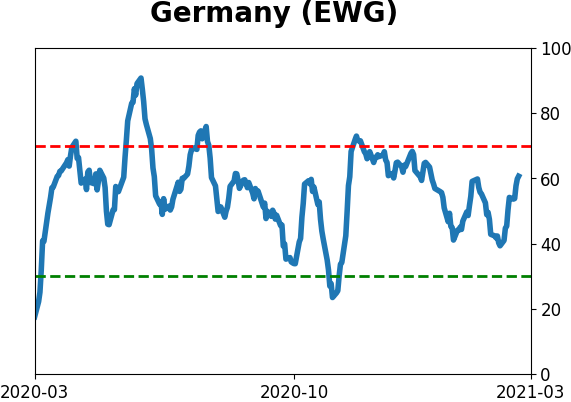
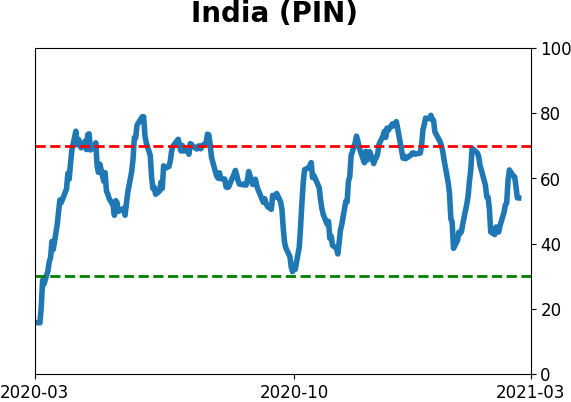
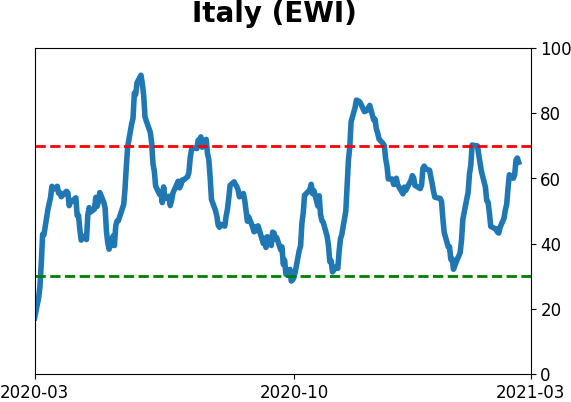
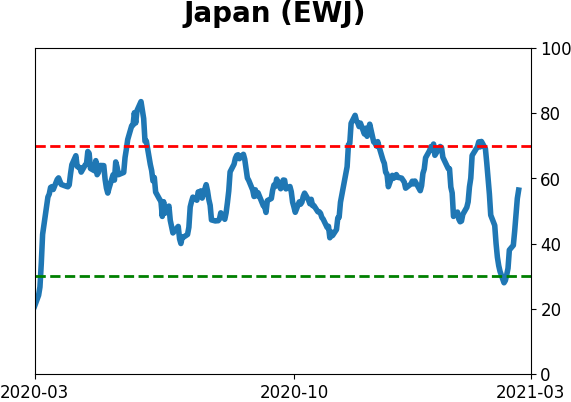
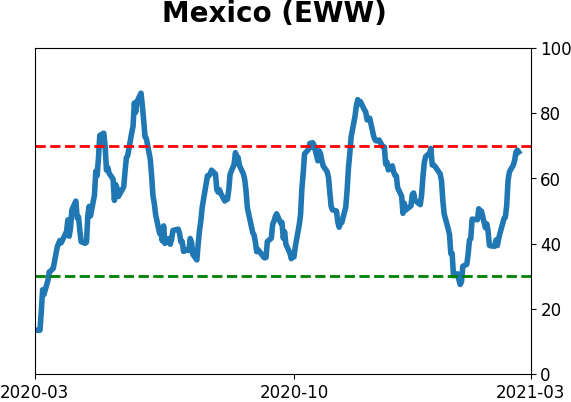
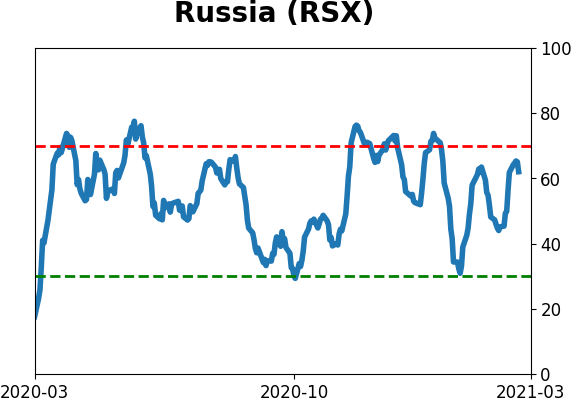
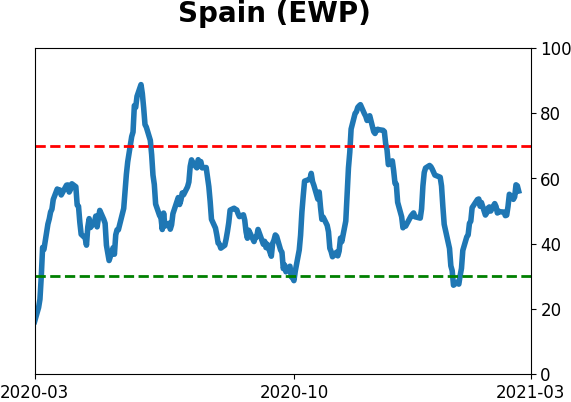
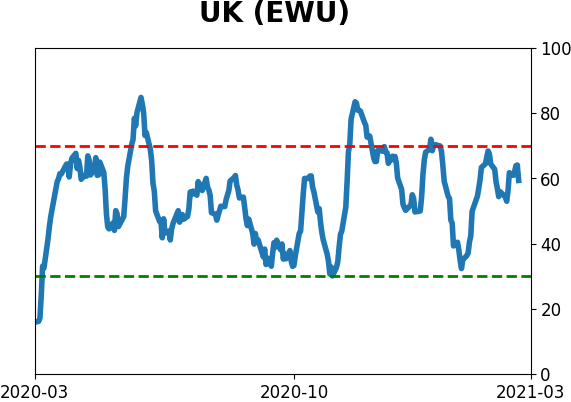
Sentiment Around The World
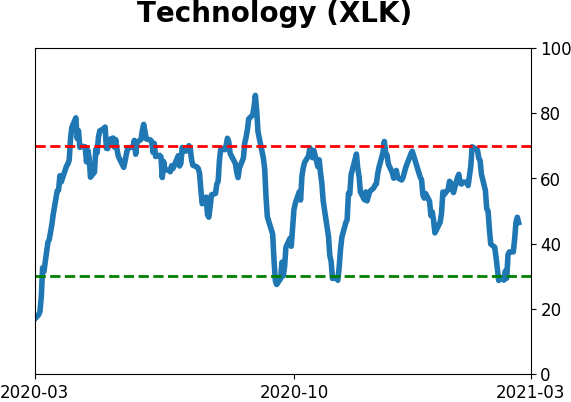
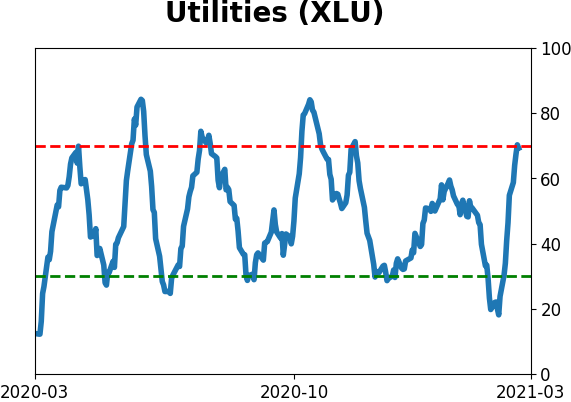
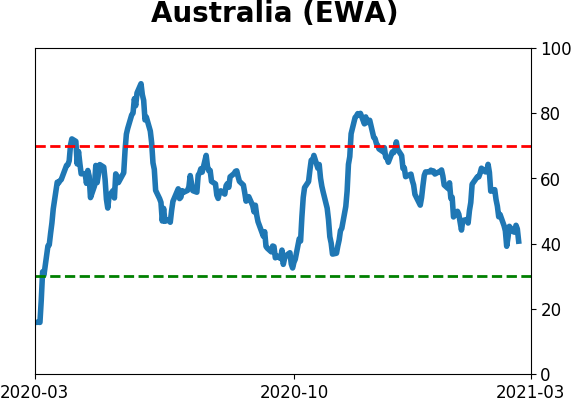
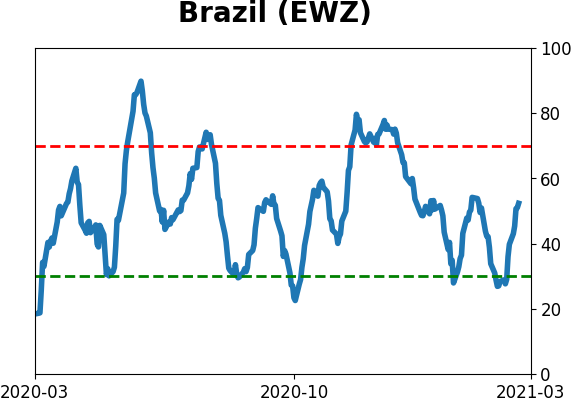
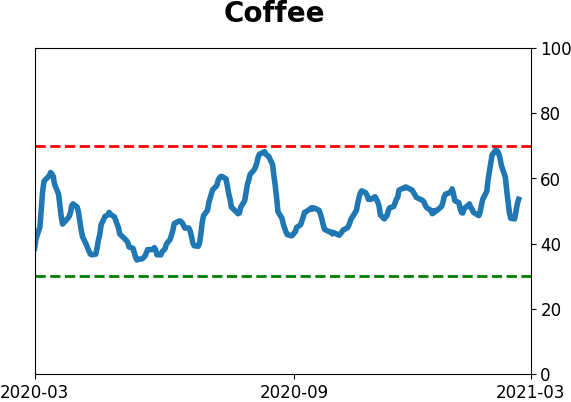
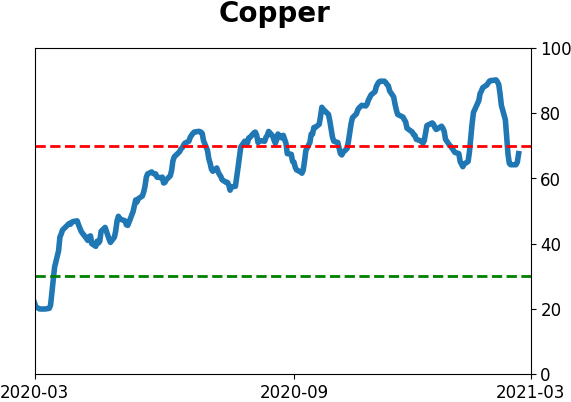
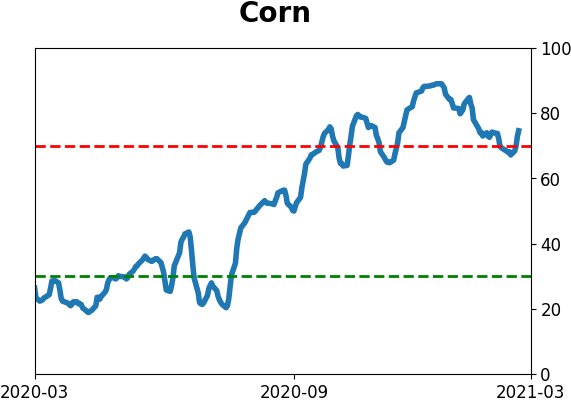
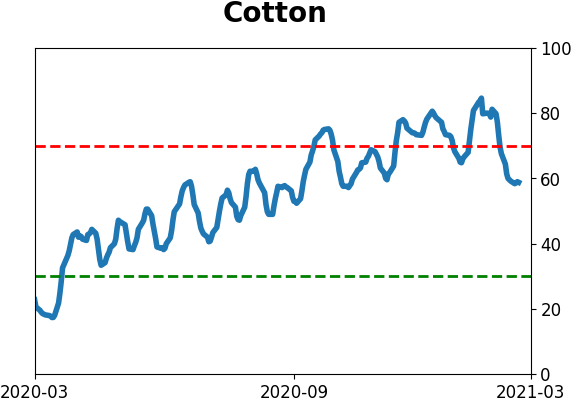
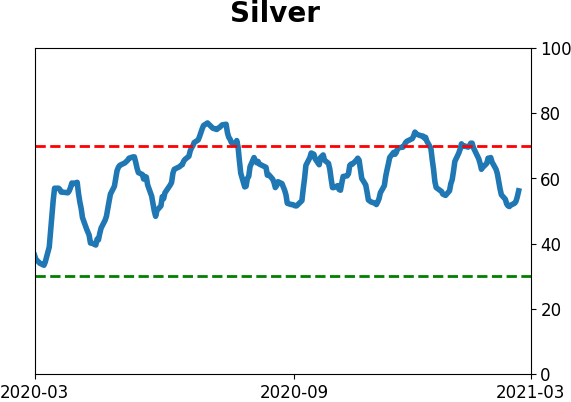
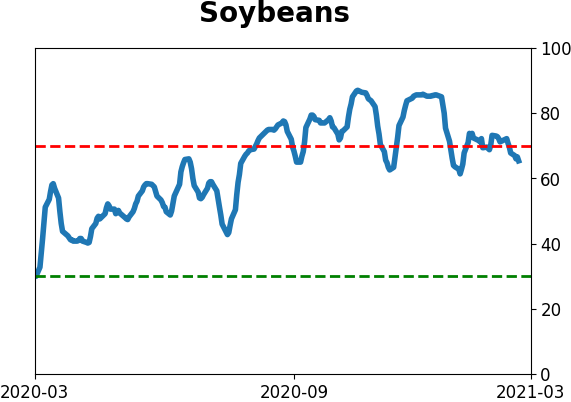
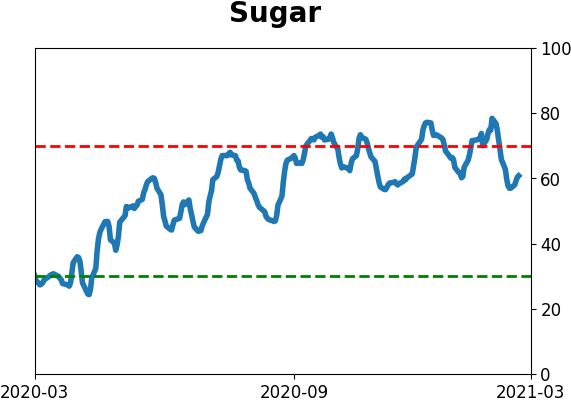
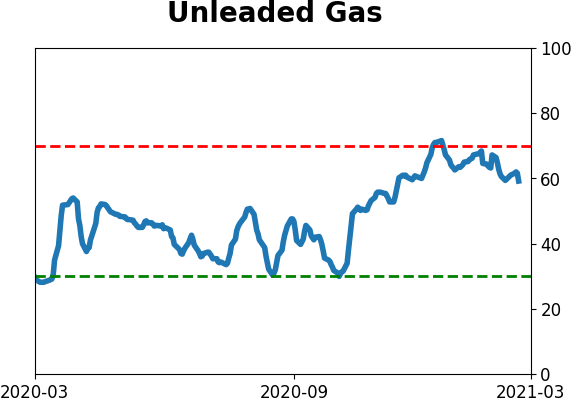
Optimism Index Thumbnails
|
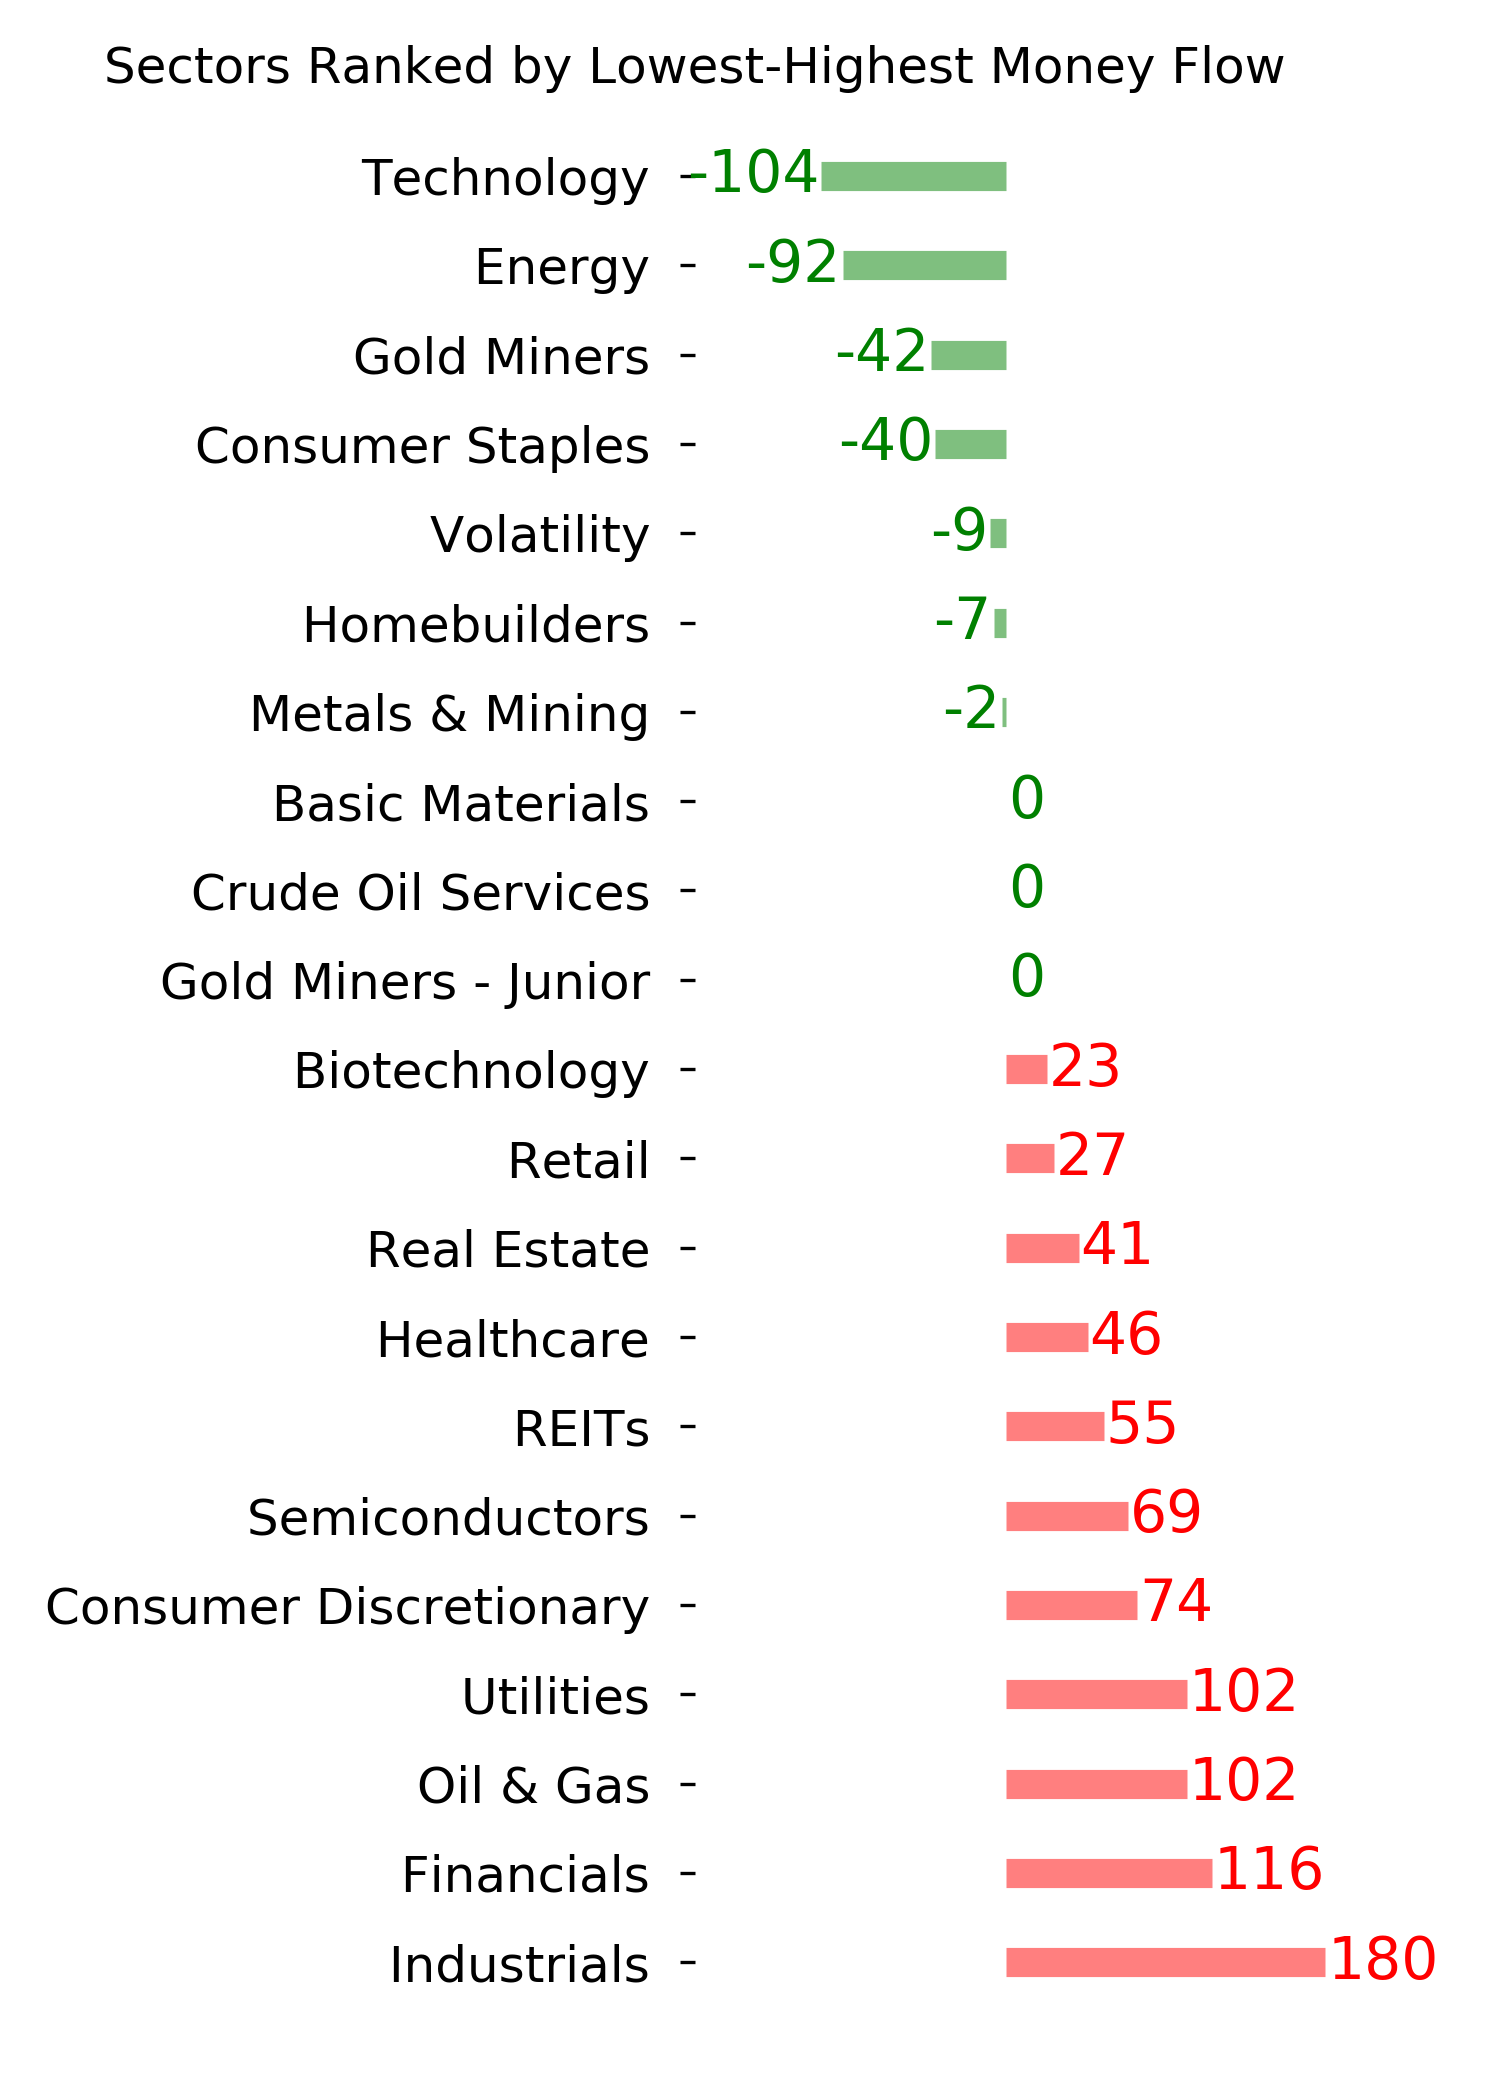
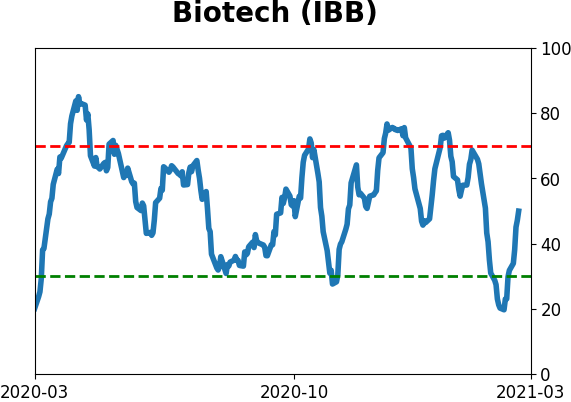
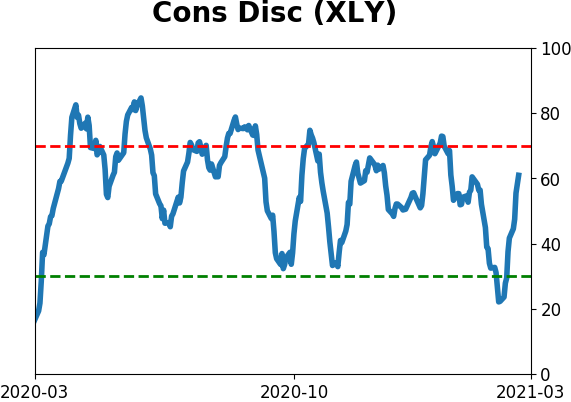
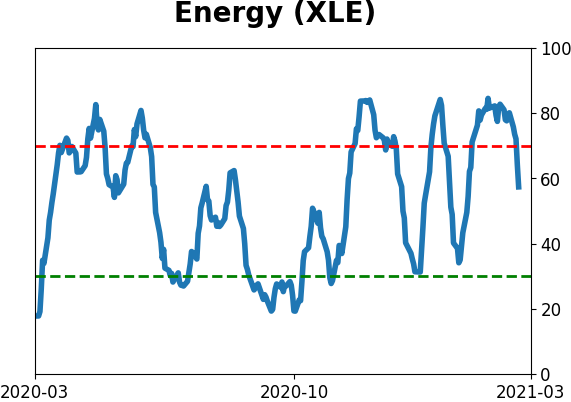
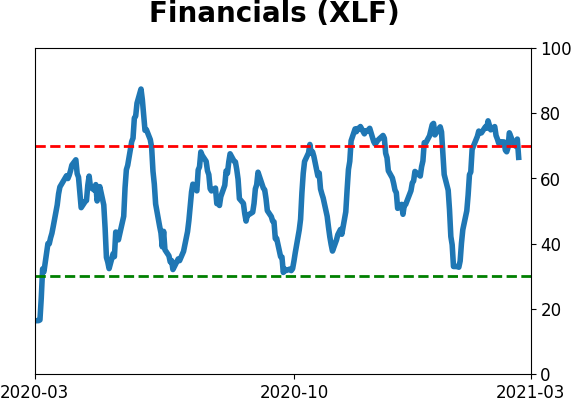
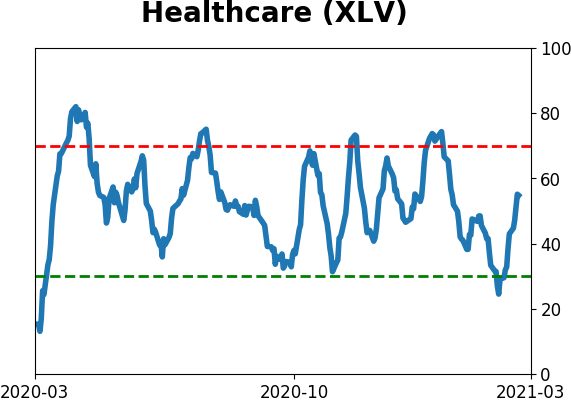
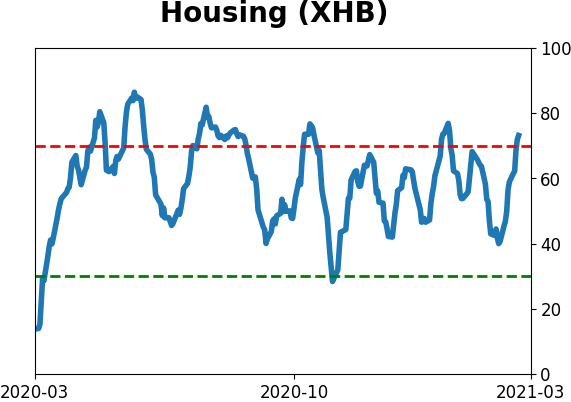
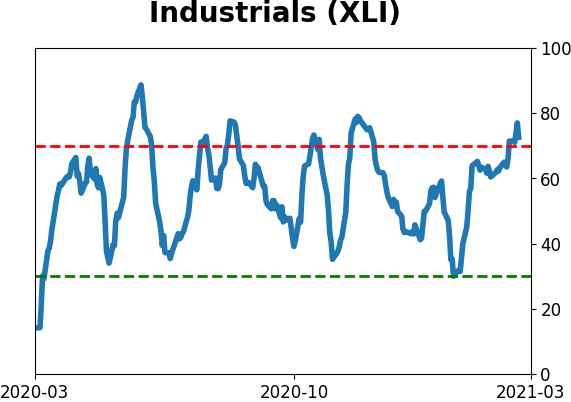
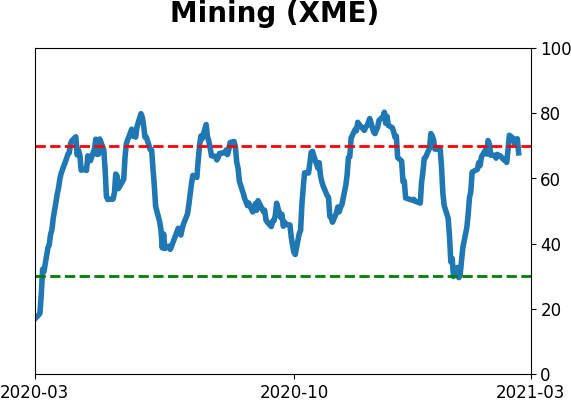
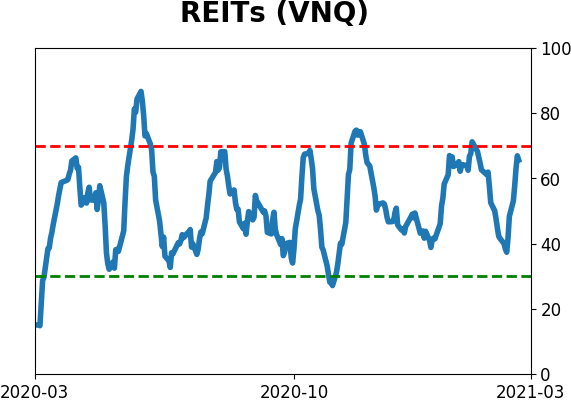
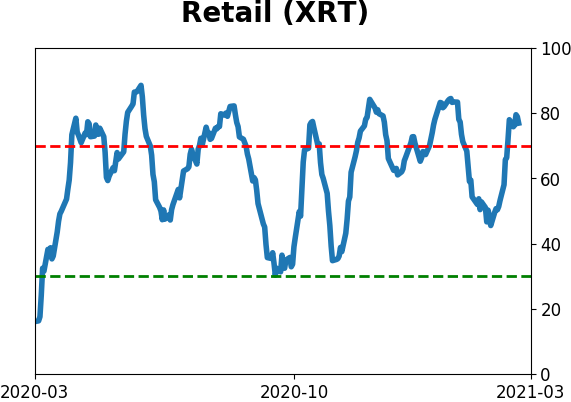
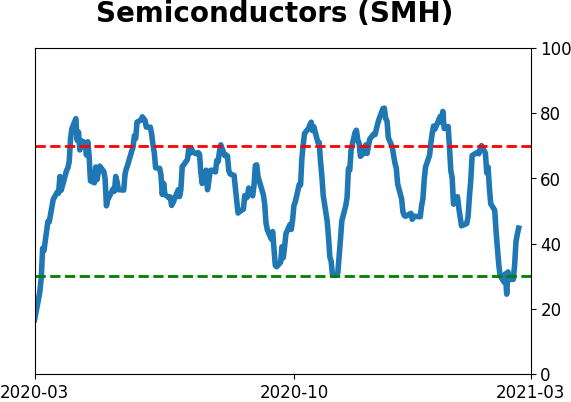
Sector ETF's - 10-Day Moving Average
|
|
|
Country ETF's - 10-Day Moving Average
|
|
|
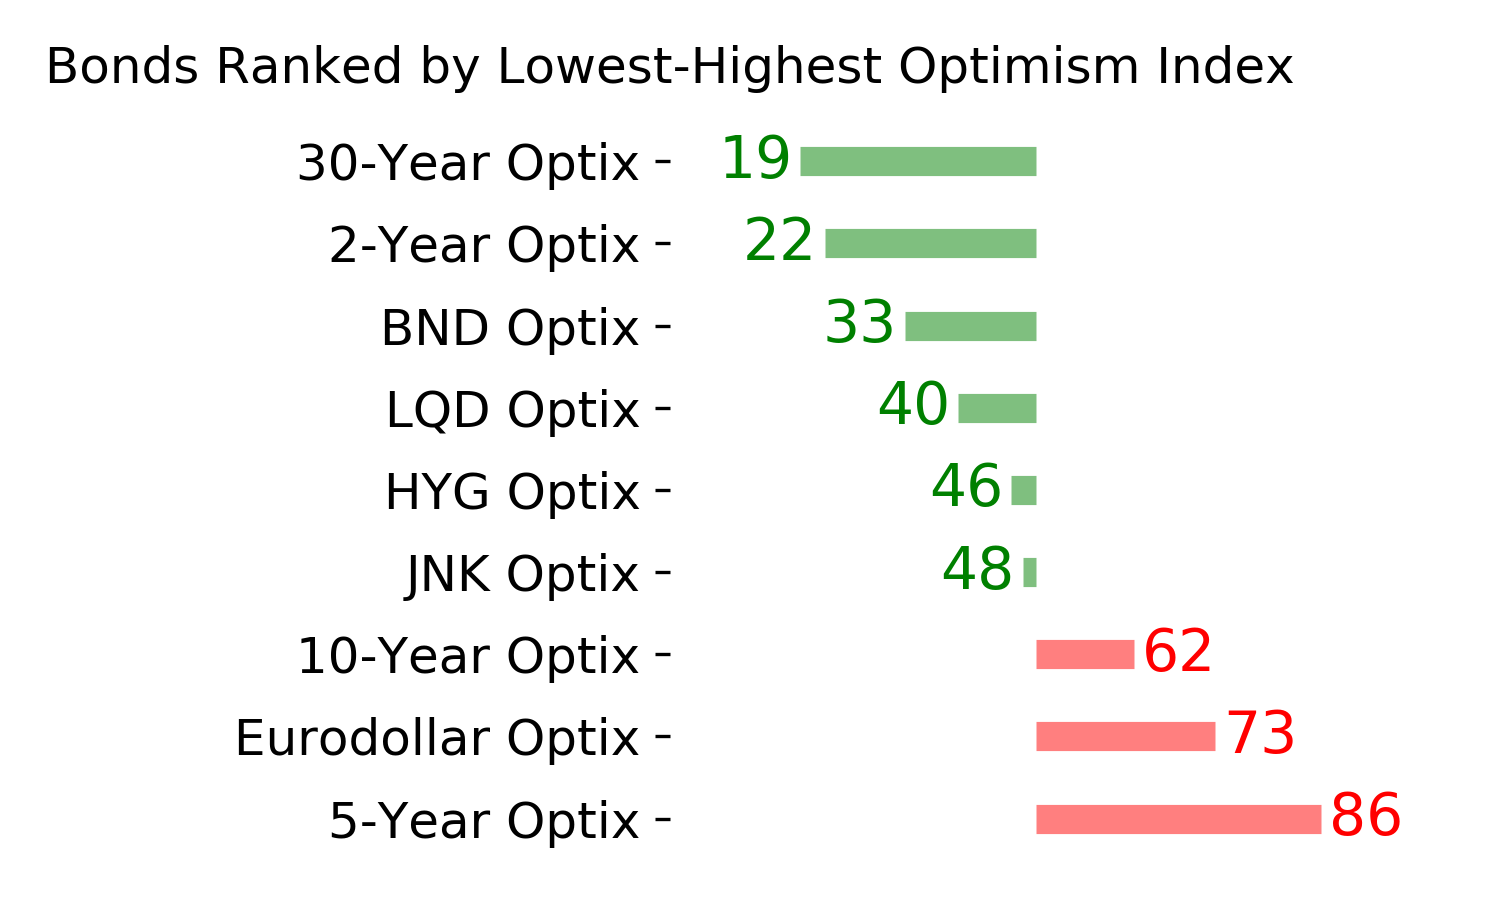
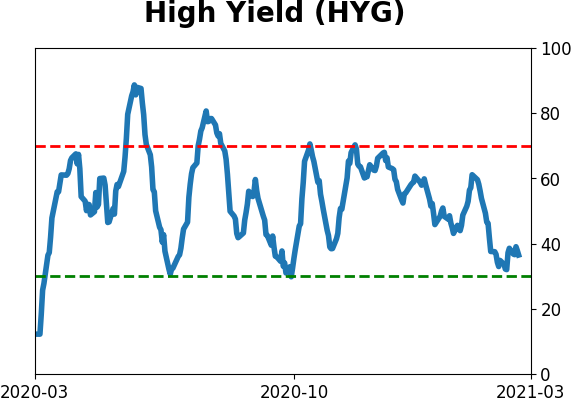
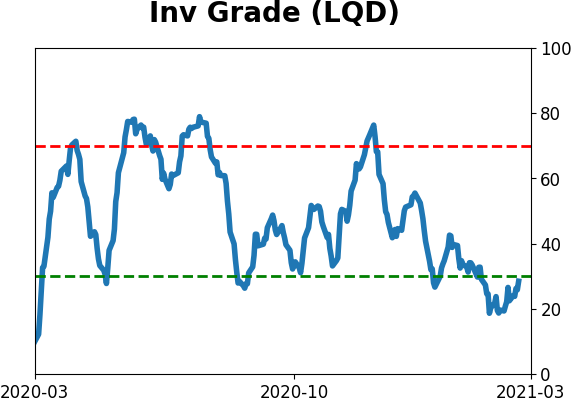
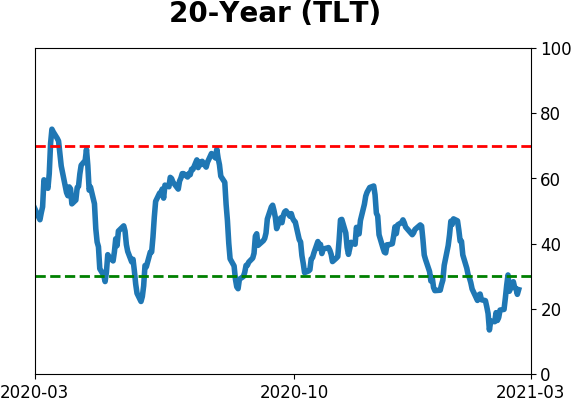
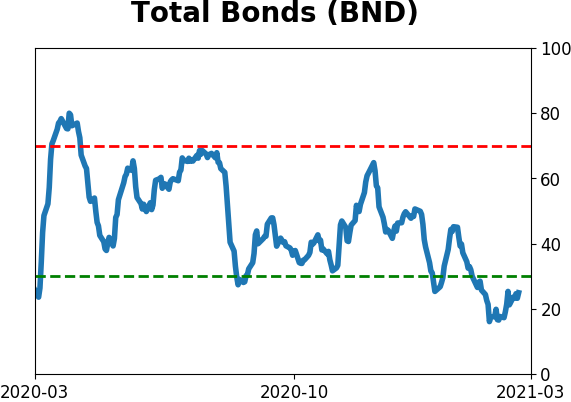
Bond ETF's - 10-Day Moving Average
|
|
|
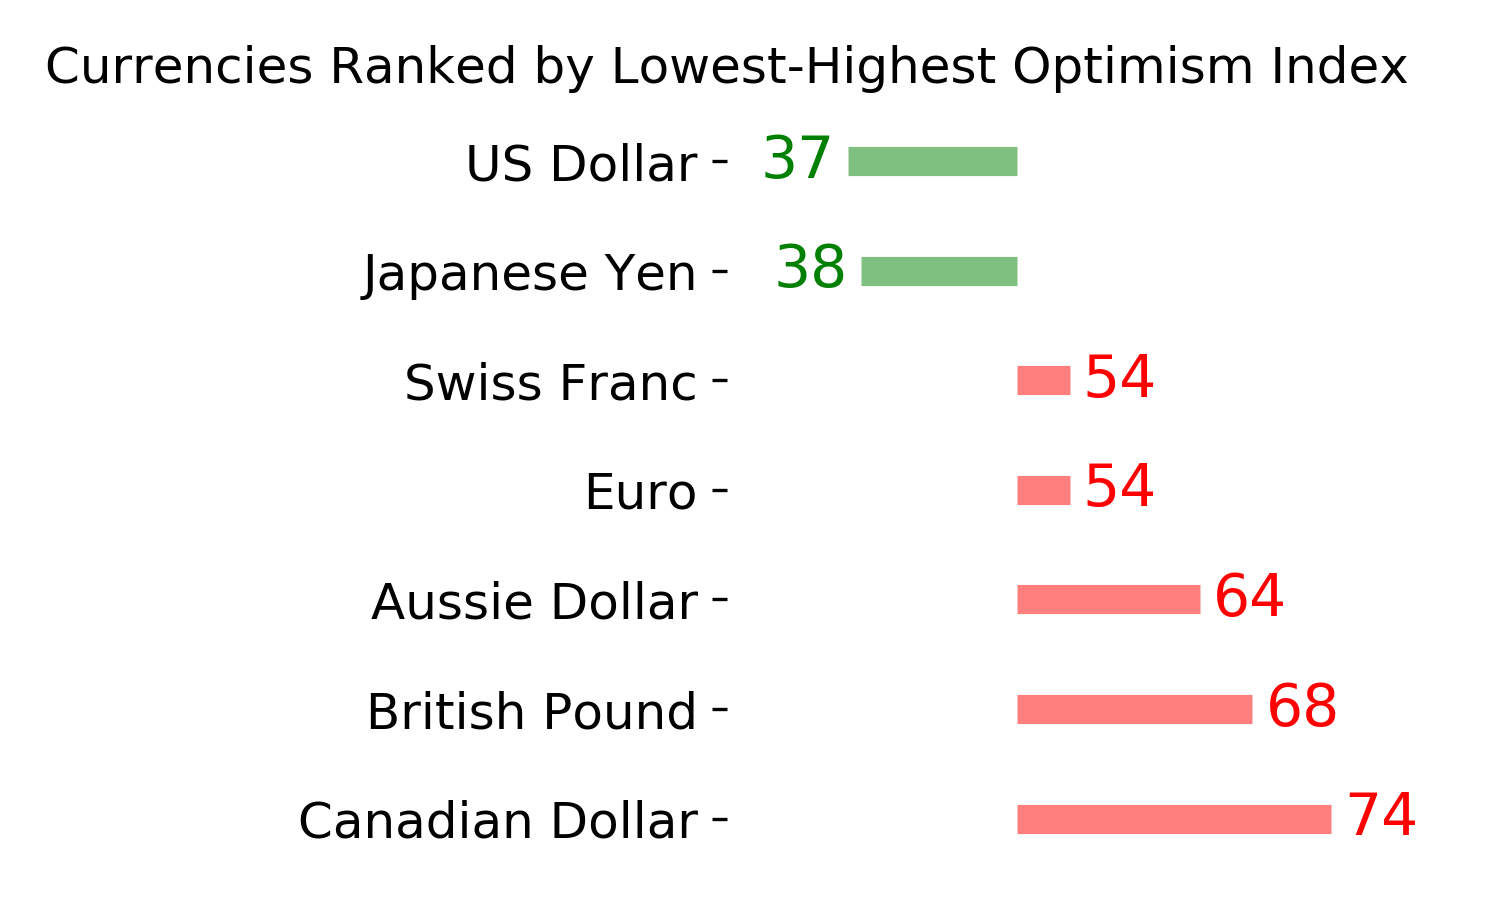
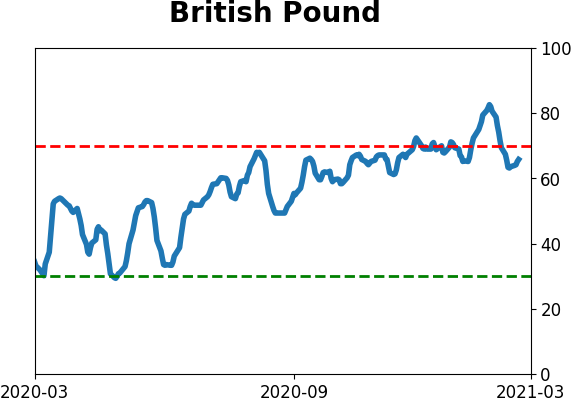
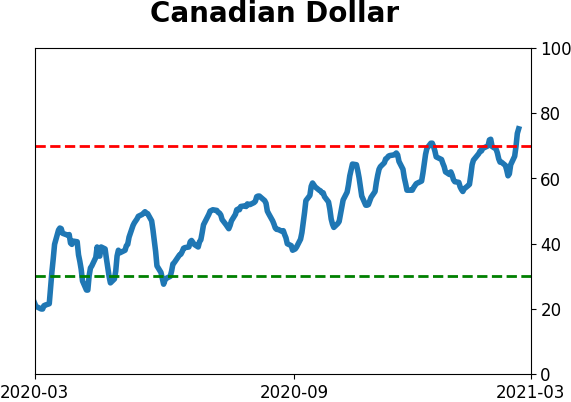
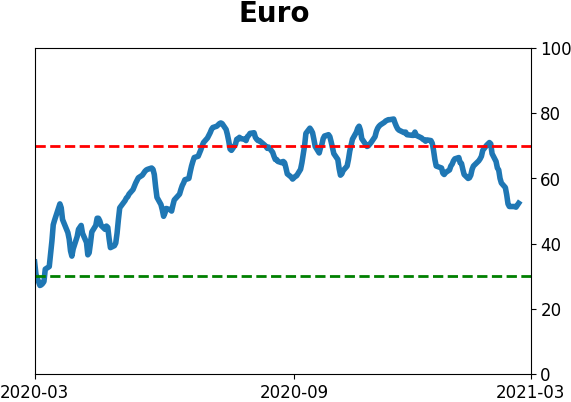
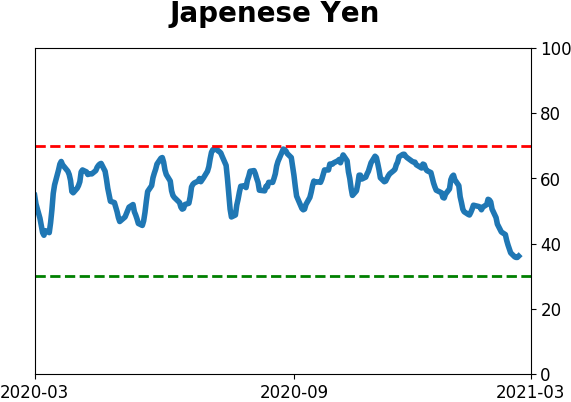
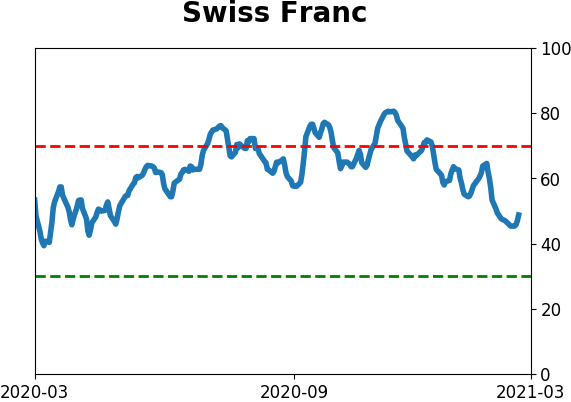
Currency ETF's - 5-Day Moving Average
|
|
|
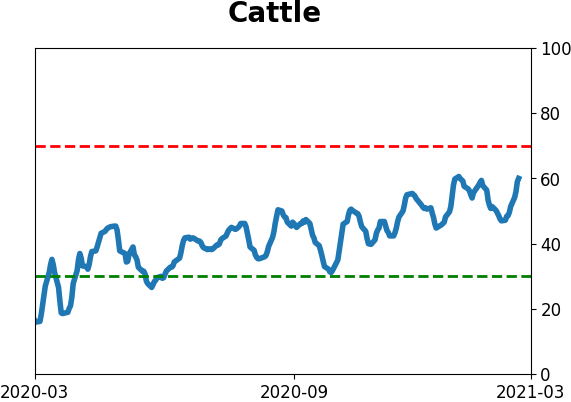
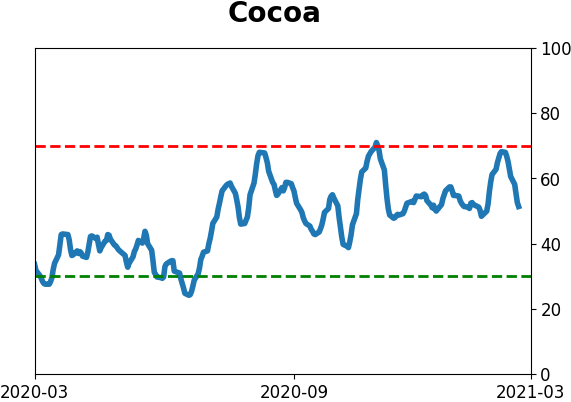
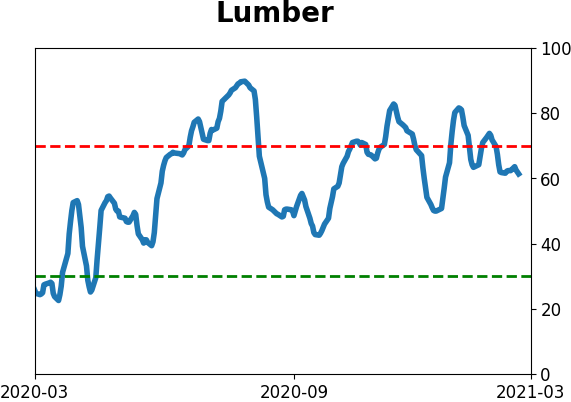
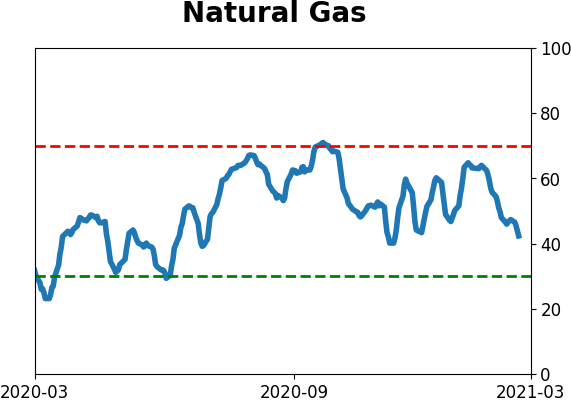
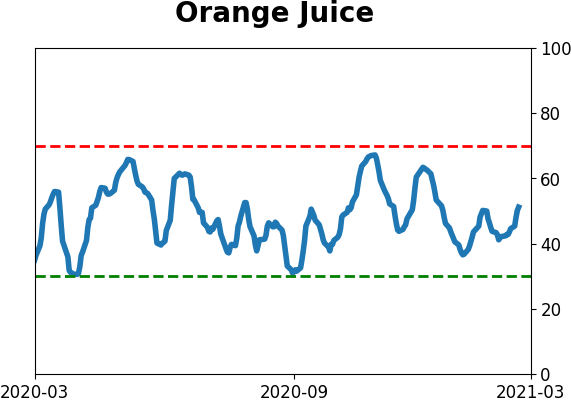
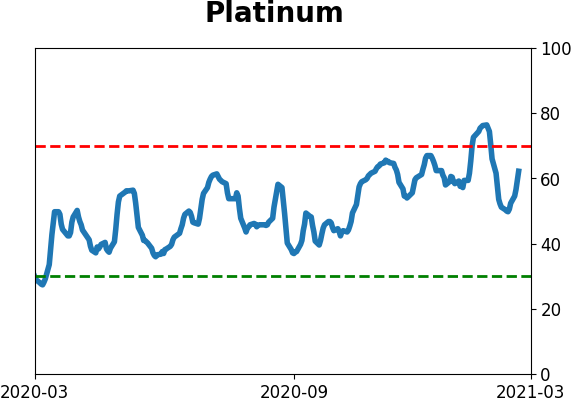
Commodity ETF's - 5-Day Moving Average
|
|