
The Gold Boomerang

Gold has been a major disappointment to many of late. Yet given its historical seasonal tendencies, perhaps the recent weakness should not come as a complete surprise.
From here we will focus on "trading day of month" - i.e., the first trading day of each month is TDM #1. the second trading day of the month is TDM #2 and so on.
We will focus on two trading periods, one bearish and one bullish:
- Unfavorable: 25 trading day days after February Trading Day #18
- Favorable: 6 trading days after April Trading Day #3
For 2021:
- the Unfavorable period extends from the close on 2/25/2021 through the close on 4/1/2021
- the Favorable period extends from the close on 4/6/2021 through the close on 4/14/2021
Let's consider the history of both periods and then combine the two.
Gold: February TDM 18 + 25 trading days
The chart below displays the hypothetical cumulative dollar gain or loss achieved by holding a 1-lot of gold futures during this period every year since 1975, including so far this year.
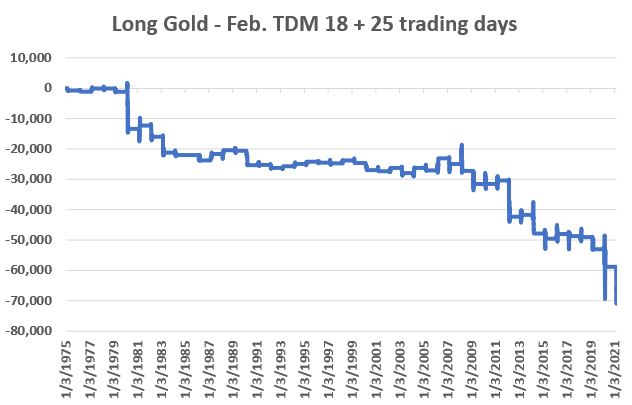
The table below displays the relevant facts and figures through 2020.
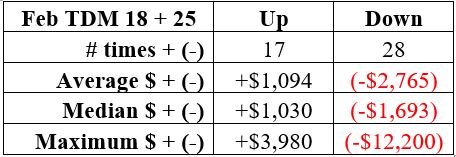
Gold: April TDM 3 + 6 trading days
The chart below displays the hypothetical cumulative dollar gain or loss achieved by holding a 1-lot of gold futures during this period every year since 1975.
The table below displays the relevant facts and figures through 2020.
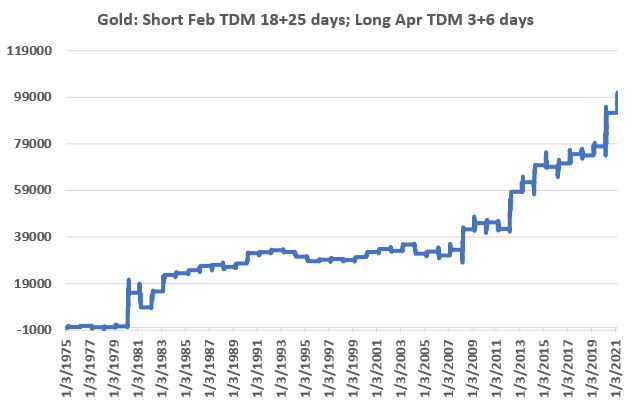
The Two Periods Combined
Certainly, there are no "sure things" here. Still, the long-term tendencies are clear. Gold tends to show weakness during the first period, then "boomerangs" and tends to show strength during the second period. To further illustrate this, let's test the following hypothetical strategy:
- Short 1 Gold futures for 25 trading days following the close on Feb TDM 18
- Long 1 Gold futures for 6 trading days following the close on Apr TDM 3
The chart below displays the hypothetical cumulative dollar gain or loss achieved by holding a short 1-lot of gold futures during the first period and a long 1-lot position of gold futures during the second period every year since 1975.
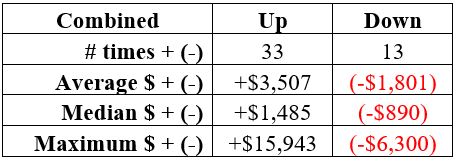
The table below displays the relevant facts and figures.
Summary
The primary takeaway from the information above is that gold has a "tendency" to decline from late February through early April and a "tendency" to bounce for a short period in early April. In terms of real-world trading, it is important to clearly understand and appreciate the subtle - yet critical - difference between a "tendency" and "you can't lose trading gold futures."
From a risk management perspective, probably the two key things to note are:
- a 72% winning percentage (33 wins and 13 losses) is NOT the same as a 100% winning percentage
- In one year (1981) this "strategy" lost -$6,300 (so not for the faint of heart nor the poorly capitalized
Traders not willing or able to trade gold futures can consider ETFs that track gold such as ticker IAU and GLD.