Data &
Technology
Research
Reports
Report Solutions
Reports Library
Actionable
Strategies
Free
Resources
Simple Backtest Calculator
Simple Seasonality Calculator
The Kelly Criterion Calculator
Sentiment Geo Map
Public Research Reports
Free Webinar
Pricing
Company
About
Meet Our Team
In the News
Testimonials
Client Success Stories
Contact
Log inLoginSign up
< BACK TO ALL REPORTS

When rising yields are driving volatility

Jason Goepfert
2021-03-16
Over the past month, the correlation between the VIX and 10-year Treasury yields has soared to one of the highest levels in a decade, suggesting bonds are influencing stock investors' expectations for future volatility. This has been a mild negative for stocks.

What's been scaring investors over the past month? Rising yields.

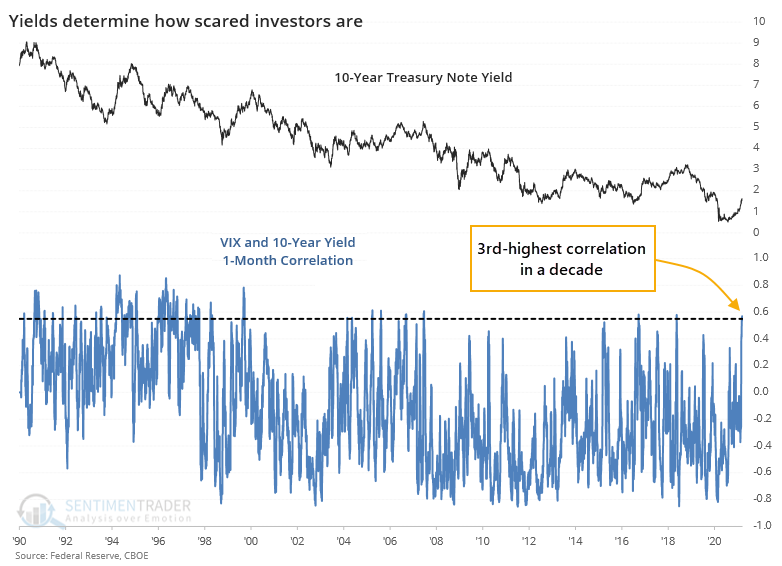
Maybe "scared" isn't the right word, since the VIX indicator, which measures options traders' estimate of future volatility, has mostly been dropping. So "influencing" is probably more appropriate. And over the past month, yields have been influencing the VIX at one of the highest levels in a decade.

The chart below shows a rolling 1-month correlation between daily changes in the VIX and 10-year Treasury yields. The higher the blue line, the more that yields seem to be influencing stock investors' volatility expectations.

Whether this matters is open to interpretation. So, let's put some numbers to it. We'll go back to the inception of the VIX and look for every time the 21-day correlation in daily changes between it and the yield on 10-year notes exceeds 0.55. This is on a scale of -1.0 (perfect inverse correlation) to +1.0 (perfect positive correlation).

The table below shows only the instances when yields have risen the most over the past month.

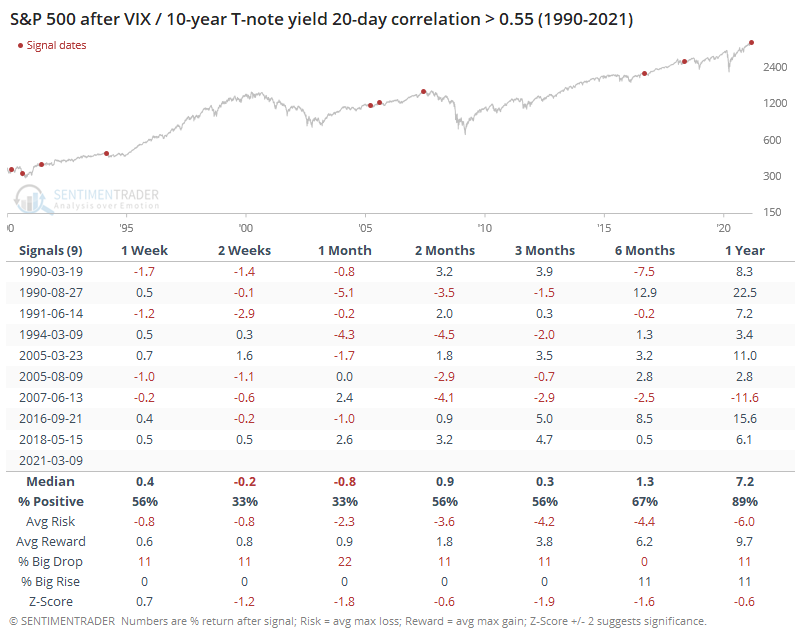
When rising yields most influenced the VIX, the S&P 500 struggled a bit over the next 2-3 weeks. All but one instance, the latest one in 2018, showed a negative return either 1 or 2 months later. And even that 2018 signal ended up giving its gains back eventually. Over the next 3 months, the S&P averaged a return of only +0.3%.

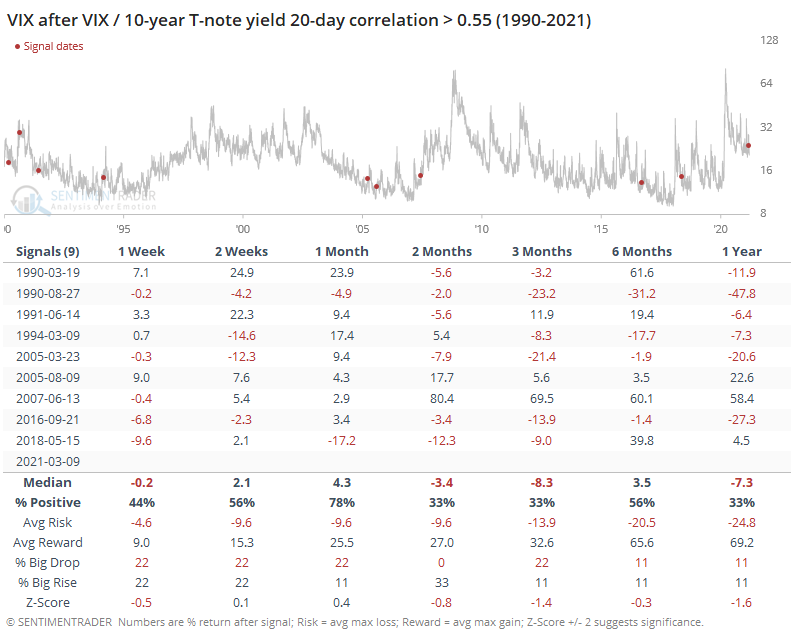
For the VIX itself, it was a mixed signal. It shows losses across most time frames, with the biggest chance for a spike being over the next month.

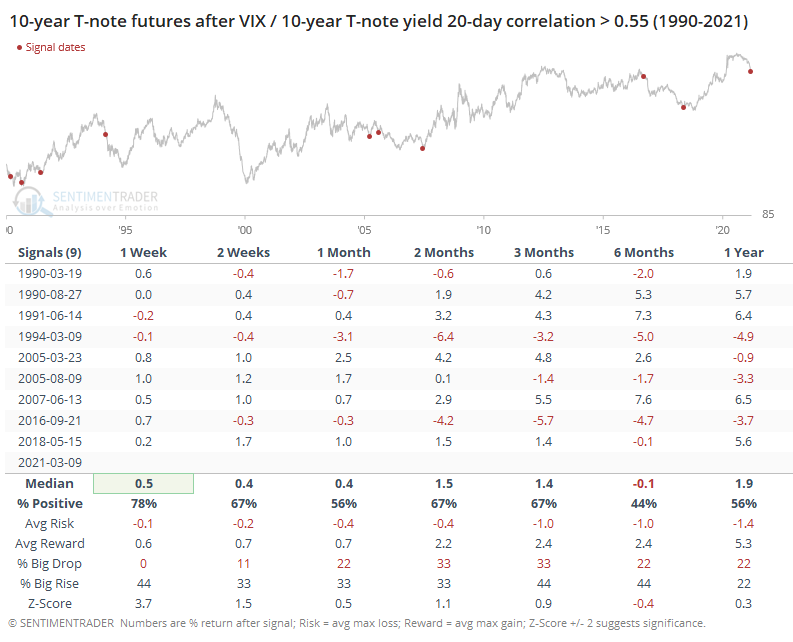
For Treasuries, it tended to be more of a shorter-term positive. Because yields were rising, that means note and bond prices were declining, and when the correlation with the VIX got to this high of a level, it mostly coincided with shorter-term oversold conditions in bonds.

It's often helpful to look at opposing conditions, so the table below shows returns in the S&P when the VIX and yields were highly correlated, but it was due to declining yields, not rising ones.

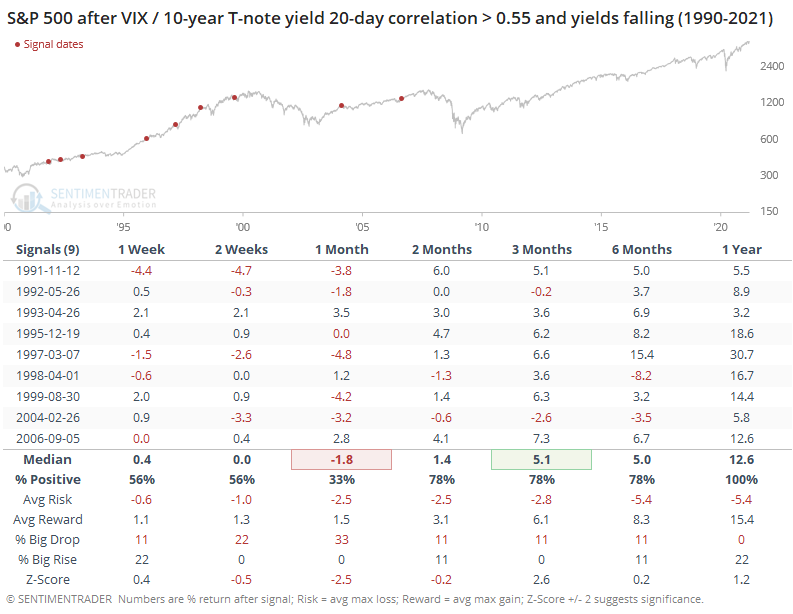
Here, shorter-term returns were still sketchy, but over the next few months, the S&P averaged a return of +5.1% (versus only 0.3% when yields were rising more), and over the next year, showed a gain every time.

Opinions on what the rise in yields means for investors are all over the place. At least, we can suggest with a mild amount of confidence that when rising yields have been a primary force driving forward volatility expectations, then stocks have struggled more than when they were fearing the economic stagnation that lower yields would suggest.

DATA &
TECHnologies
IndicatorEdge
‍
BackTestEdge
‍
Other Tools
‍
DataEdge API
RESEARCH
reports
Research Solution
‍
Reports Library
‍
actionable
Strategies
Trading Strategies
‍
Smart Stock Scanner
‍
FREE
RESOUrCES
Simple Backtest
Calculator
Simple Seasonality
Calculator
The Kelly Criterion
Calculator
Sentiment Geo Map
‍
Public Research Reports
‍
Free Webinar
COMPANY
‍
About
‍
Meet our Team
‍
In the News
‍
Testimonials
‍
Client Success Stories
Pricing
Bundle pricing
‍
Announcements
‍
FAQ
© 2024 Sundial Capital Research Inc. All rights reserved.
Setsail Marketing
TermsPrivacyAffiliate Program
Risk Disclosure: Futures and forex trading contains substantial risk and is not for every investor. An investor could potentially lose all or more than the initial investment. Risk capital is money that can be lost without jeopardizing ones’ financial security or life style. Only risk capital should be used for trading and only those with sufficient risk capital should consider trading. Past performance is not necessarily indicative of future results.

Hypothetical Performance Disclosure: Hypothetical performance results have many inherent limitations, some of which are described below. No representation is being made that any account will or is likely to achieve profits or losses similar to those shown; in fact, there are frequently sharp differences between hypothetical performance results and the actual results subsequently achieved by any particular trading program. One of the limitations of hypothetical performance results is that they are generally prepared with the benefit of hindsight. In addition, hypothetical trading does not involve financial risk, and no hypothetical trading record can completely account for the impact of financial risk of actual trading. for example, the ability to withstand losses or to adhere to a particular trading program in spite of trading losses are material points which can also adversely affect actual trading results. There are numerous other factors related to the markets in general or to the implementation of any specific trading program which cannot be fully accounted for in the preparation of hypothetical performance results and all which can adversely affect trading results.

Testimonial Disclosure: Testimonials appearing on this website may not be representative of other clients or customers and is not a guarantee of future performance or success.