
Market Breadth Update

The S&P 500 Index closed at a new all-time high last Thursday and Friday. Whenever an Index registers a new high, I always like to assess the market's internal condition to see if the troops are participating. In today's note, I want to review how a composite for market breadth compares to history when the Index is registering new all-time highs and provide an update on the composite breadth divergence risk-off model for several indexes.
Market Breadth Composite Indicator for All-Time High Ranking
The composite includes the following:
- Percentage of issues above the 10-day moving average
- Percentage of issues above the 50-day moving average
- Percentage of issues above the 200-day moving average
- Percentage Spread Between 21-Day Highs and Lows
- Percentage Spread Between 63-Day Highs and Lows
- Percentage Spread Between 252-Day Highs and Lows
The individual component values are summed and divided by six to arrive at a single composite value. Please note, composite values can turn negative during corrections and bear markets as new lows overwhelm new highs in the spread calculation.
Breadth Composite Study
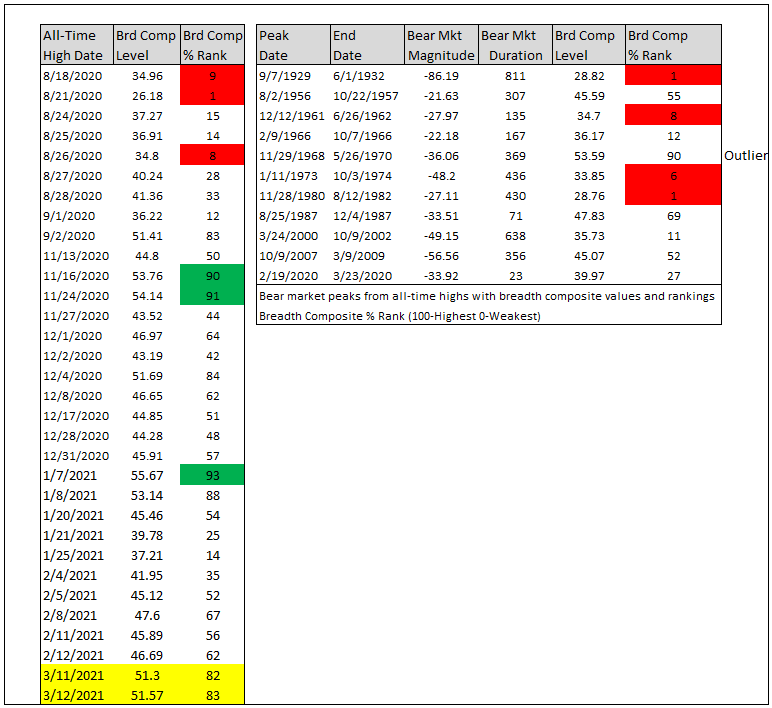
I first identified every single all-time closing high in the S&P 500 Index since 1928. According to my calculation, there are 1,287 instances. I then ranked each breadth composite value on the day of the all-time closing high. Rankings range from 100 (strongest) to 0 (weakest). By ranking each all-time high, I can now make an apples-to-apple comparison throughout history.
S&P 500 - Large-Cap Breadth Rank
The breadth composite rankings for the new all-time highs last week look solid, with readings in the 82nd and 83rd percentile. As the table on the rights shows, breadth rankings typically register lower readings at major market peaks.
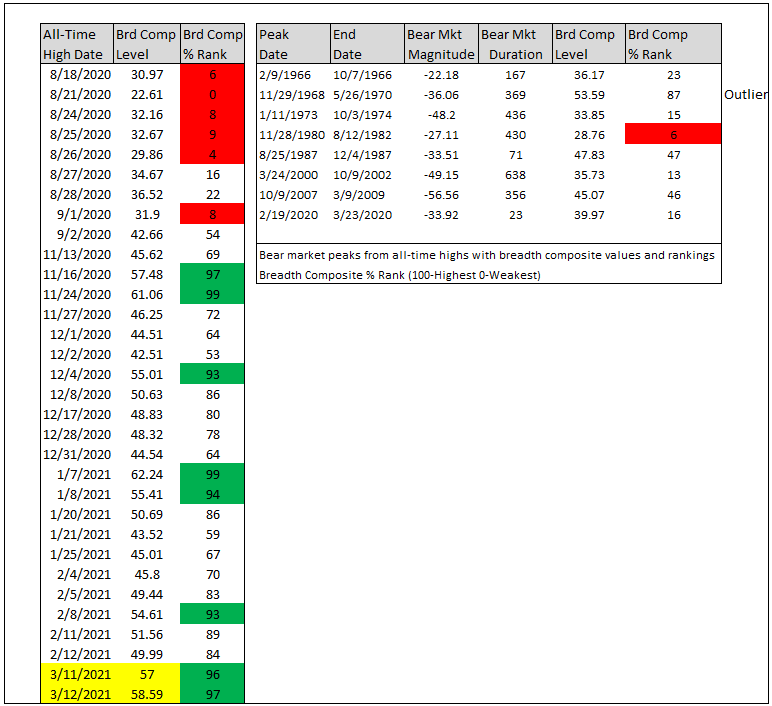
S&P 1500 - All-Cap Breadth Rank
If I conduct the same study for the S&P 1500, one can see breadth rankings that are even better than the large-cap numbers. Mid and small-cap stocks have been strong, and that is clearly on display with the rankings since last November.
Please note the rankings for the S&P 1500 start in 1963, and I use new all-time highs for the S&P 500 given data limitations.
Market Breadth Composite Indicator for Divergence Signals
The breadth composite for divergence signals contains two indicators that use long duration calculations. I prefer the long-duration composite over the all-duration one used in the ranking method above as it is less likely to produce whipsaw signals.
Please see the following note for an explanation of the breadth divergence signal.
The composite includes the following:
- Percentage of issues above the 200-day moving average
- Percentage Spread Between 252-Day Highs and Lows
The individual component values are summed and divided by two to arrive at a single composite value. Please note, composite values can turn negative during corrections and bear markets as new lows overwhelm new highs in the spread calculation.
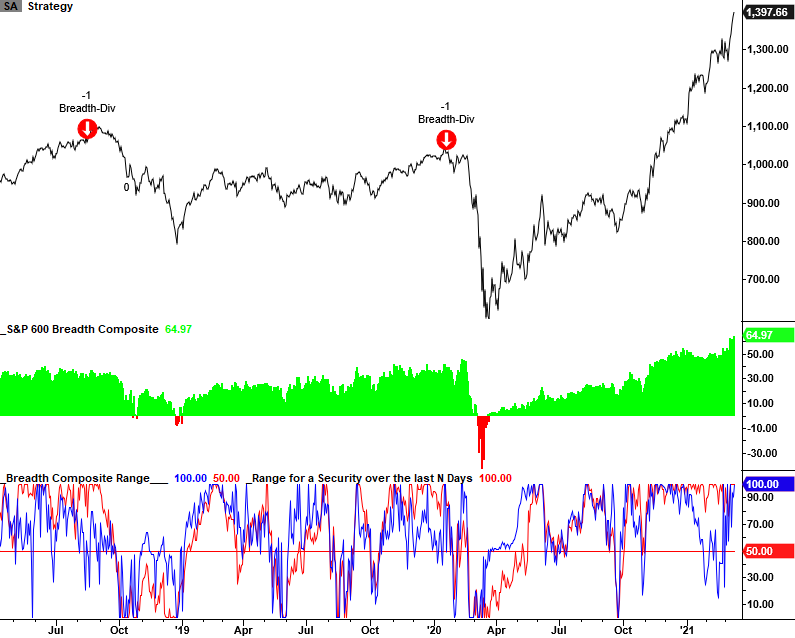
Breadth Composite Divergence Signal Example - S&P 600
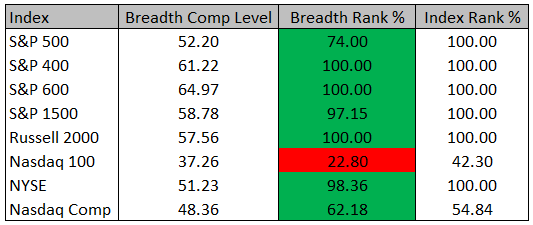
Breadth Composite for Divergence Signals Table
As the table below shows, breadth rankings look solid across several indexes except for the Nasdaq Composite and the Nasdaq 100. The stocks in technology dominant indexes have been under pressure from the rotation from growth to value. With solid rankings, high composite levels, and indexes trading at new highs, a broad clustering of divergence signals is unlikely in the near-term. Remember, the first two conditions in the signal require the breadth rank to be in the 50th percentile or less while the Index is trading in the 90th percentile or greater over a lookback period. In most cases, the lookback period is 63 days.
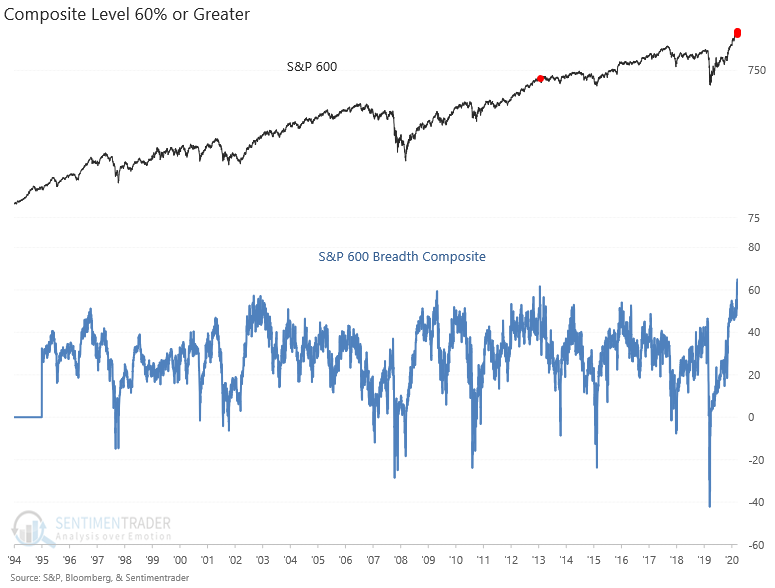
S&P 600 Breadth Composite
The following chart highlights the strong participation in small-cap stocks of late. The breadth composite surged to a new all-time high last Friday.
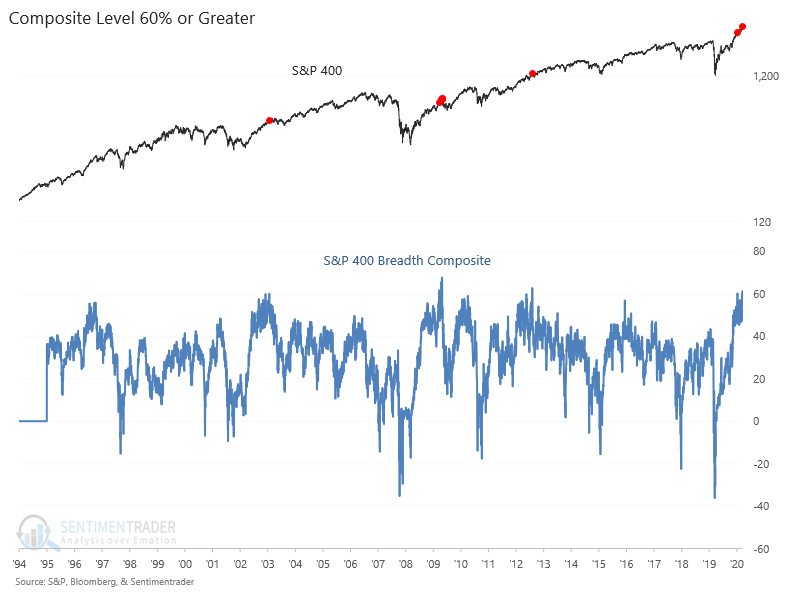
S&P 400 Breadth Composite
The S&P 400 breadth composite surged to the third-highest level in history on Friday.
Conclusion: Market breadth remains firm even with the substantial internal rotation between growth and value. Historically, small-cap stocks will be among the first groups to exhibit internal weakness ahead of broad market corrections and bear markets as they are more economically sensitive. Given the strength in small-caps and several other indexes, a clustering of divergence signals appears unlikely in the near-term.