
What You Need to Know About Inflation (Part II)

This is Part II in a short series highlighting the impact of inflation on the financial markets.
Part I detailed:
- How inflation is calculated
- The history of inflation
- The relationship between inflation and stocks
- The relationship between inflation and bond yields
In Part II I am going to focus on the action of the stock market as it relates to different levels of inflation. In essence, we might refer to this as "The Quick and Dirty Guide to Stocks and Inflation." First, lets set the ground rules for the tests I will display.
How Do We Measure Inflation?
The standard measure of inflation is the 12-month rate-of-change in the Consumer Price Index (CPI). According to Investopedia.com, "The Consumer Price Index (CPI) is a measure that examines the weighted average of prices of a basket of consumer goods and services, such as transportation, food, and medical care. It is calculated by taking price changes for each item in the predetermined basket of goods and averaging them. Changes in the CPI are used to assess price changes associated with the cost of living. The CPI is one of the most frequently used statistics for identifying periods of inflation or deflation."
When Do We Measure Inflation?
This part is a little wonky, but critically important in terms of generating usable results. The CPI is reported each month around the middle of the month for the preceding month. So, for example, the CPI value for the month of January will be reported around February 15th. So, when performing backtests, we cannot assume that we know the January value as of February 1st because it won't actually be reported until around the 15th of February. For testing purposes, I simply use a 1-month lag as follows:
- The data for January (which will presumably come out mid-February) gets evaluated at the end of February and any trades signaled based on January data are executed at the end of the month of February. So, in essence, we would learn the new CPI value at mid-month and could determine if a trade is in store or not at that time. If a trade is in store it will not get executed until the end of the month.
(I warned you it was a little wonky. But it is also necessary for calculating viable results).
How Do We Evaluate Inflation?
In generic terms, like Goldilocks, we want our inflation not hot and not too cold. As detailed in Part I, soaring inflation throws everyone's cost estimates out the window and can cause massive economic disruption - something the market rarely takes kindly to. Likewise, deflation - i.e., a trend of falling prices - can cause a downward economic spiral that is ugly for everyone. So again, we want not too hot, not too cold.
What is the "Right" Rate of Inflation?
There is, of course, no such thing, partly because there are many other factors that affect the stock market beyond just inflation. Still, as far as cutoff values for inflation that are "too high or too low", I am sure that if we crunch every possible permutation there might be some "optimum" set of values. But since we are searching for a simple approach, we will use what I refer to as….
The 4% Inflation Solution
What we will evaluate is the following - how the stock market performs:
- When inflation is greater than +4%
- When inflation is less than -4% (i.e., significant deflation)
- When inflation is greater than -4% but less than +4%
For these tests we will use:
- The monthly closing price for the Dow Jones Industrial Average
- The latest 12-month rate-of-change in the monthly value for the Consumer Price Index (with a 1-month lag as discussed above)
- From February 28, 1914, through February 28, 2021
As a baseline, note that from February 1913 through February 2021 the cumulative price gain for the Dow Jones Industrial Average was +51,232%.
Dow Performance When Inflation >= +4%
Let's look first at Dow performance during those months when inflation at the end of the prior month was +4% or higher. The chart below displays the cumulative price performance for the Dow during these times.
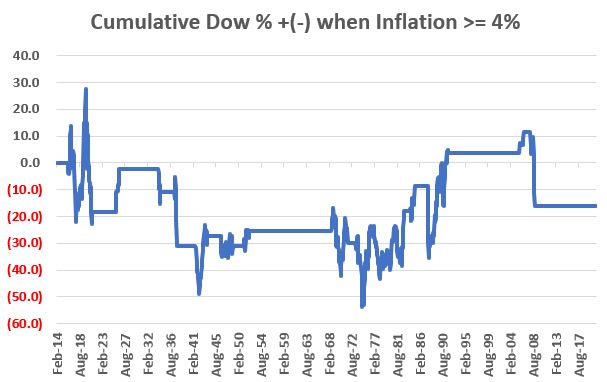
As you can see the results were not always unfavorable, but they also were not very good. The net result of holding the Dow during these periods of above-average inflation is a loss of -16%.
Dow Performance When Inflation <= -4%
Let's look now at Dow performance during those months when inflation at the end of the prior month was -4% or lower, i.e., deflationary. The chart below displays the cumulative price performance for the Dow during these times.
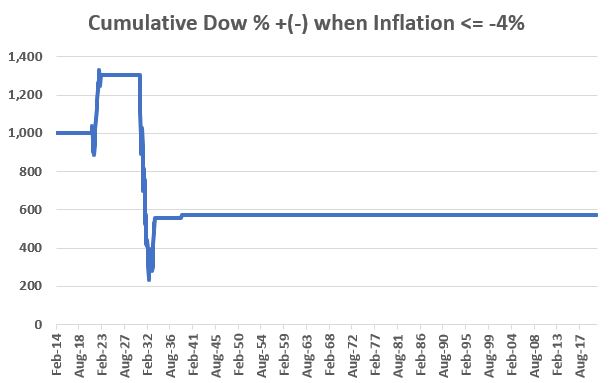
As you can see the results were disastrous, albeit limited to two periods - one in the early 1920's and another in the early 1930's. Would the stock market react the same way if we plunged again into a deflationary spiral? I can't say for sure but I for one hope never to find out.
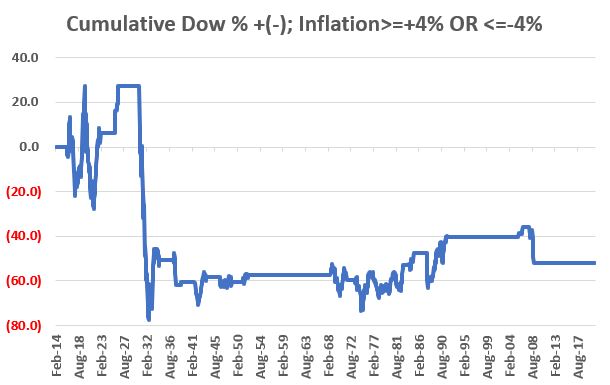
Dow Performance When Inflation >= +4% OR <=-4%
Let's look now at Dow performance during those months when inflation is in the "Not too hot, not too cold" range of above -4% but below +4%. The chart below displays the cumulative price performance for the Dow during these times.
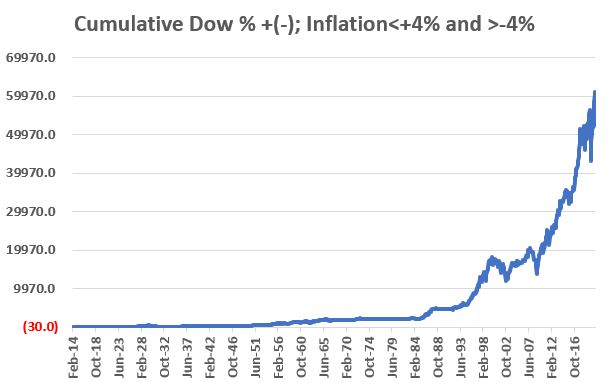
As you can see in the chart above, just because inflation is not running too hot or too cold does not mean that you can't have bear markets along the way. Inflation is only one factor that can impact the stock market. But clearly, the market appears to perform much better overall when inflation is under control.
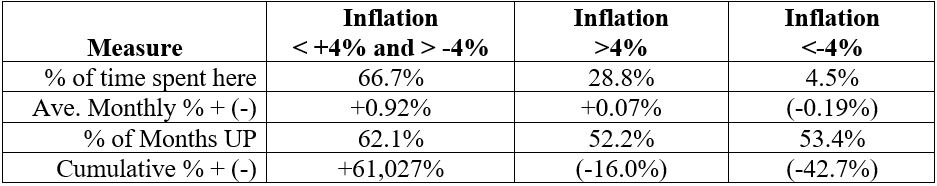
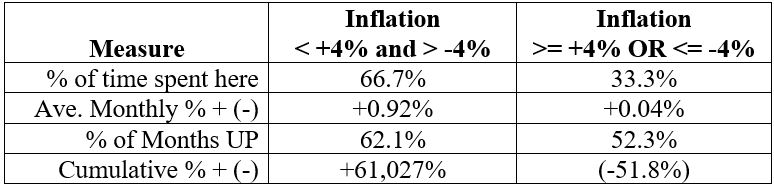
Comparative Results
The table below puts a few facts and figures to the performance of the Dow during the different periods displayed in the charts above.
Putting the Inflation 4% Solution into Action
Just to tie everything together, we will designate the stock market environment as "Favorable" or "Unfavorable" as follows:
- Favorable = If inflation is below +4% AND above -4%
- Unfavorable = If inflation is +4% or higher OR above -4% or lower
The chart below displays the cumulative price performance for the Dow when the inflation environment is deemed "Unfavorable."
The table below compares Dow price performance for Favorable versus Unfavorable periods.
Summary
The results above illustrate why stock investors fear high inflation (and/or deflation). That being said - and despite all of the fear and loathing regarding inflation that seems to be prevalent of late - the latest 12-month rate-of-change for the Consumer Price Index (January data reported in mid-February) was +1.4%.
Where does inflation go from here? It beats me. But there is a ways to go before we reach the "too hot" level of +4%. So ignore the hype and watch for the actual monthly numbers to come out.