
What You Need to Know About Inflation (Part III)

This is Part III in a short (but getting longer, apparently) series highlighting the impact of inflation on the financial markets.
- How inflation is calculated and the history of inflation
- The relationship between inflation and stocks and bond yields
- A simple model (referred to as "The 4% Solution") for identifying when inflation was "too hot or too cold"
In Part III we will take an additional step and add another filter to (hopefully) create a model that is even more useful in identifying when inflation is likely to impact stocks (or not).
First a quick review of the basic mechanisms.
Measuring Inflation
- To calculate the rate of inflation we look at the 12-month rate-of-change of the Consumer Price Index value reported each month
- January CPI comes out roughly mid-February. We make our inflation calculation at that point HOWEVER, any trading action takes place at the end of the month, i.e., at the close on the last day of February (or whatever the current month may be)
The Inflation Model for Stocks (heretofore IMS)
The IMS is comprised of the following indicators and calculated as follows:
A = 12-month rate-of-change in the Consumer Price Index
B = Long-term average A (=3.22%)
C = A - B (a positive value means the current rate of inflation is above the long-term average and vice versa)
D = 0.20-month exponential moving average of C
E = 3-month exponential moving average of C
F = D - E (a positive value suggests the current rate of inflation is rising and vice versa)
G = If Value C > 0 then +2 else 0 (i.e., if current 12-month inflation > 3.22% then +2 else 0)
H = If F > 0 then +1 else 0 (i.e., if 0.20-month EMA > 3-month EMA then +1 else 0)
I = G + H (can equal 0, +1, +2 or +3)
J = If A <= -4% then +3 else 0 (i.e., if deflation hits -4% then +3 else 0)
IMS Value = Greater of I and J
In a nutshell, when it comes to stocks and IMS:
- IMS readings of +3 are unfavorable for stocks
- IMS readings below +3 are favorable stocks
- IMS readings of 0 are considered to be especially favorable for stocks
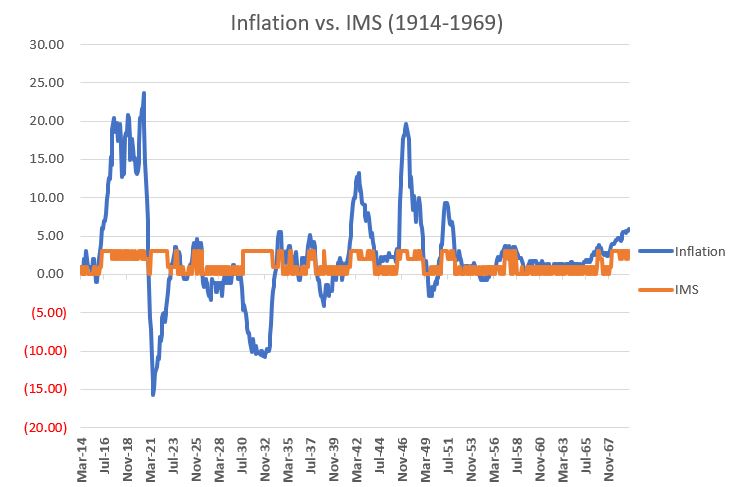
The chart below displays the inflation rate (12-month % change in CPI) in blue and the reading for the IMS in orange, from 1914 through 1969.
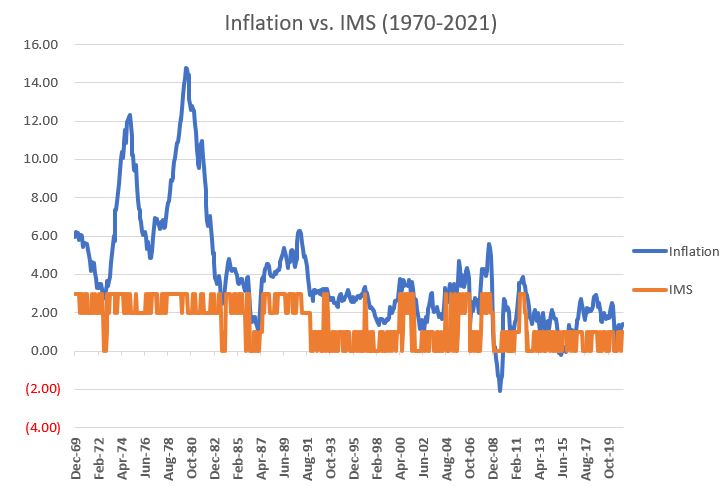
The chart below displays the inflation rate (12-month % change in CPI) in blue and the reading for the IMS in orange, from 1970 into 2021.
The Results
For our test we will:
- Evaluate the status of IMS at the end of the previous month
- Then look at the price performance for the Dow Jones Industrial Average during the current month
- The test begins 3/31/1914 and extends through 2/28/2021
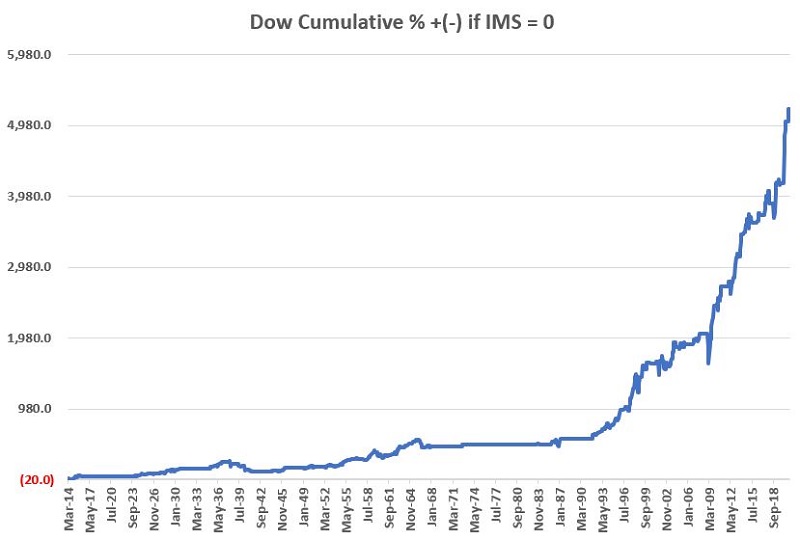
IMS = 0
The chart below displays the hypothetical cumulative % growth achieved by holding the Dow Jones Industrial Average ONLY during those months when the IMS read 0.
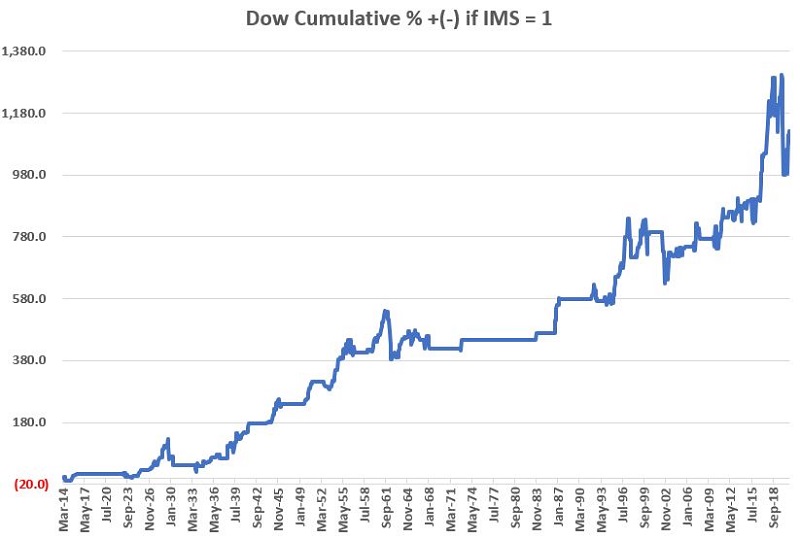
IMS = +1
The chart below displays the hypothetical cumulative % growth achieved by holding the Dow Jones Industrial Average ONLY during those months when the IMS read +1.
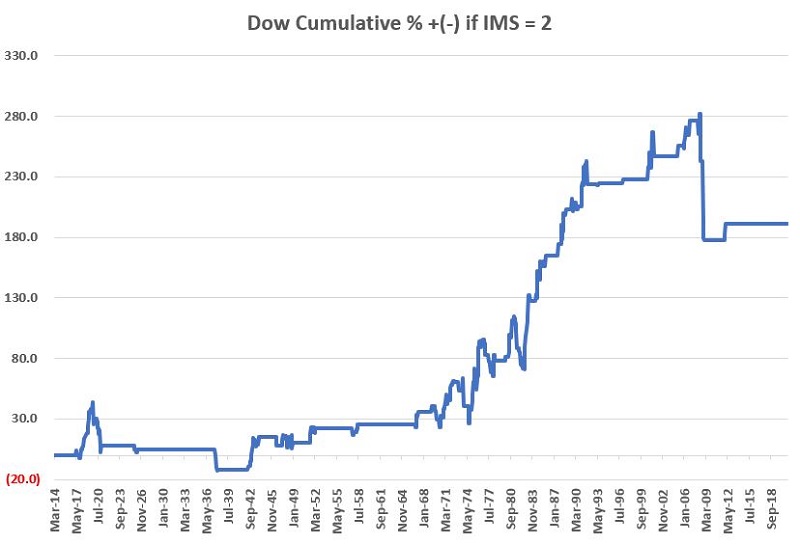
IMS = +2
The chart below displays the hypothetical cumulative % growth achieved by holding the Dow Jones Industrial Average ONLY during those months when the IMS read +2.
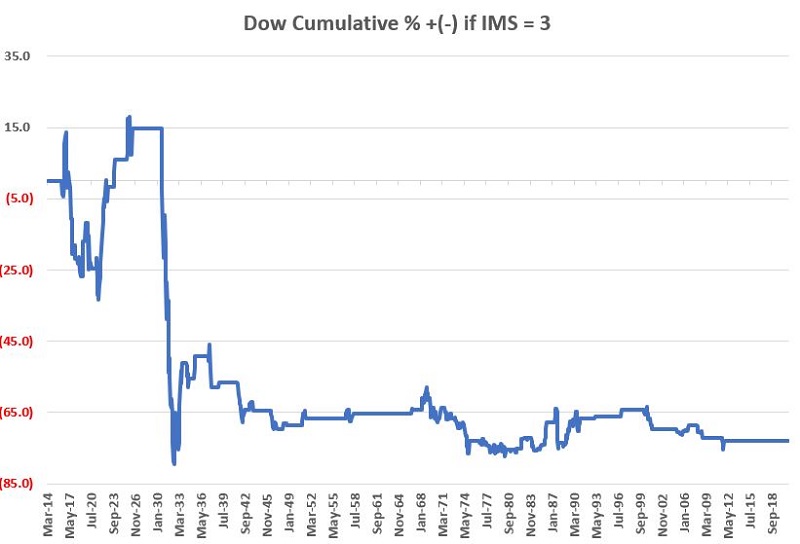
IMS = +3
The chart below displays the hypothetical cumulative % growth achieved by holding the Dow Jones Industrial Average ONLY during those months when the IMS read +3.
The table below displays the relevant facts and figures.
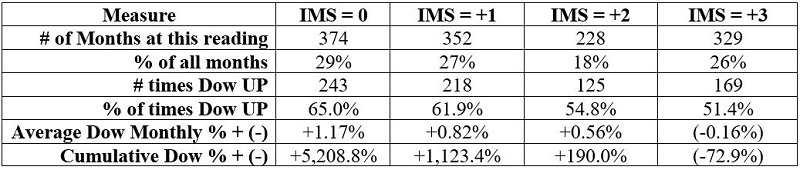
What we see in the charts and table above is that the stock market performs:
- Poorly when IMS reads +3
- Exceptionally well when IMS reads 0
- Reasonably well when IMS reads +1 or +2
The chart below displays the cumulative hypothetical price return for the Dow if we lump all readings below +3 together.
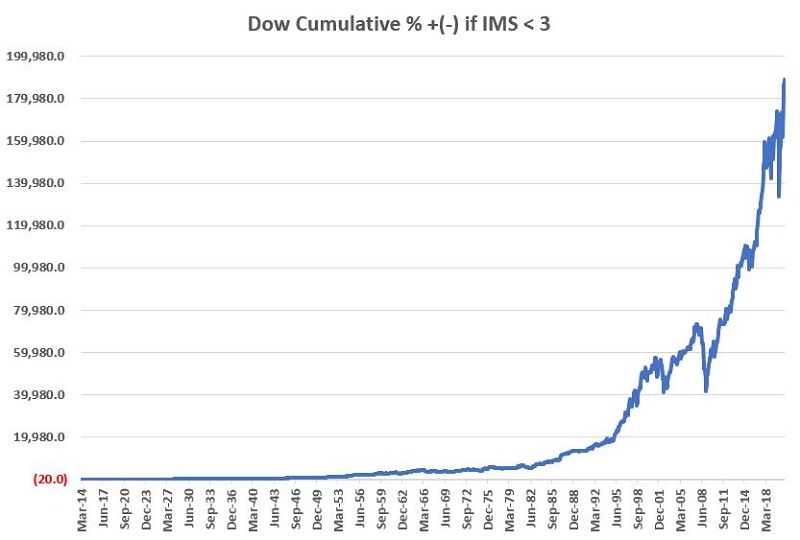
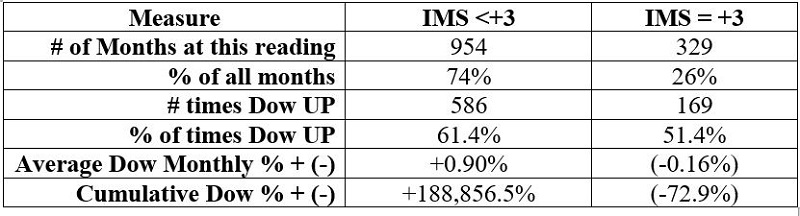
The table below displays the performance of the Dow when IMS was reading less than +3 versus when it was reading +3. The comparative results are, um, stark.
Summary
It is optimistic to assume that the relatively low level of inflation that we have enjoyed for several decades now will continue ad infinitum into the future. Given all of the money-printing that is going on - not to mention the cyclical nature of all things economics-related - it is not unreasonable to expect an increase, possibly a large one, in inflation at some point in the years ahead.
HOWEVER...
As of the end of February 2021, my Inflation Model for Stocks stood at +1. So, despite all of the endless chatter, blather, hand-wringing, and fear and loathing of late regarding any "inevitable" burst of inflation, for the time being, anyway, you might be better off worrying about something else.
The bottom line: Worry about inflation when the time comes to worry about inflation.
Technical Note: Calculating Exponential Moving Averages
Exponential moving average calculations:
0.20-month EMA is calculated as follows:
A = 0.20
B = 1-C
C = 2/(A+1)
So:
B = -0.67
C = 1.67
This month's 0.20-month EMA = (last month's 0.20-EMA * B) + (this month's CPI 12-mo. % change * C)
Thus:
This month's 0.20-month EMA = (last month's 0.20-EMA * -0.67) + (this month's CPI 12-mo. % change * 1.67)
3-month EMA is calculated as follows:
A = 3
B = 1-C
C = 2/(A+1)
So:
B = 0.50
C = 0.50
This month's 3-month EMA = (last month's 3-EMA * B) + (this month's CPI 12-mo. % change * C)
Thus:
This month's 3-month EMA = (last month's 3-EMA * 0.50) + (this month's CPI 12-mo. % change * 0.50)