Why Moving Average Envelopes Matter
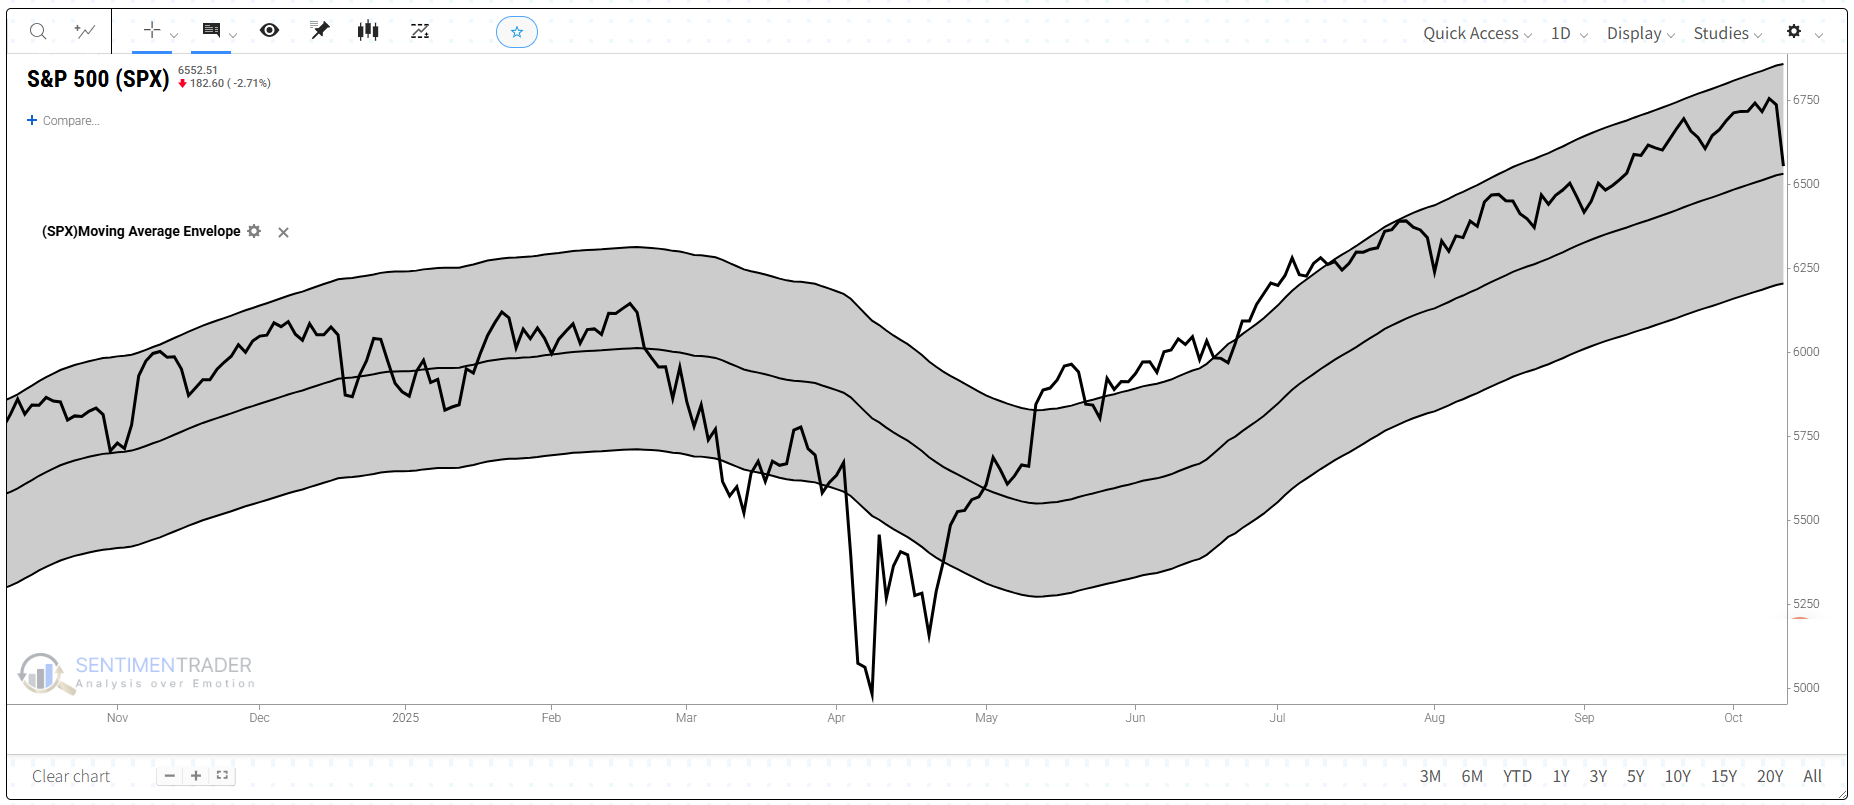
Markets rarely move in straight lines. Prices often swing around their average, sometimes stretching too far before snapping back. Moving Average Envelopes help visualize these extremes—showing when prices may have moved too far above or below their underlying trend.
Clarity: Turn a single moving average into a channel that shows when prices are stretched.
Flexibility: Work across timeframes and with any moving average type (SMA or EMA).
Volatility Insight: The envelope width reflects market activity—narrow in calm periods and wider during turbulence.
How Traders Use Moving Average Envelopes
Identify Overbought and Oversold Conditions: When price touches or exceeds the upper band, it may suggest overextension; near or below the lower band, it may indicate undervaluation.
Filter False Breakouts: Envelopes delay signals until price moves meaningfully beyond its average, reducing whipsaws in sideways markets.
Spot Trend Continuations or Reversals: Sustained moves outside the envelope can confirm strong momentum; quick reentries often precede reversals.
Adjust to Volatility: Traders widen bands in high-volatility markets and narrow them in quiet phases to maintain signal accuracy.
Real-World Results: Do They Actually Work?
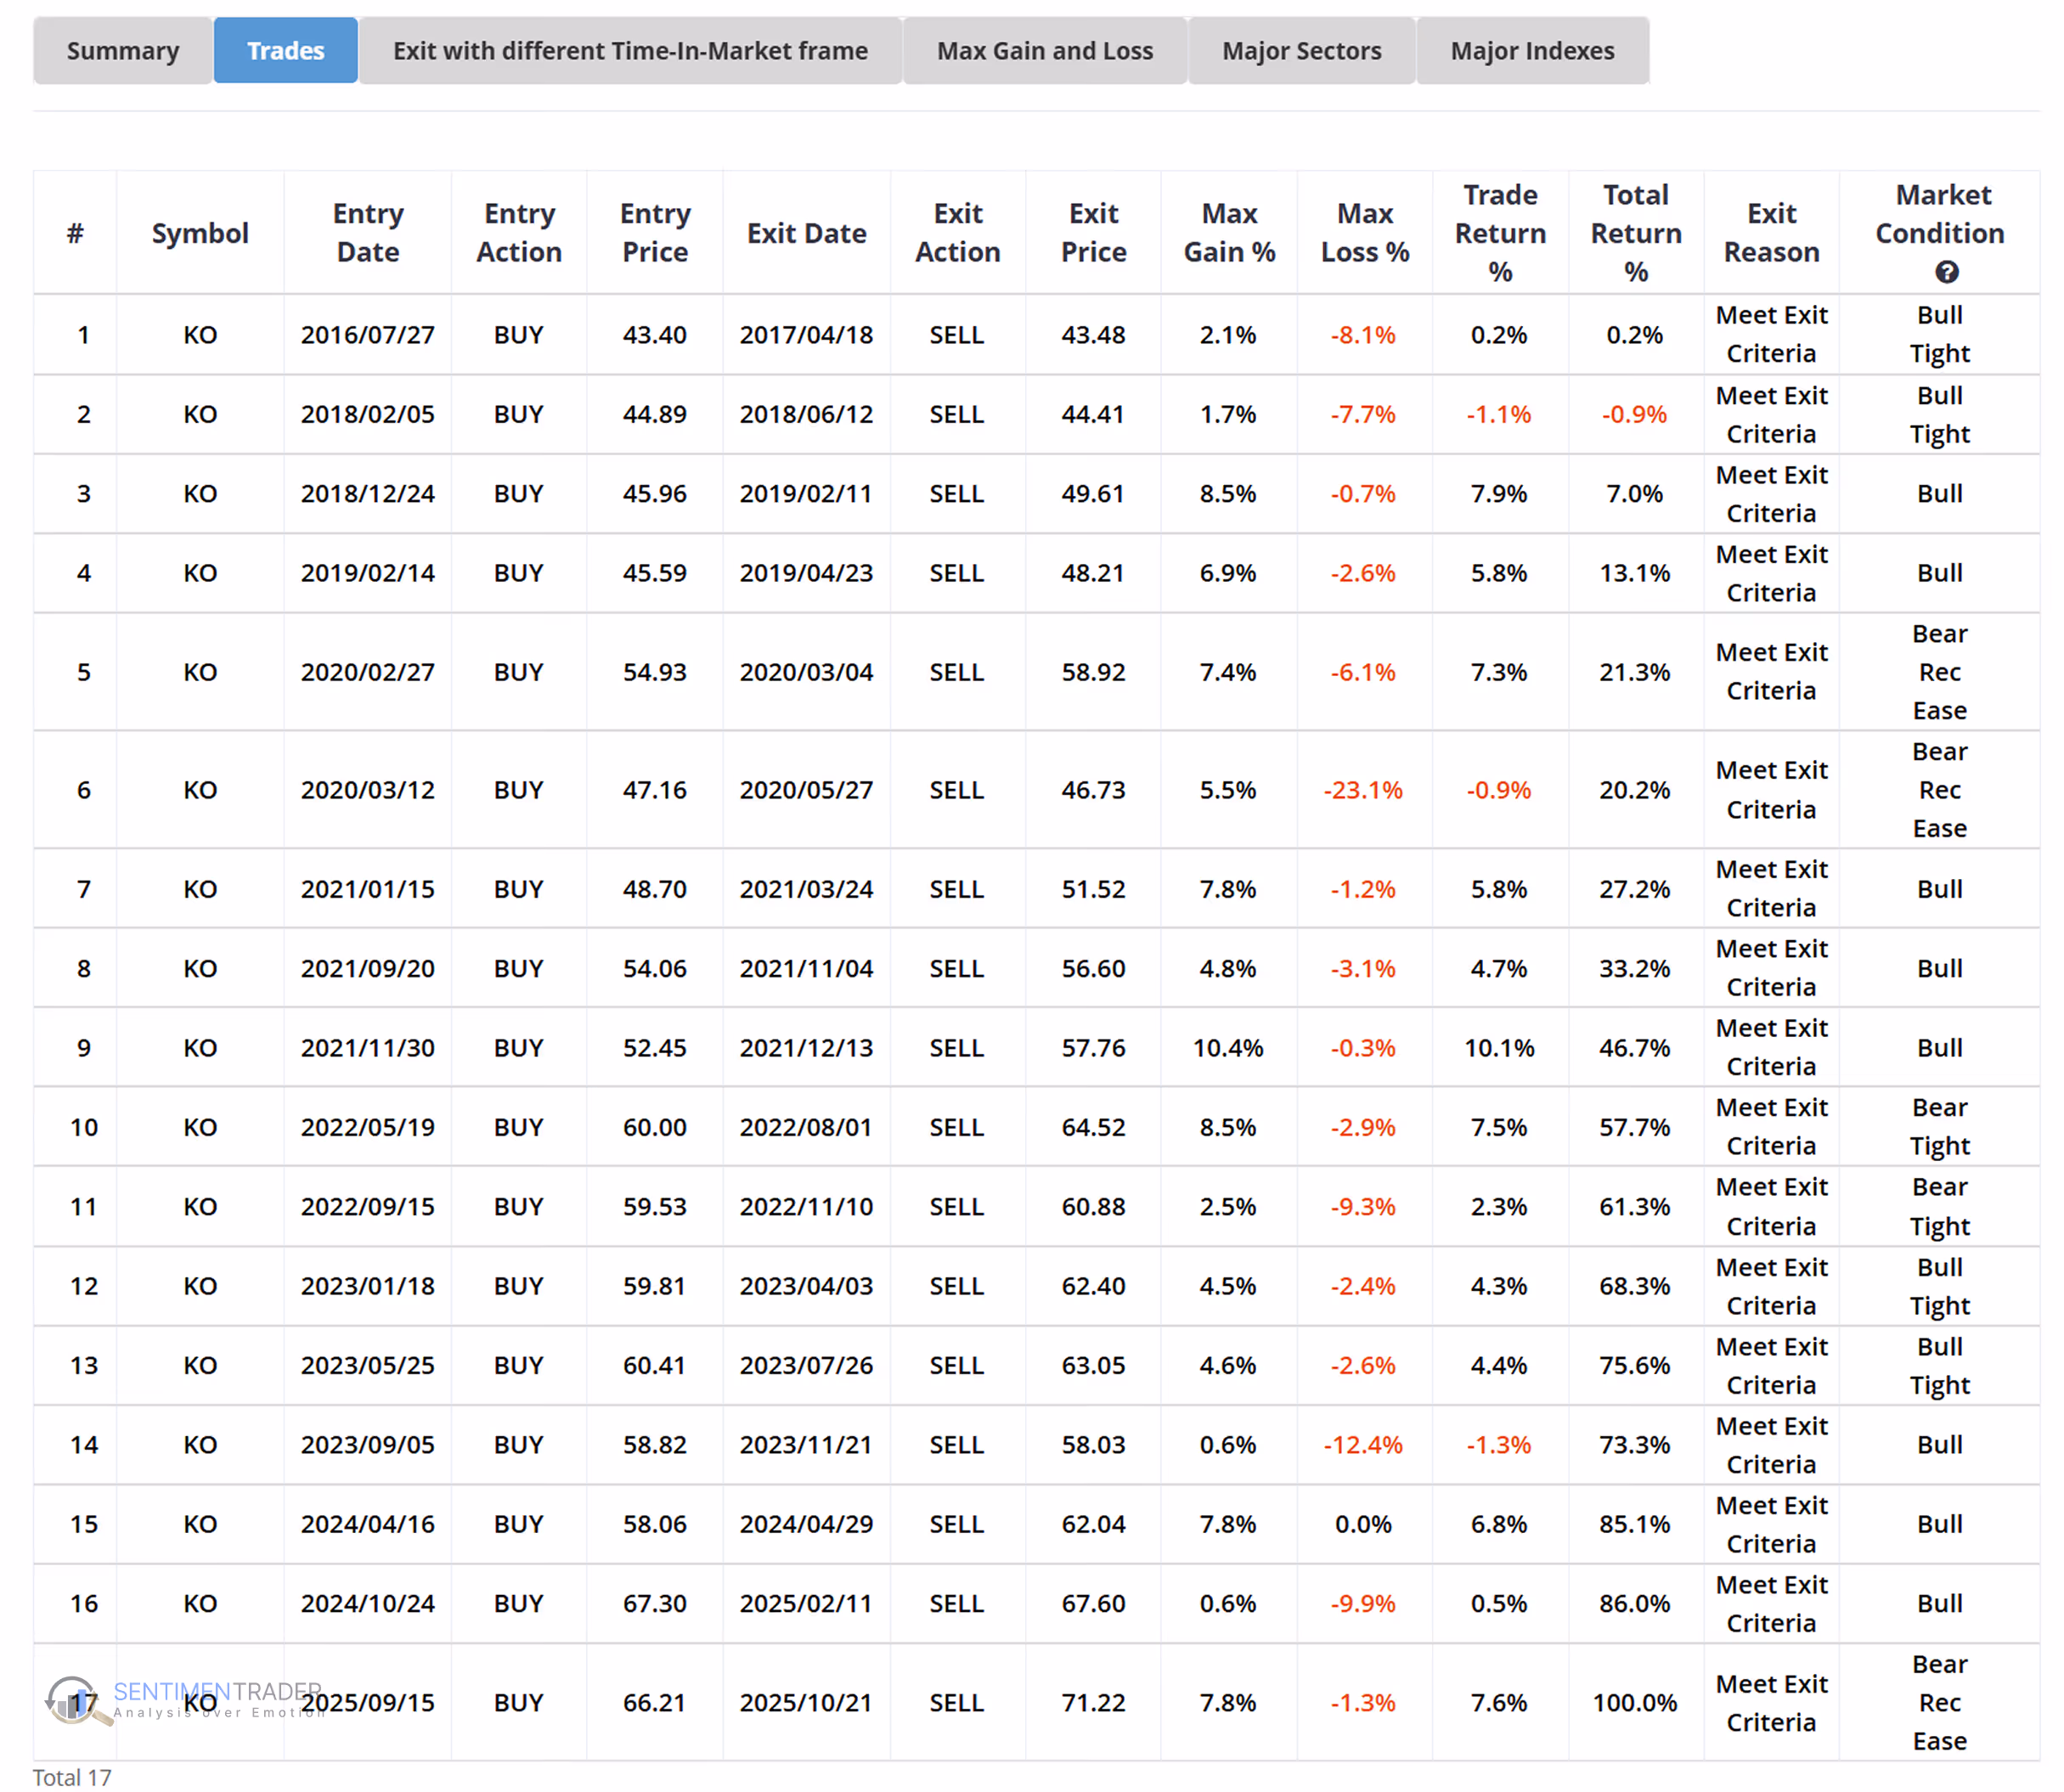
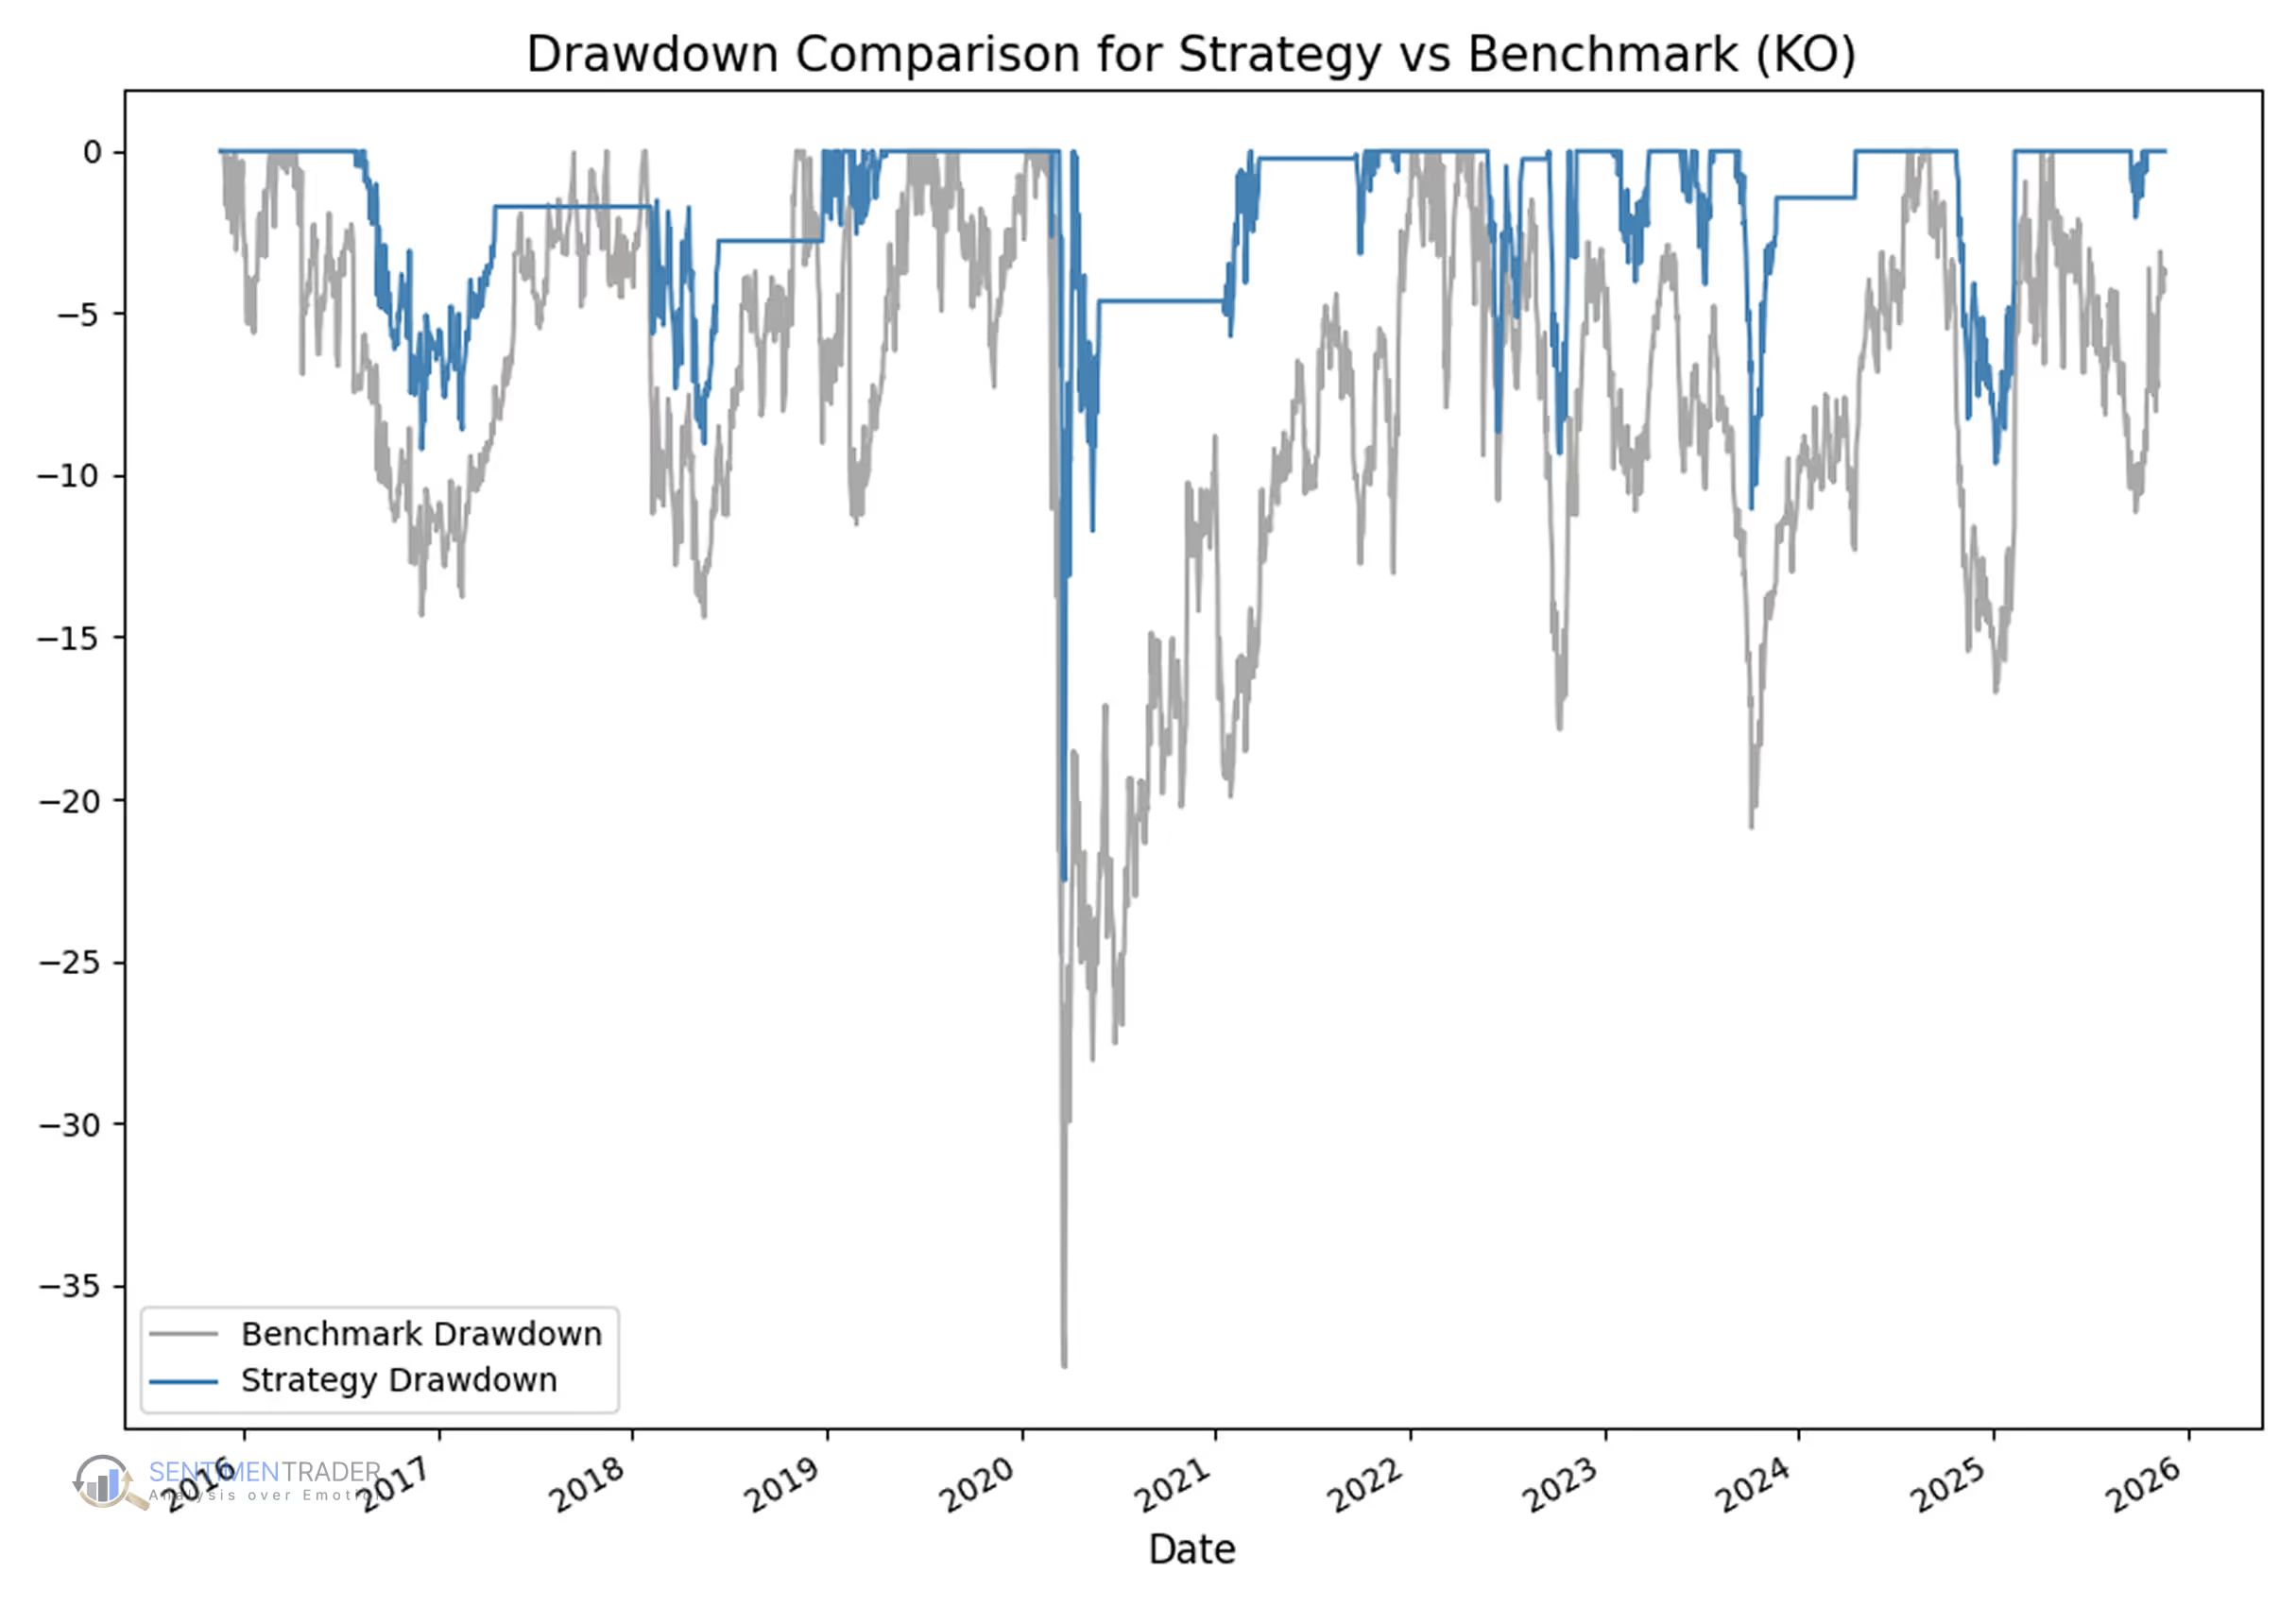
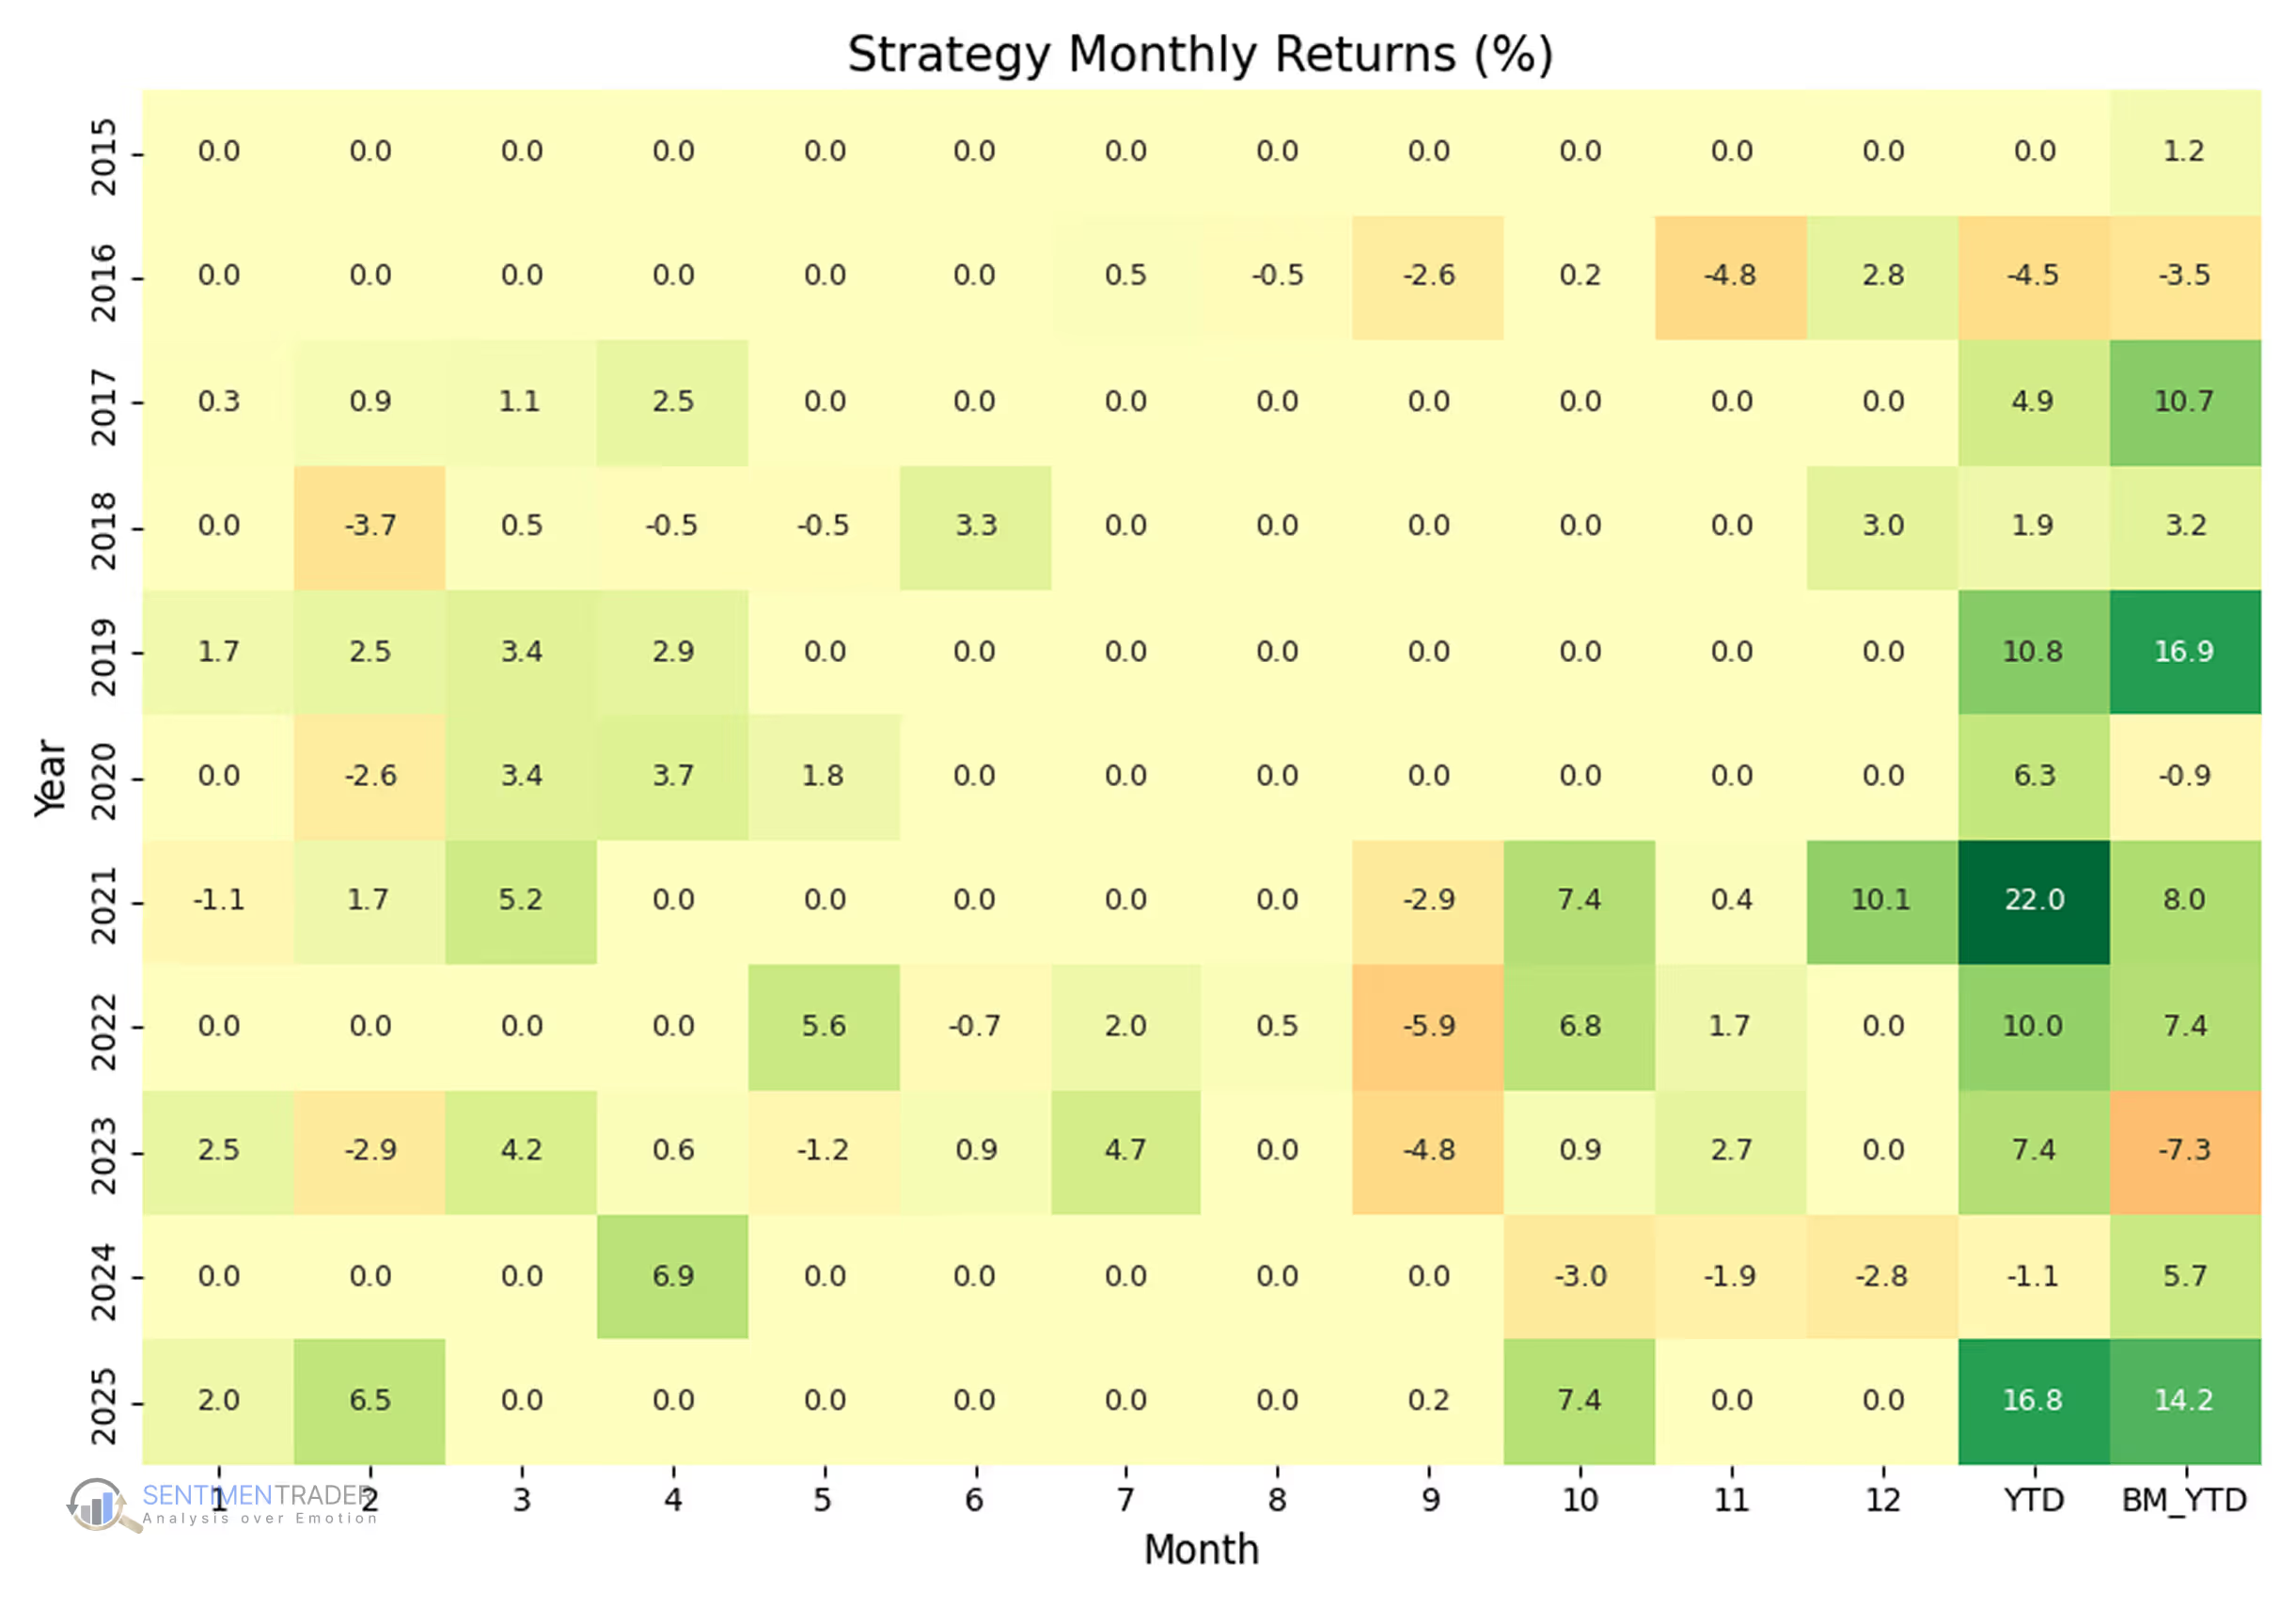
To see how well Moving Average Envelopes capture downside extremes and rebound behavior in practice, we ran a backtest on Coca-Cola (KO) from 2015 to 2025 using a simple envelope-based mean-reversion strategy.
Buy: When price closes below the lower Moving Average Envelope band and RSI falls below 33, signaling short-term oversold conditions.
Sell: When price crosses back above the upper Moving Average Envelope band.
Results over 10 years:
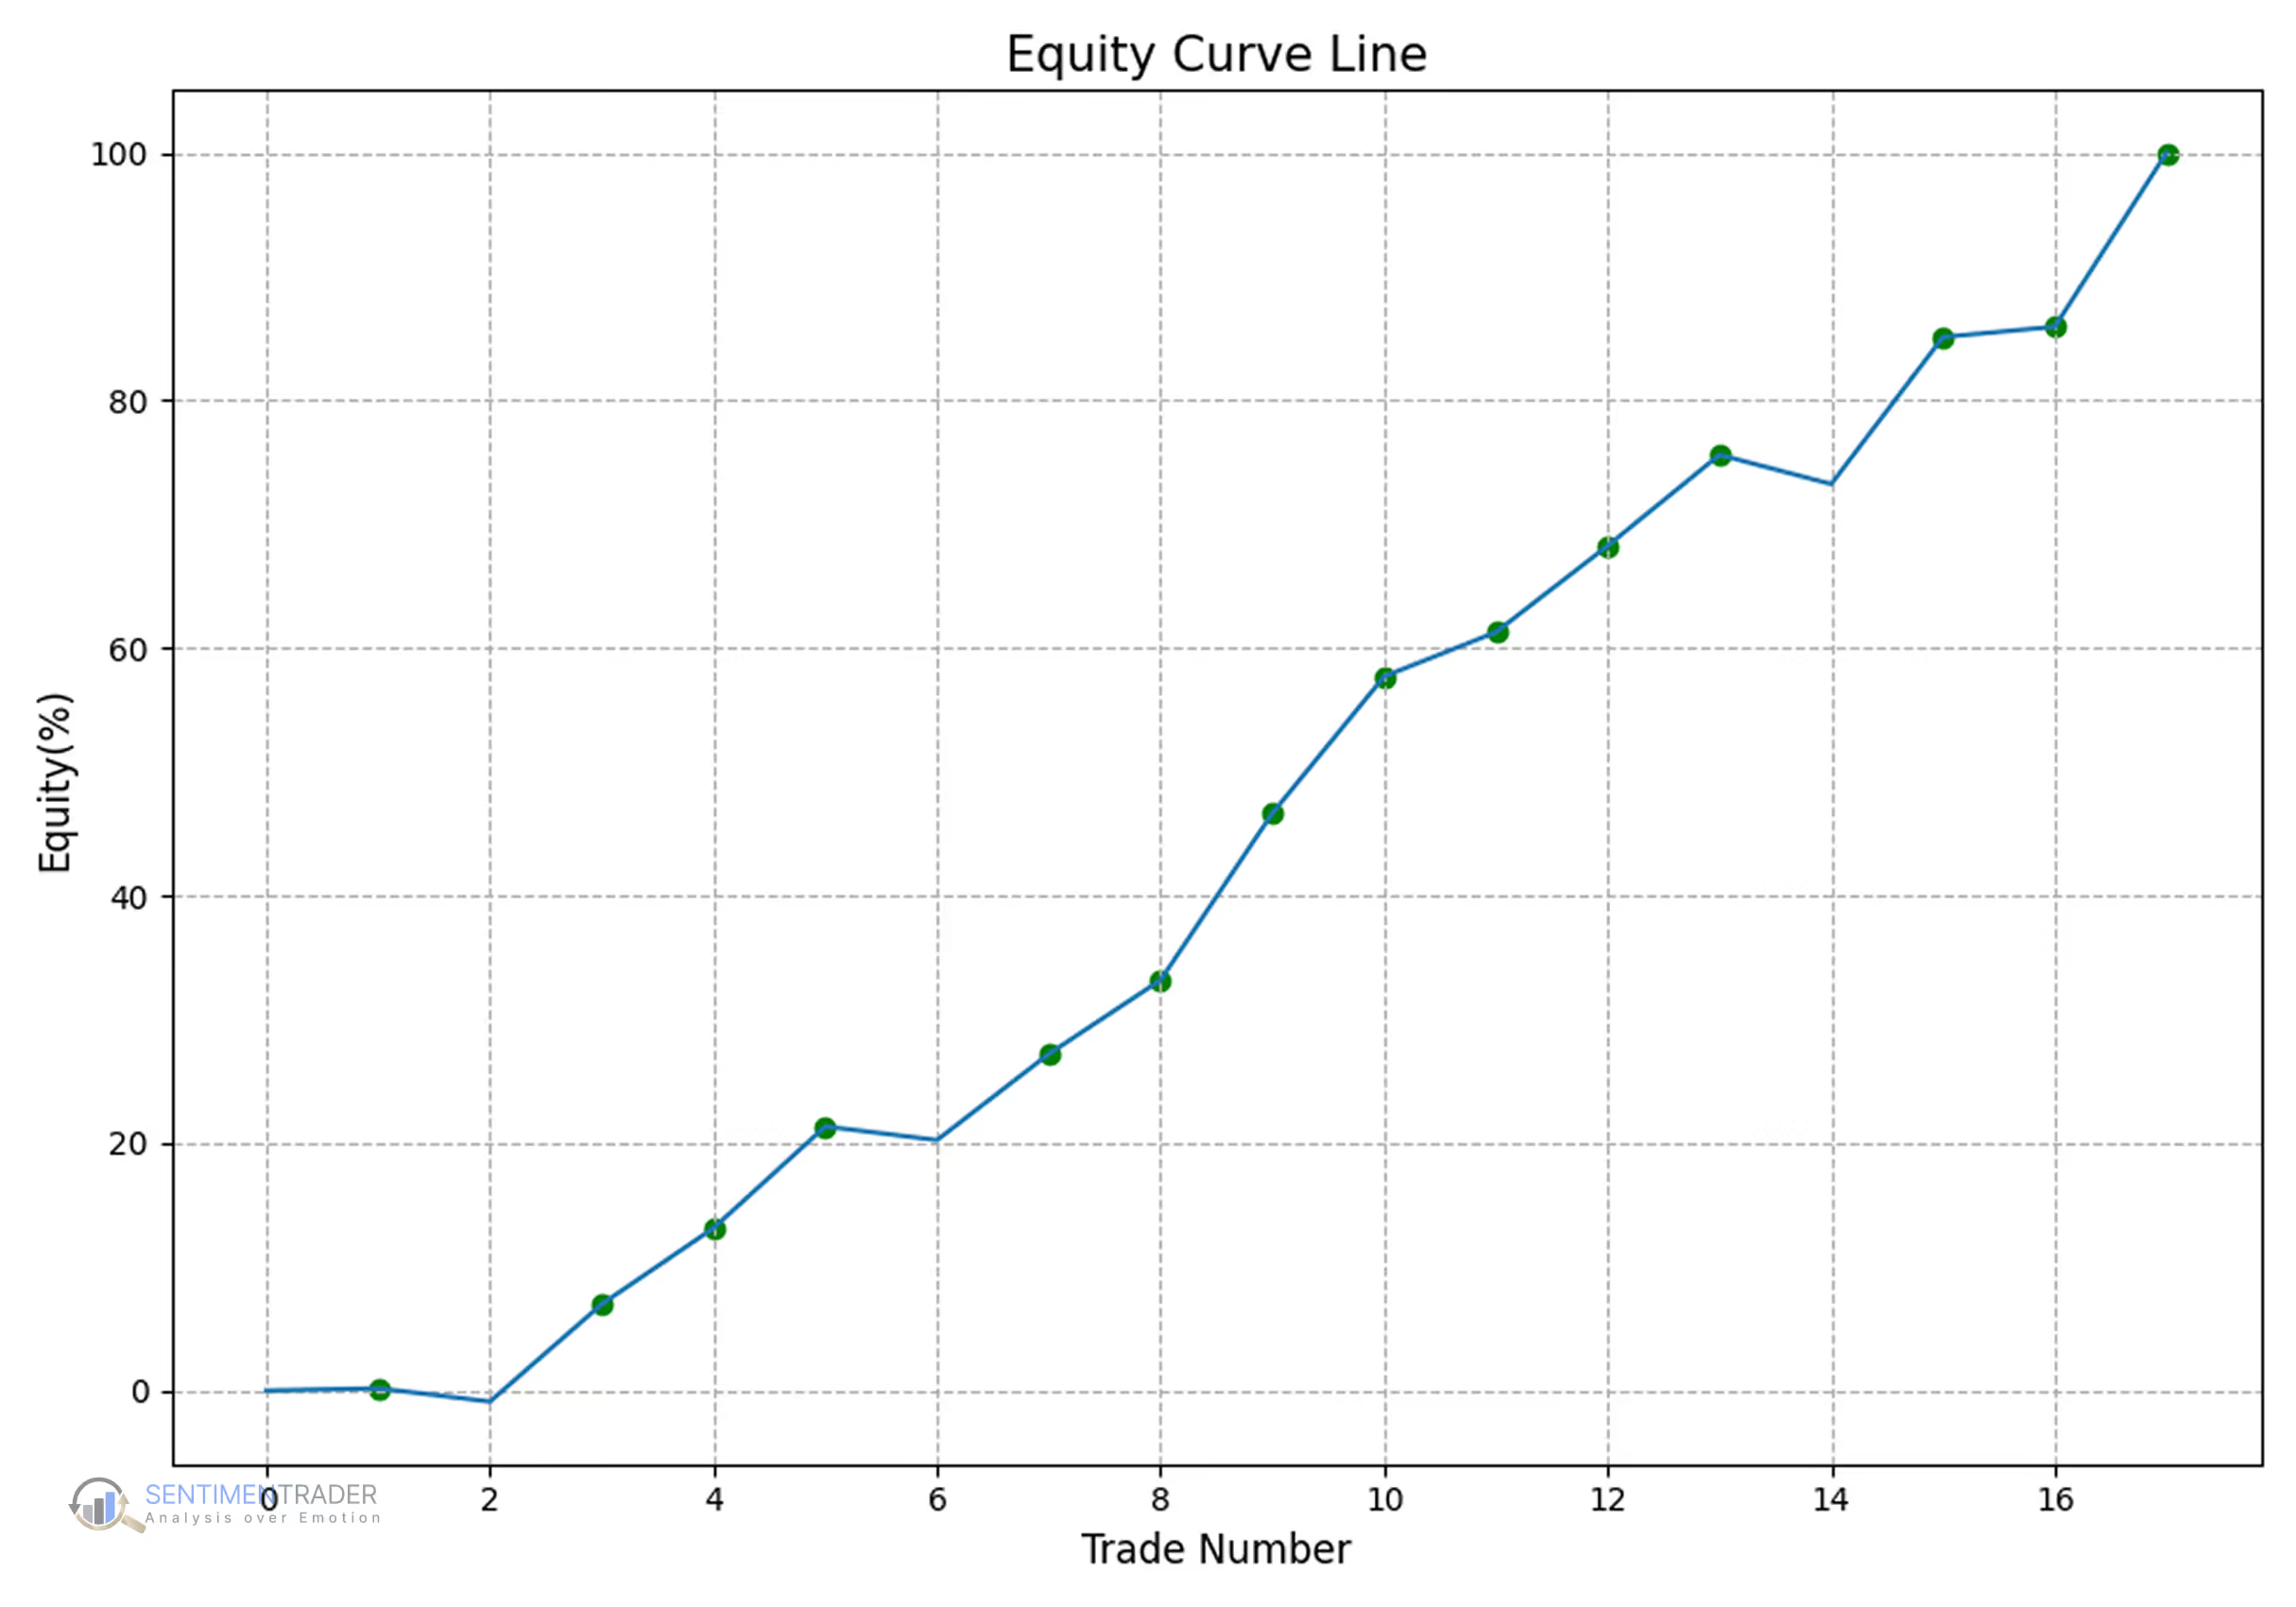
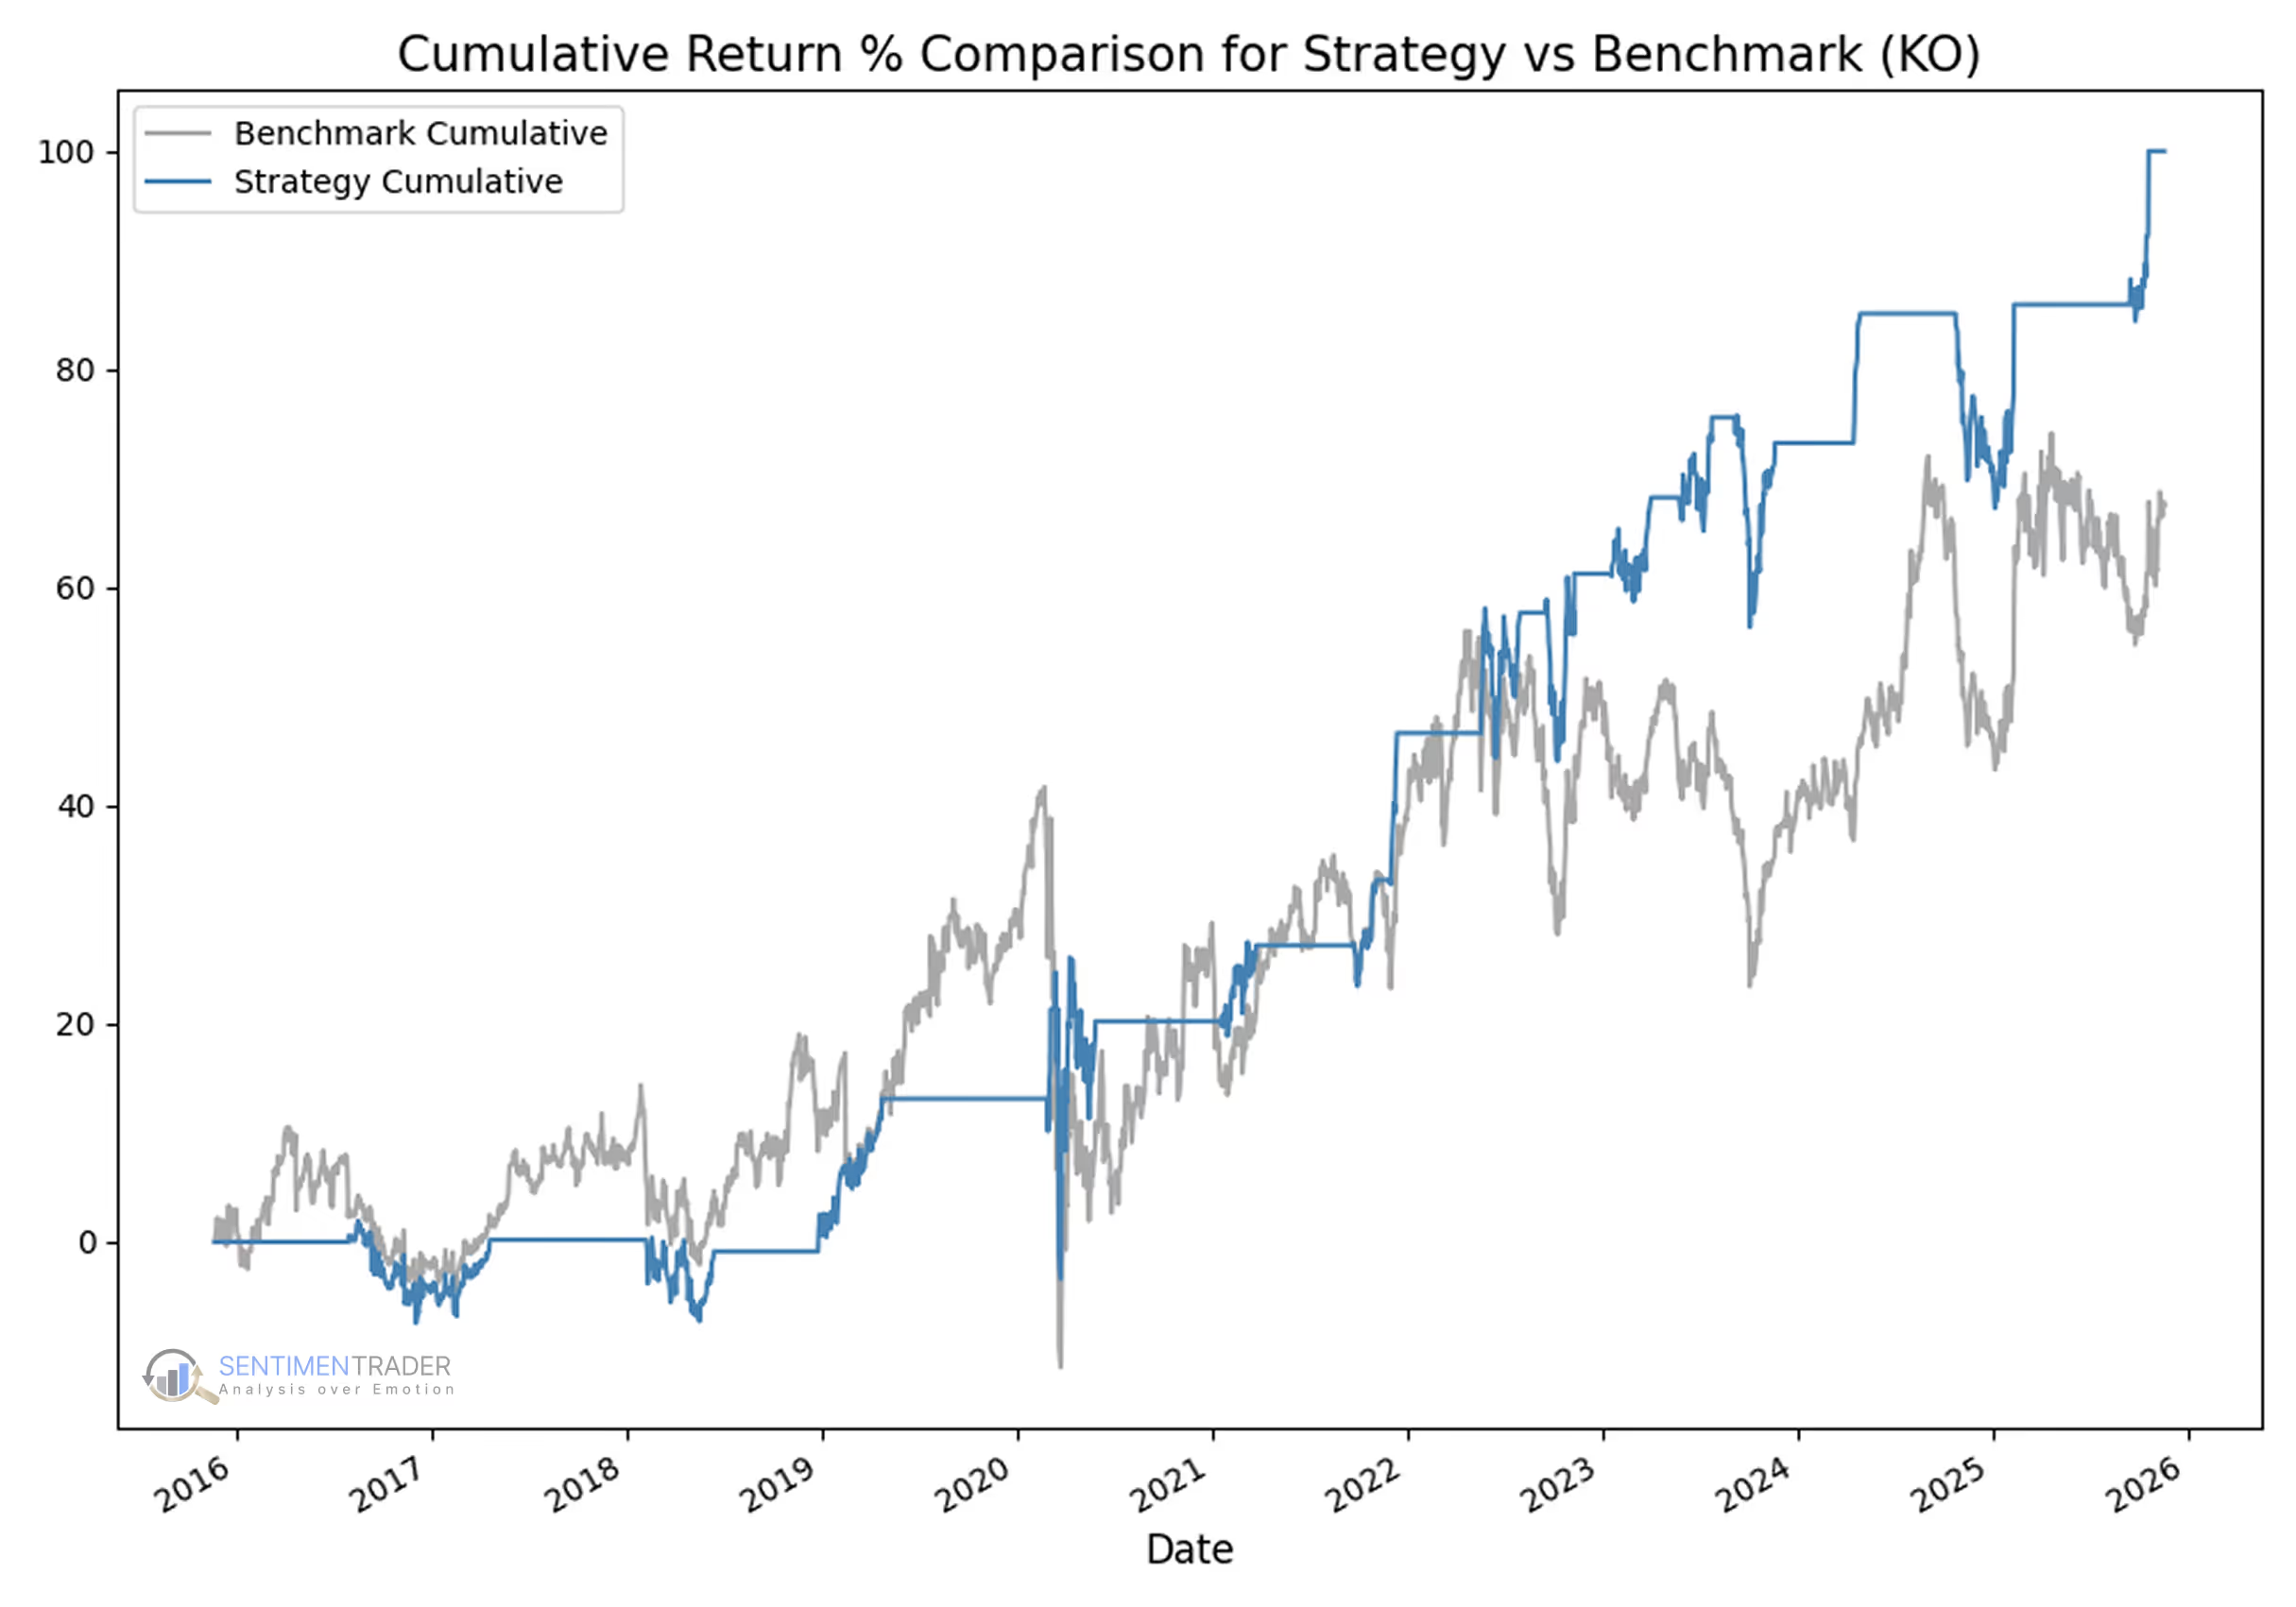
+100% total return (vs. +65% for buy-and-hold).
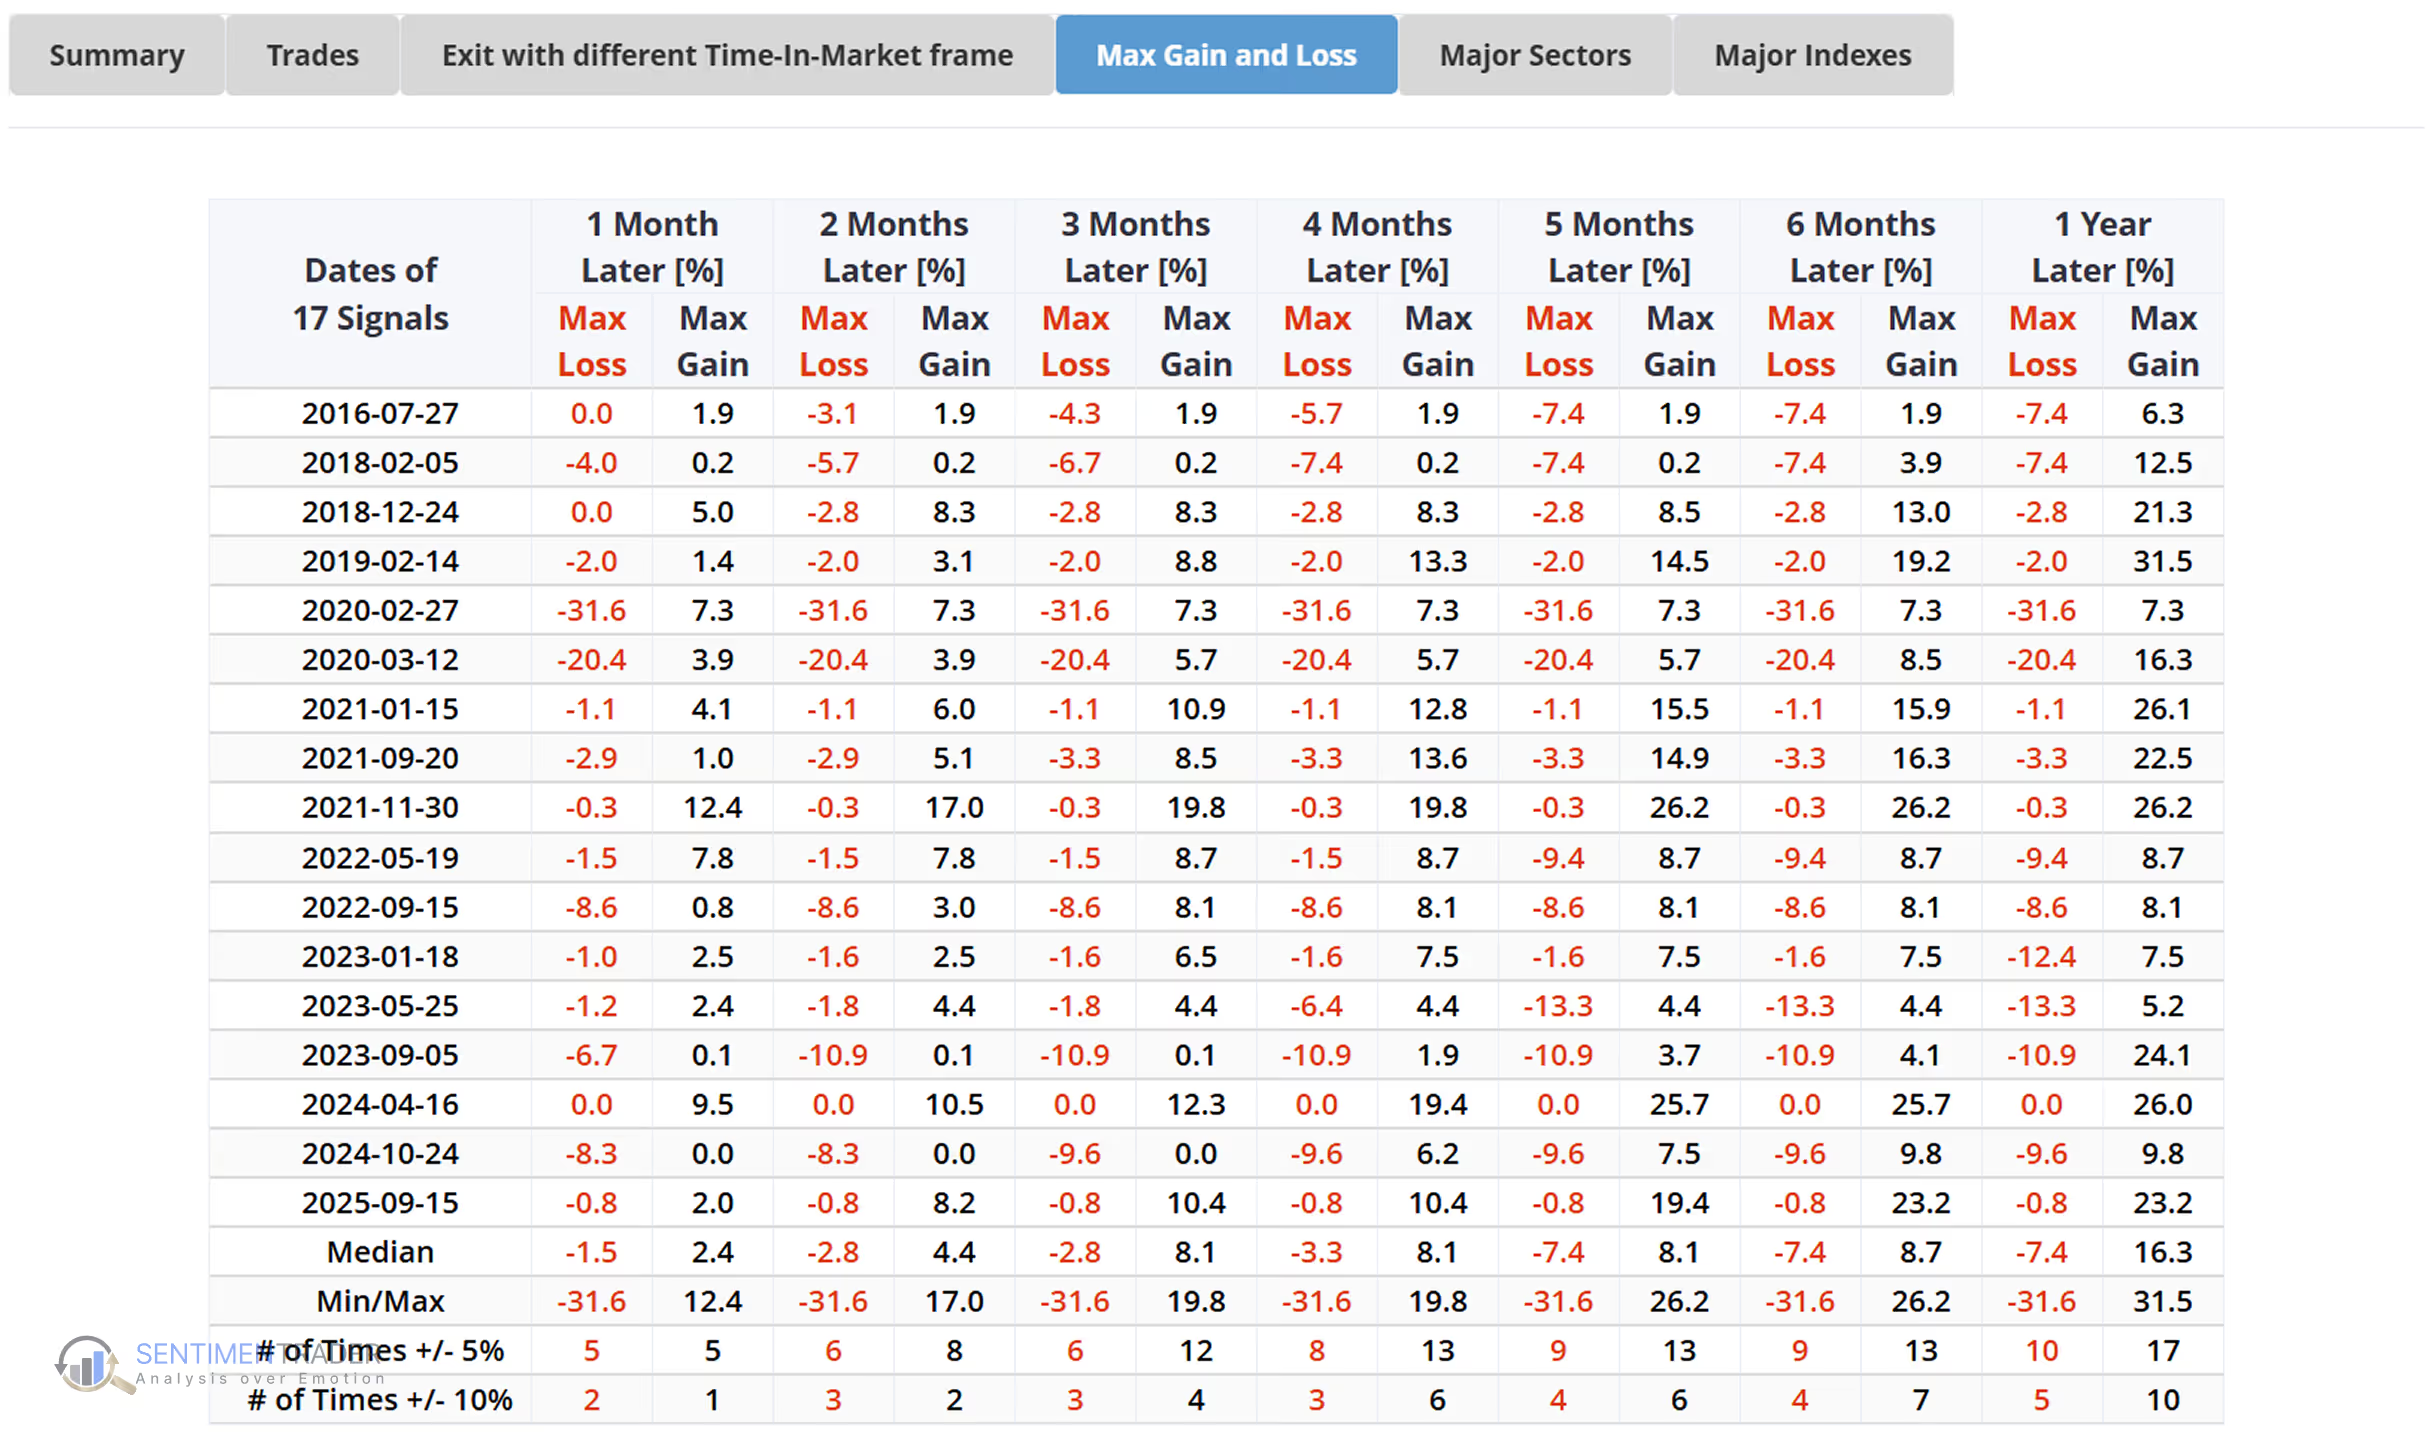
Smaller drawdowns: –22.5% max risk vs. deeper benchmark drawdowns during market stress.
High win rate: 82.3% across 17 total trades.
Selective exposure: In the market only 33.4% of the time, avoiding long periods of stagnation.
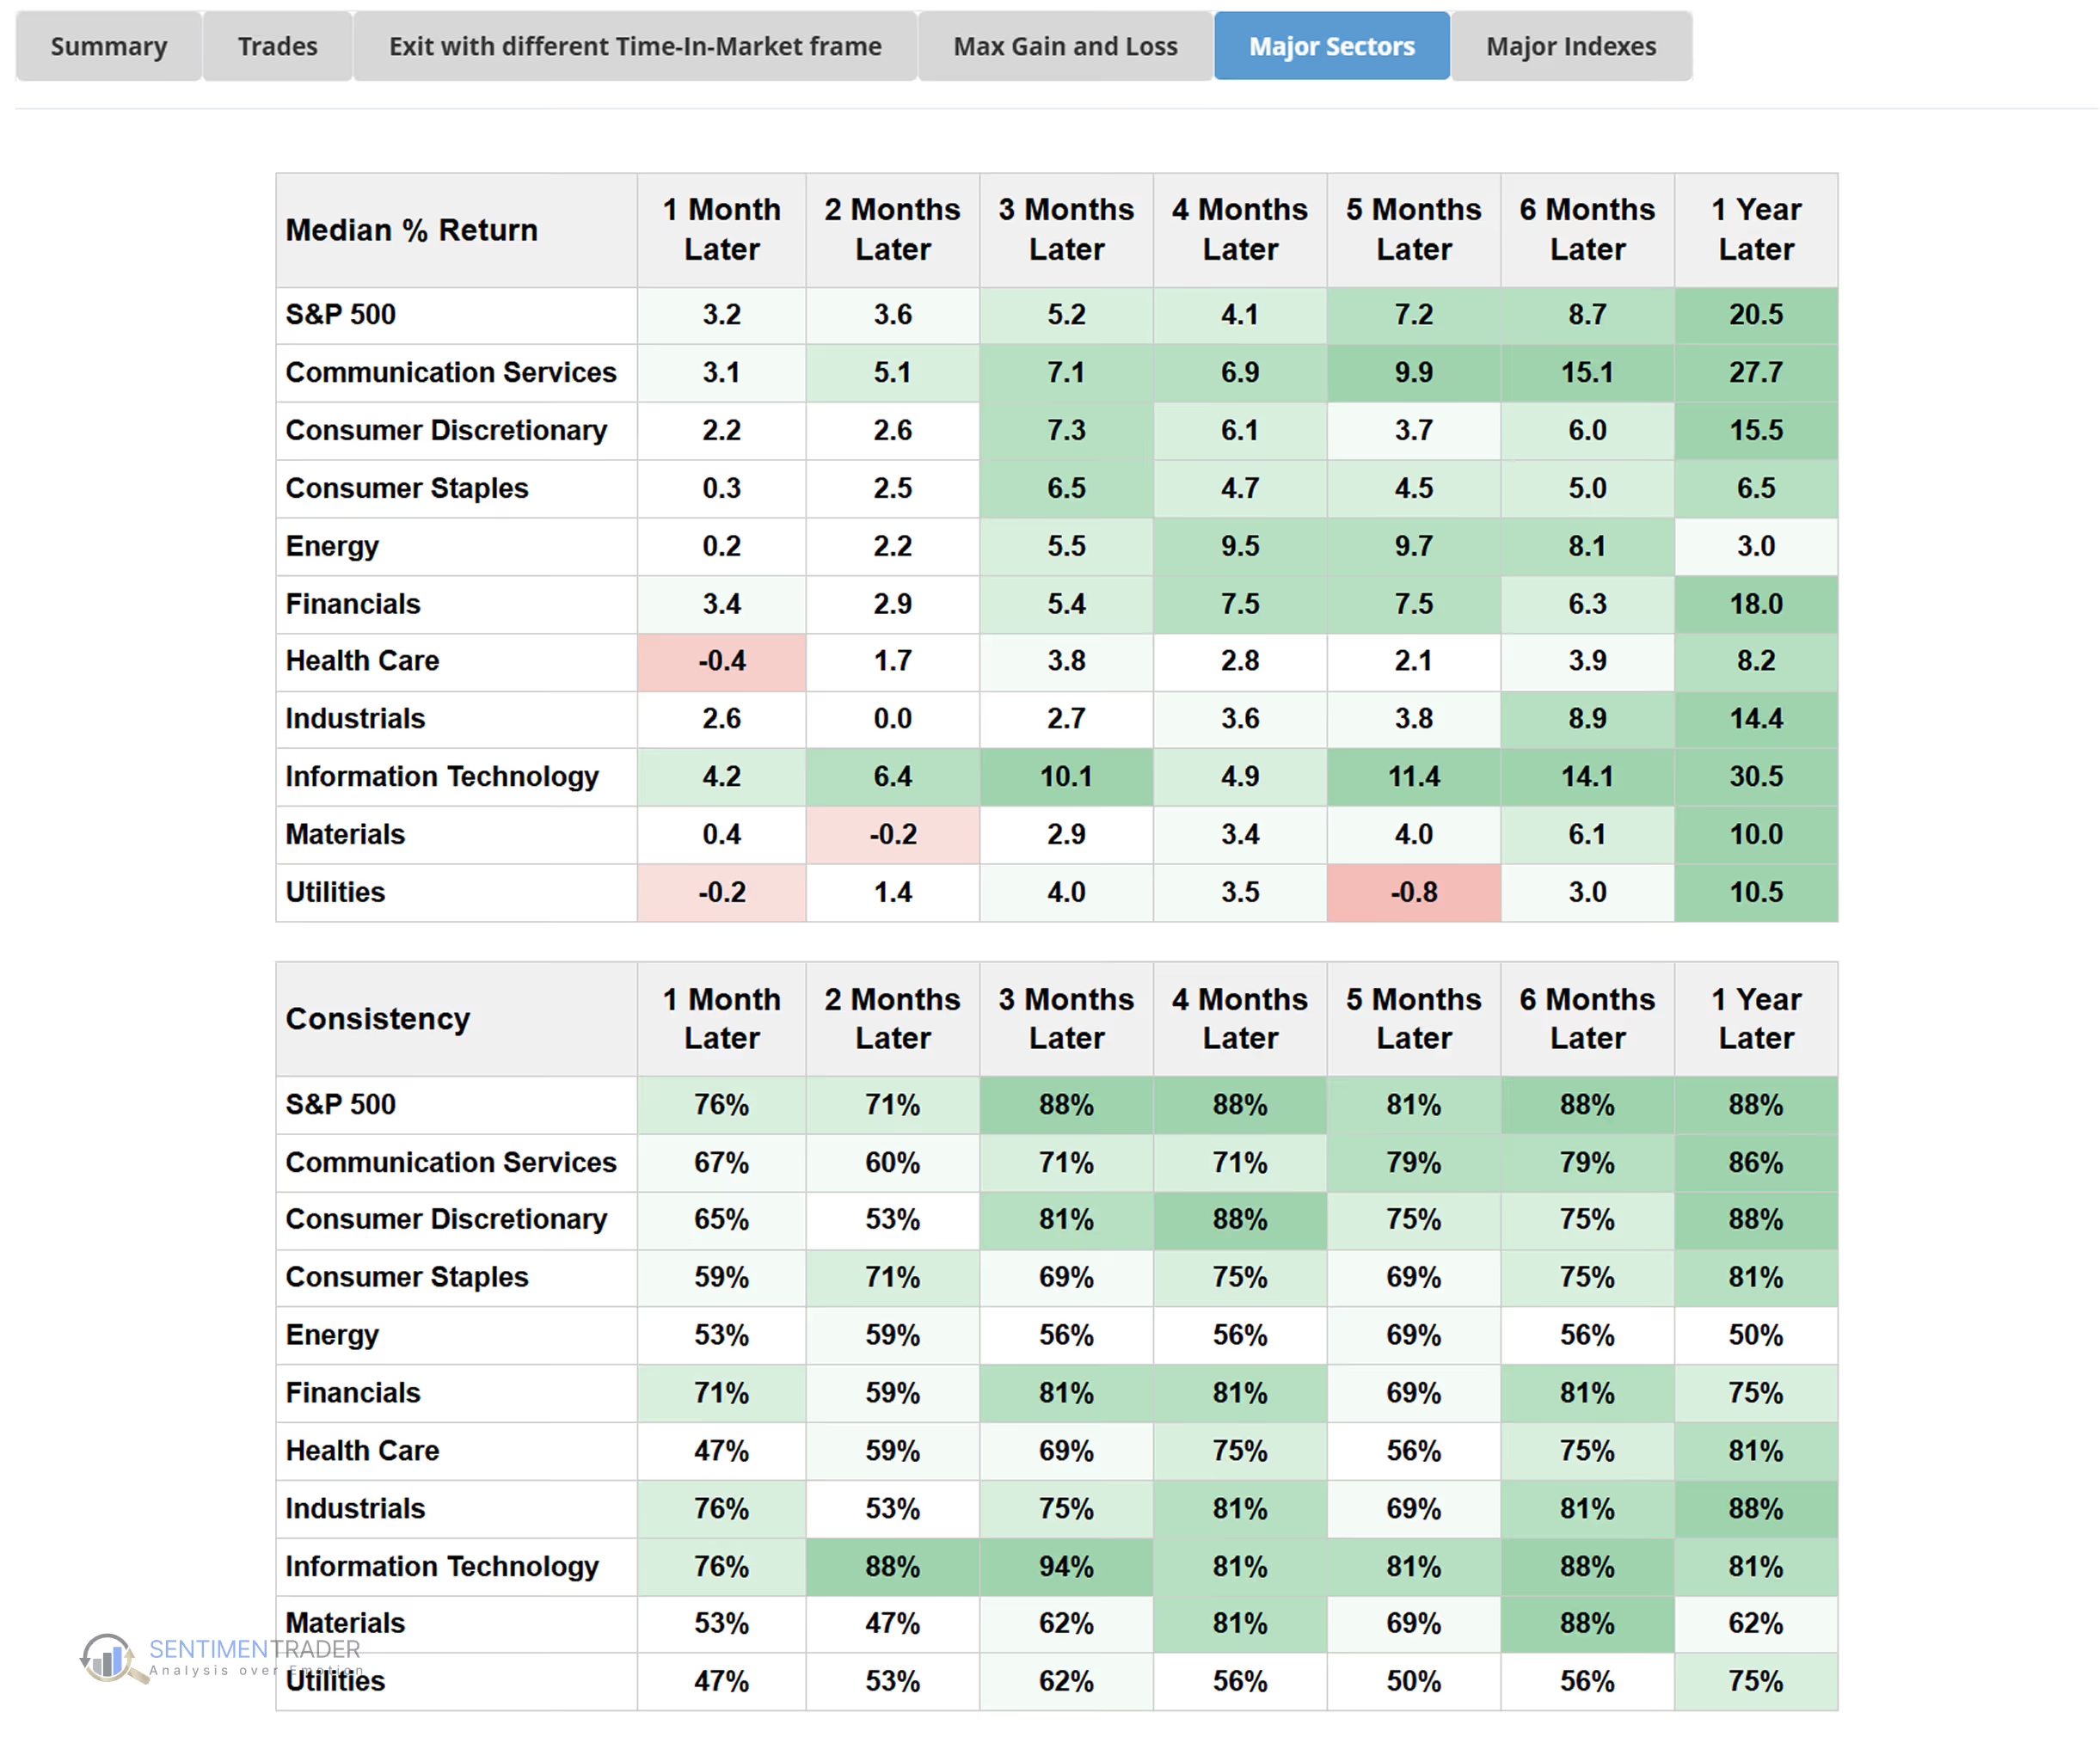
Longer follow-through: Median returns improved meaningfully beyond the 3–4 month mark after entry.
Takeaway: Even though Moving Average Envelopes don’t keep traders invested during every market phase, they have historically helped identify downside extremes where price tended to revert toward its average—making them effective as a mean-reversion and risk-filtering tool rather than a continuous trend signal.
This backtest was run using SentimenTrader’s Proprietary Backtest Engine, which lets you test your strategy with nearly 100 technical indicators and over 17,000 proprietary sentiment indicators—no coding required.
The Technical Bit
Calculation and components
A Moving Average Envelope consists of three lines:
Middle Line: A moving average (often SMA or EMA) of price over a chosen period.
Upper Envelope: Moving Average + (Moving Average × Percentage).
Lower Envelope: Moving Average – (Moving Average × Percentage).
Quick note on Moving Averages: A moving average smooths out price fluctuations to reveal the underlying trend. The Simple Moving Average (SMA) gives equal weight to each price, while the Exponential Moving Average (EMA) responds faster to recent changes. Example
If a stock’s 20-day moving average is $100 and the envelope percentage is set to 2%, then:
This forms a price channel between $98 and $102 around the average.
Settings
Common Defaults: Typically 20-day SMA with 2% bands above and below.
Shorter Periods / Smaller Percentages: More sensitive to price swings but generate more signals. For day trading or swing trading, a trader might use a 10-period EMA with a 1.5% envelope to catch smaller price swings.
Longer Periods / Wider Percentages: Smoother signals with less noise but delayed entries. A long-term investor might prefer a 50-period SMA with a wider 5% or 10% envelope to identify major market tops and bottoms.
What This Means for Traders
Moving Average Envelopes are trend indicators that help visualize when prices have moved too far from their trend. This makes them useful for maintaining discipline and defining entry or exit zones without chasing short-term moves.
Still, MA Envelopes can produce false signals when markets move sideways or when volatility changes suddenly. That’s why many traders combine them with tools from other categories—for example, RSI (Momentum) to confirm overbought or oversold readings, On-Balance Volume (Volume) to verify participation strength, or Bollinger Bands (Volatility) to compare fixed vs. adaptive bands.
When used together, these tools offer a more balanced view of trend behavior and potential price extremes.


.avif)