Why the Dumb Money Confidence Matters
While institutional sentiment often leads, retail and trend-following sentiment tends to lag — confirming trends after they’ve already matured. The Dumb Money Confidence indicator captures this reactive behavior, revealing when enthusiasm or panic may have reached extremes.
Clarity: Quantifies crowd conviction using real-money measures rather than surveys.
Context: Reflects how trend-following traders typically buy near peaks and sell near troughs.
Insight: Highlights emotional excesses that can foreshadow cooling periods or rebound setups.
How Traders Use the Dumb Money Confidence
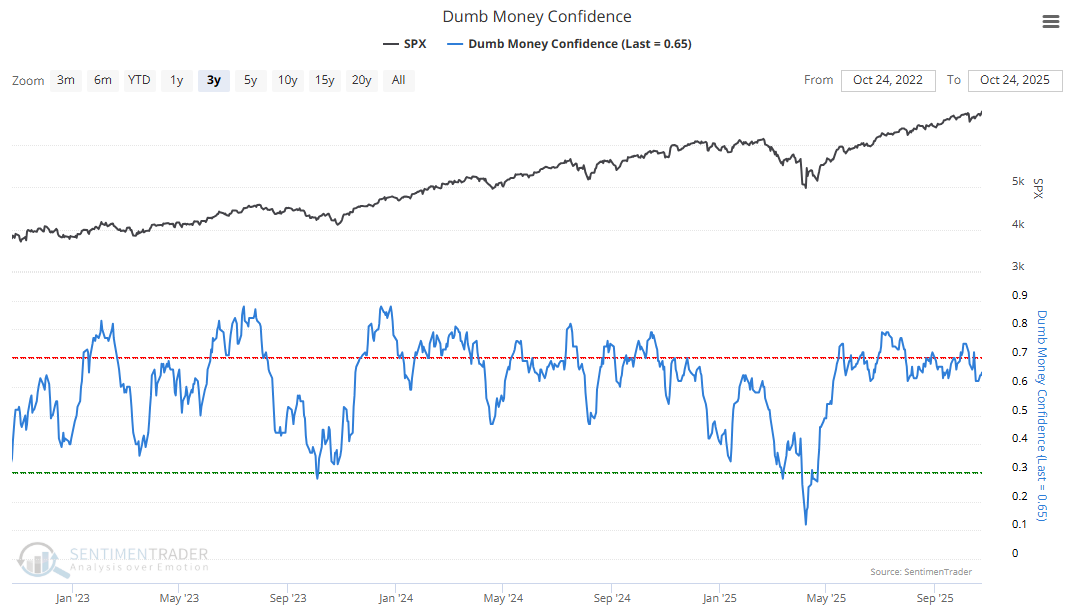
High Confidence (Above 70%) – Indicates broad optimism. Historically, such readings have coincided with slower forward returns, as excessive enthusiasm often marks late-stage rallies.
Low Confidence (Below 30%) – Reflects fear and capitulation. These zones have historically preceded strong recoveries.
Neutral Range (30–70%) – Suggests a balanced market mood where price trends can continue without emotional extremes.
Behavioral Tendency: Dumb Money Confidence usually rises during rallies and fades during declines — the mirror image of Smart Money Confidence. When Dumb Money exceeds Smart Money, sentiment is typically positive but vulnerable to reversal.
Smart Money / Dumb Money Confidence Spread: Traders often pair Smart Money Confidence with its counterpart, Dumb Money Confidence. The difference between the two, known as the Smart Money / Dumb Money Confidence Spread, offers a clearer view of how institutional sentiment diverges from retail emotion. A widening spread often signals an approaching turning point as professional investors position against the crowd.
The Technical Bit
Calculation and components
Dumb Money Confidence aggregates more than a dozen sentiment indicators representing trend-following and crowd behavior. These components capture how the average investor reacts to established trends, becoming most confident near peaks and least confident near troughs.
Key components include:
Equity-Only Put/Call Ratio – Tracks speculative activity in options markets.
Rydex Mutual Fund Flows – Measures money flowing into and out of index-based mutual funds.
Small Speculator Positions in Equity Index Futures – Reflects the trading stance of smaller, trend-following investors.
Each component is standardized and blended into a 0–100% confidence scale:
Values typically oscillate between 30–70%, with meaningful shifts occurring when confidence moves beyond these bounds.
What This Means for Traders
Dumb Money Confidence provides a behavioral snapshot of how the crowd feels at any moment — exuberant after rallies, fearful after declines. Recognizing these extremes helps traders understand when emotion, not fundamentals, dominates price action.
Because crowd sentiment can remain stretched for extended periods, this indicator works best when paired with trend or momentum measures to confirm whether price action aligns or diverges from prevailing optimism or pessimism.
This is a proprietary SentimenTrader sentiment indicator, updated daily and available exclusively to subscribers. It can also be tested through the SentimenTrader’s Proprietary Backtest Engine to quantify how retail sentiment extremes have historically influenced market outcomes.