Why Chaikin Volatility Matter
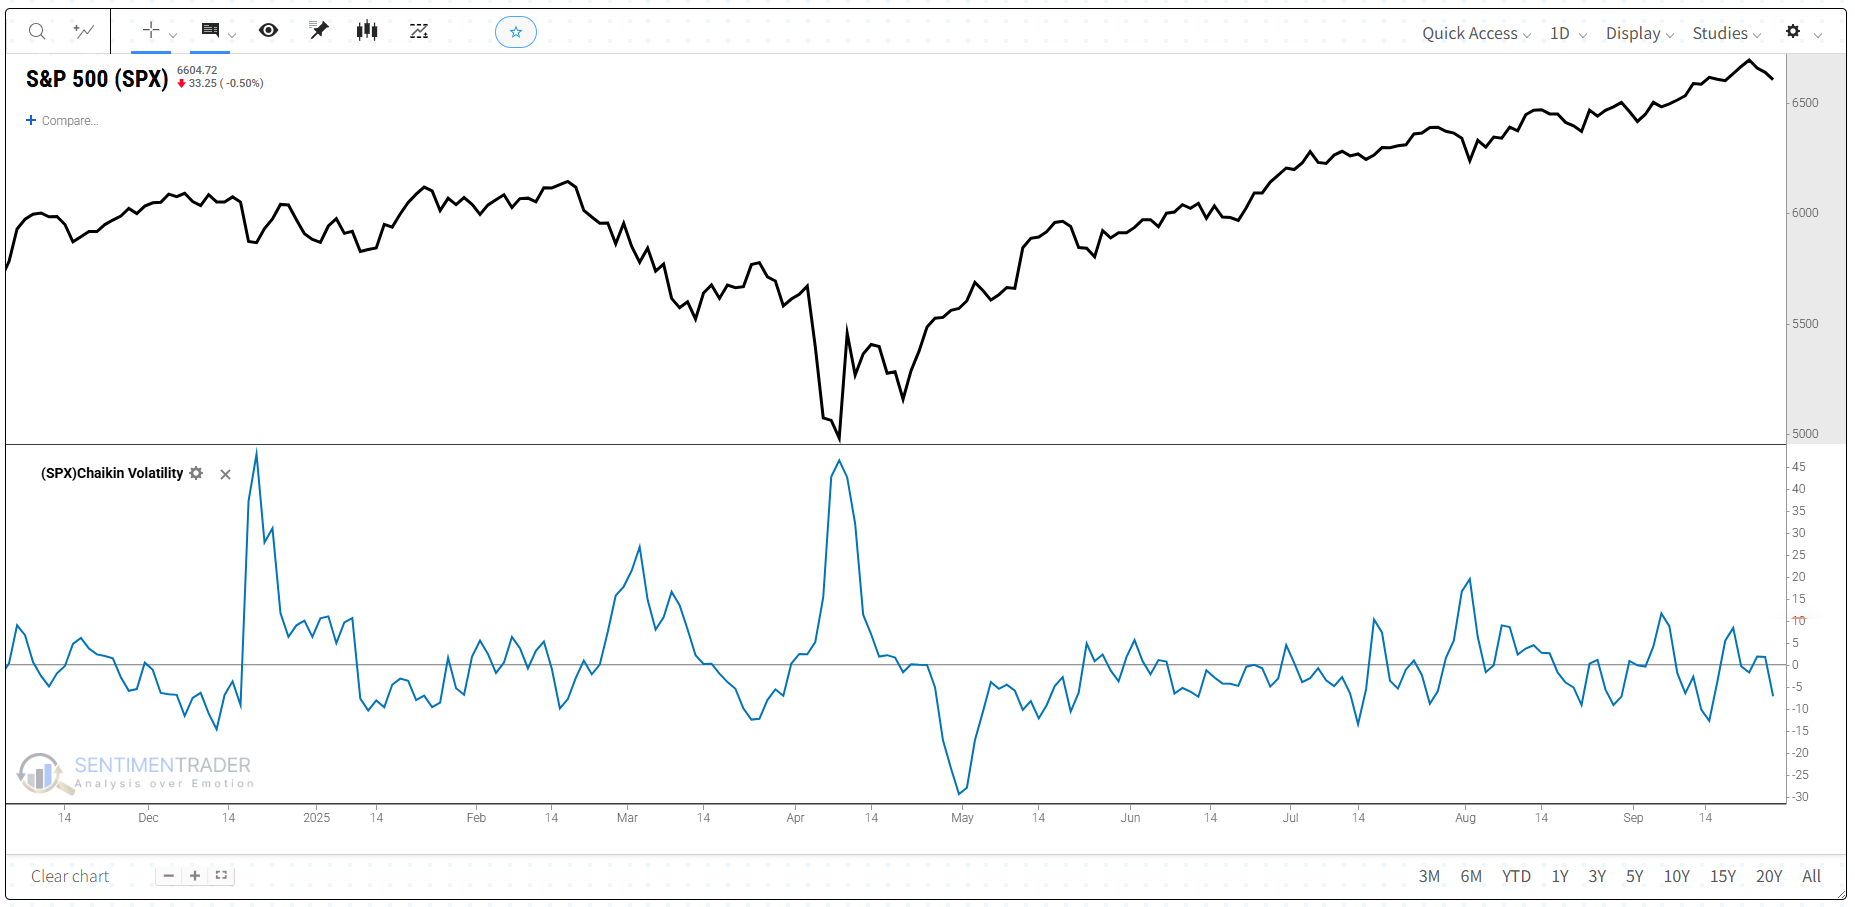
Chaikin Volatility captures these shifts by measuring the changing distance between daily highs and lows.
Clarity: Highlights when markets are unusually quiet or unusually emotional.
Context: Helps spot maturing trends, potential reversals, and panic-driven bottoms.
Flexibility: Useful across different timeframes for gauging market sentiment and risk conditions.
How Traders Use Chaikin Volatility
Identifying Market Tops: Rising volatility over short periods can point to indecision at peaks; falling volatility over long stretches may signal a complacent, late-stage bull trend.
Spotting Market Bottoms: Extended low volatility often reflects boredom near bottoms, while sudden spikes may reveal panic-driven sell-offs.
Entry and Exit Signals: Traders sometimes enter when volatility expands from low levels, or exit when volatility contracts after extended highs.
Risk Management: By monitoring volatility conditions, traders adjust stop-loss orders and position sizes to match expected price swings.
Real-World Results: Do They Actually Work?
To see how well Chaikin Volatility highlights meaningful volatility regimes in practice, we ran a backtest on NVIDIA (NVDA) from 2005 to 2025 using a simple volatility-and-trend-based approach.
Buy: When Chaikin Volatility is above 0, signaling expanding price ranges, and price is trading above its 50-day simple moving average, confirming a positive trend environment.
Sell: When Chaikin Volatility rises above 35, signaling unusually elevated volatility, or when the 50-day moving average crosses below the 200-day moving average, indicating longer-term trend deterioration.
Results over 20 years:
+96,039.7% total return (vs. +62,073.3% for buy-and-hold).
41.1% CAGR, reflecting strong long-term compounding during sustained bull phases.
68.4% win rate, with gains driven by a small number of outsized winners
Takeaway: Even though Chaikin Volatility does not time exact tops or bottoms, this backtest suggests it can be useful when combined with moving averages to help traders remain aligned with favorable trend conditions and exit when volatility becomes elevated or broader trend signals weaken.
This backtest was run using SentimenTrader’s Proprietary Backtest Engine, which lets you test your strategy with nearly 100 technical indicators and over 17,000 proprietary sentiment indicators—no coding required.
The Technical Bit
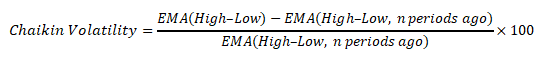
The Chaikin Volatility formula is:
Where
High–Low = The daily difference between a security’s high and low price.
EMA(High–Low) = An Exponential Moving Average of the high–low range, usually over 10 periods.
n periods ago = The lookback window for calculating the rate of change, commonly 10 periods.
Result = A percentage value showing how much volatility has expanded or contracted over that window.
Quick note on EMA:
An Exponential Moving Average (EMA) is a type of moving average that gives more weight to recent prices, so it responds faster to changes than a simple average. In Chaikin Volatility, the EMA helps smooth the daily high–low ranges while still reacting quickly to shifts in volatility. What This Means for Traders
Chaikin Volatility helps traders understand whether markets are becoming more anxious or more complacent. It provides a clearer framework for adjusting strategies to match changing volatility.
Still, the indicator can give false signals if used alone—periods of high volatility don’t always result in reversals, and low volatility can persist longer than expected. That’s why traders often pair it with tools from other categories, such as Moving Averages (Trend) to confirm direction, RSI (Momentum) to check strength, or On-Balance Volume (Volume) to validate participation.
Together, these tools give a more complete picture of when volatility matters most.


.avif)