Why Moving Averages Matter
Markets are noisy—prices jump up and down every day. A Moving Average (MA) cuts through that noise and gives traders a cleaner picture of where the market has been heading.
This is why they’re one of the most widely used indicators in technical analysis:
Clarity: They make it easier to spot the underlying trend.
Simplicity: They provide a consistent framework for analysis.
Flexibility: Useful across timeframes, from day traders to long-term investors.
How Traders Use Moving Averages
Short-term MAs (20-day): Catch near-term swings, respond quickly.
Long-term MAs (200-day): Confirm the big trend, filter out noise.
Crossover signals: Golden Cross (50-day rising above 200-day) = potential strength; Death Cross (50-day falling below 200-day) = potential weakness.
Dynamic support/resistance: Prices often bounce off MAs in strong trends.
Real-World Results: Do They Actually Work?
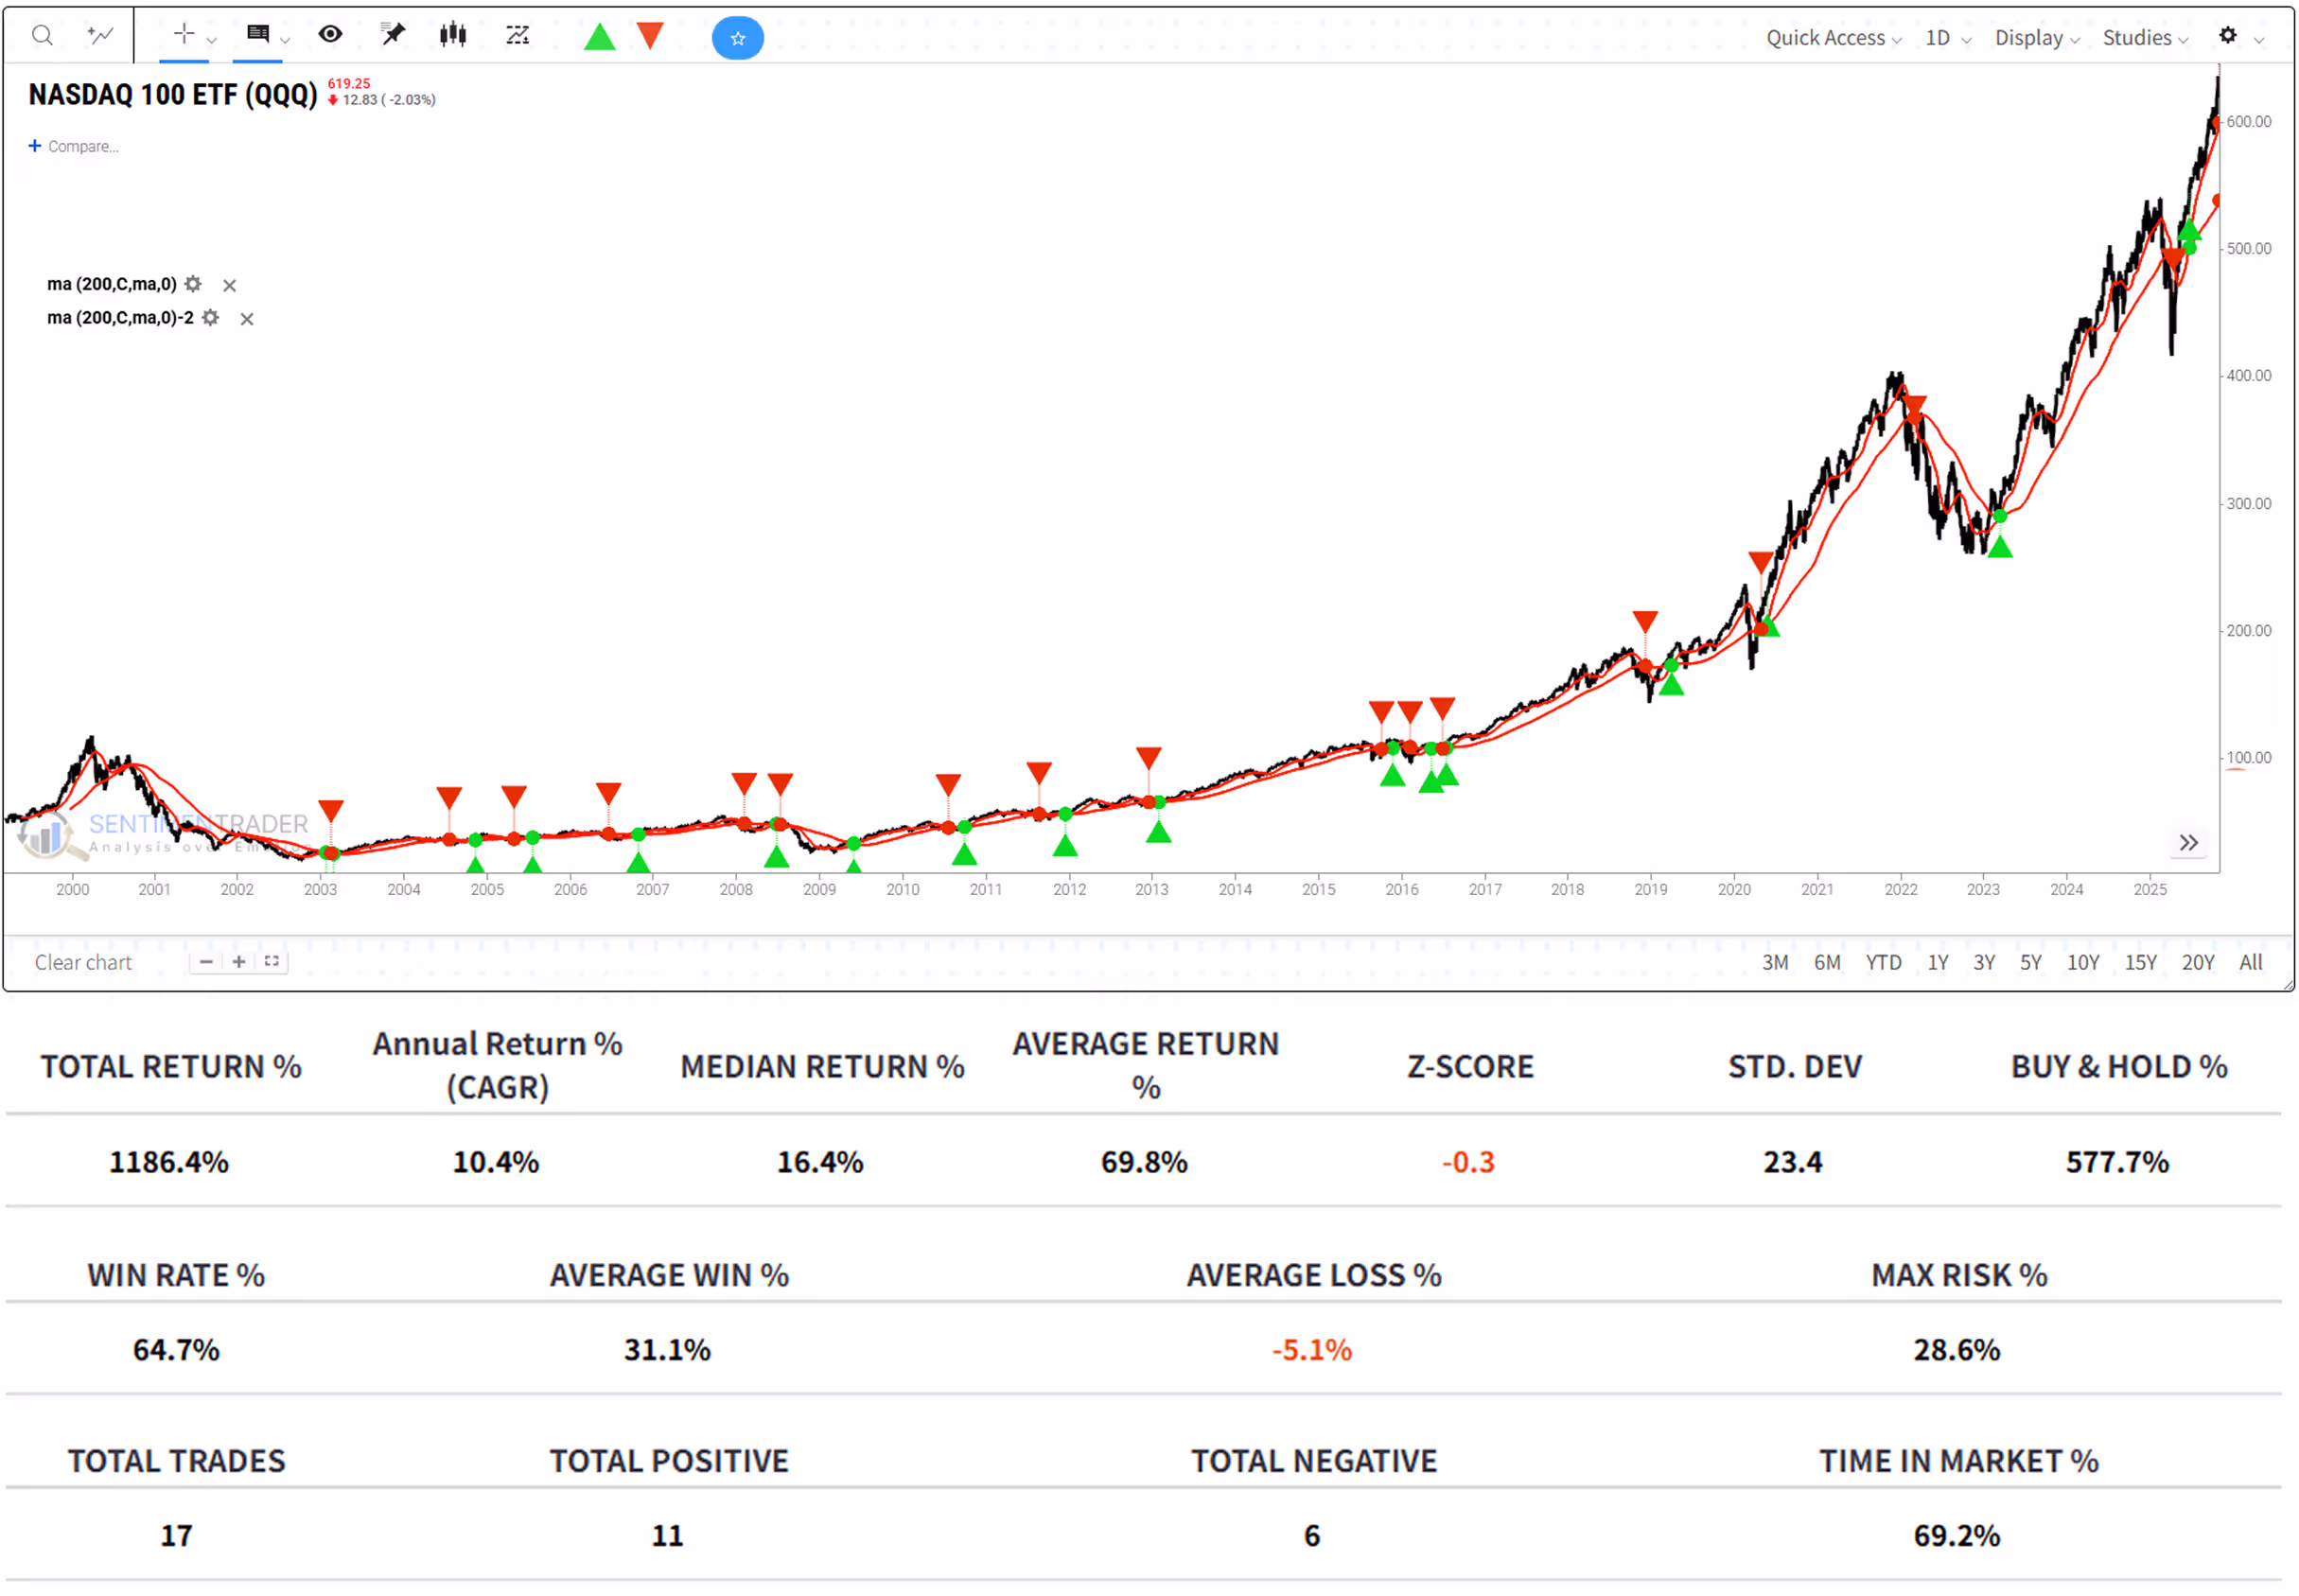
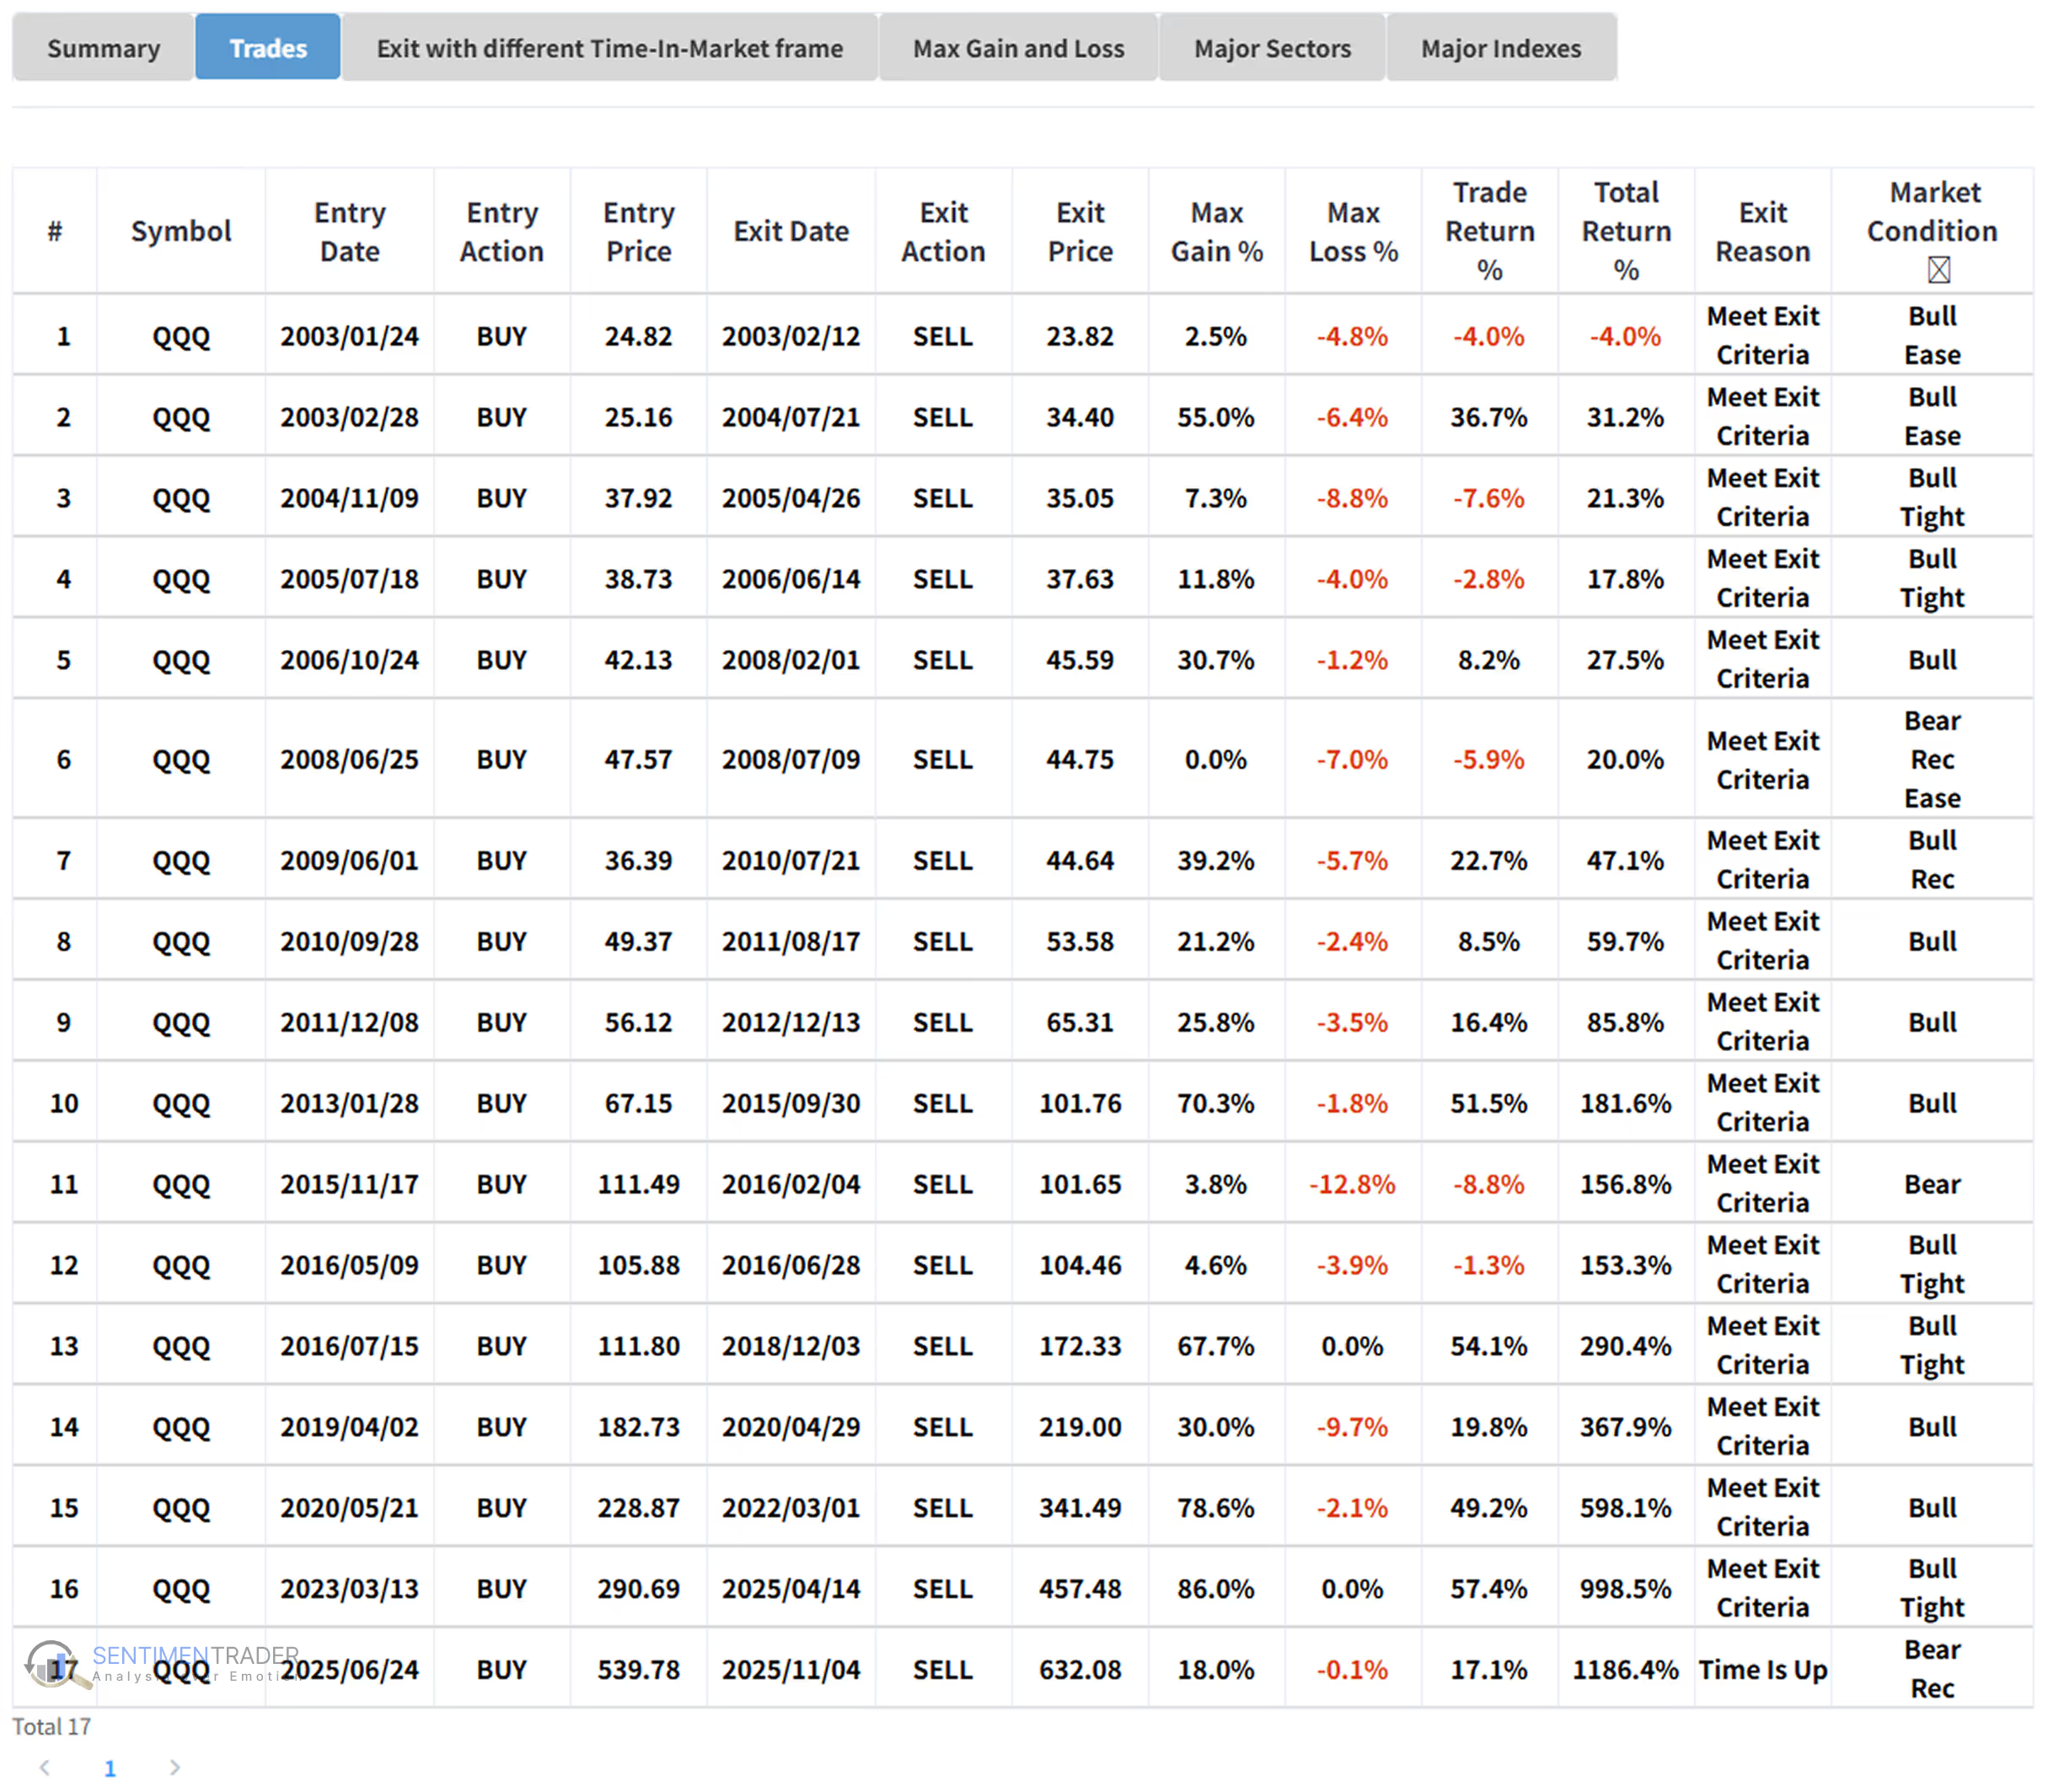
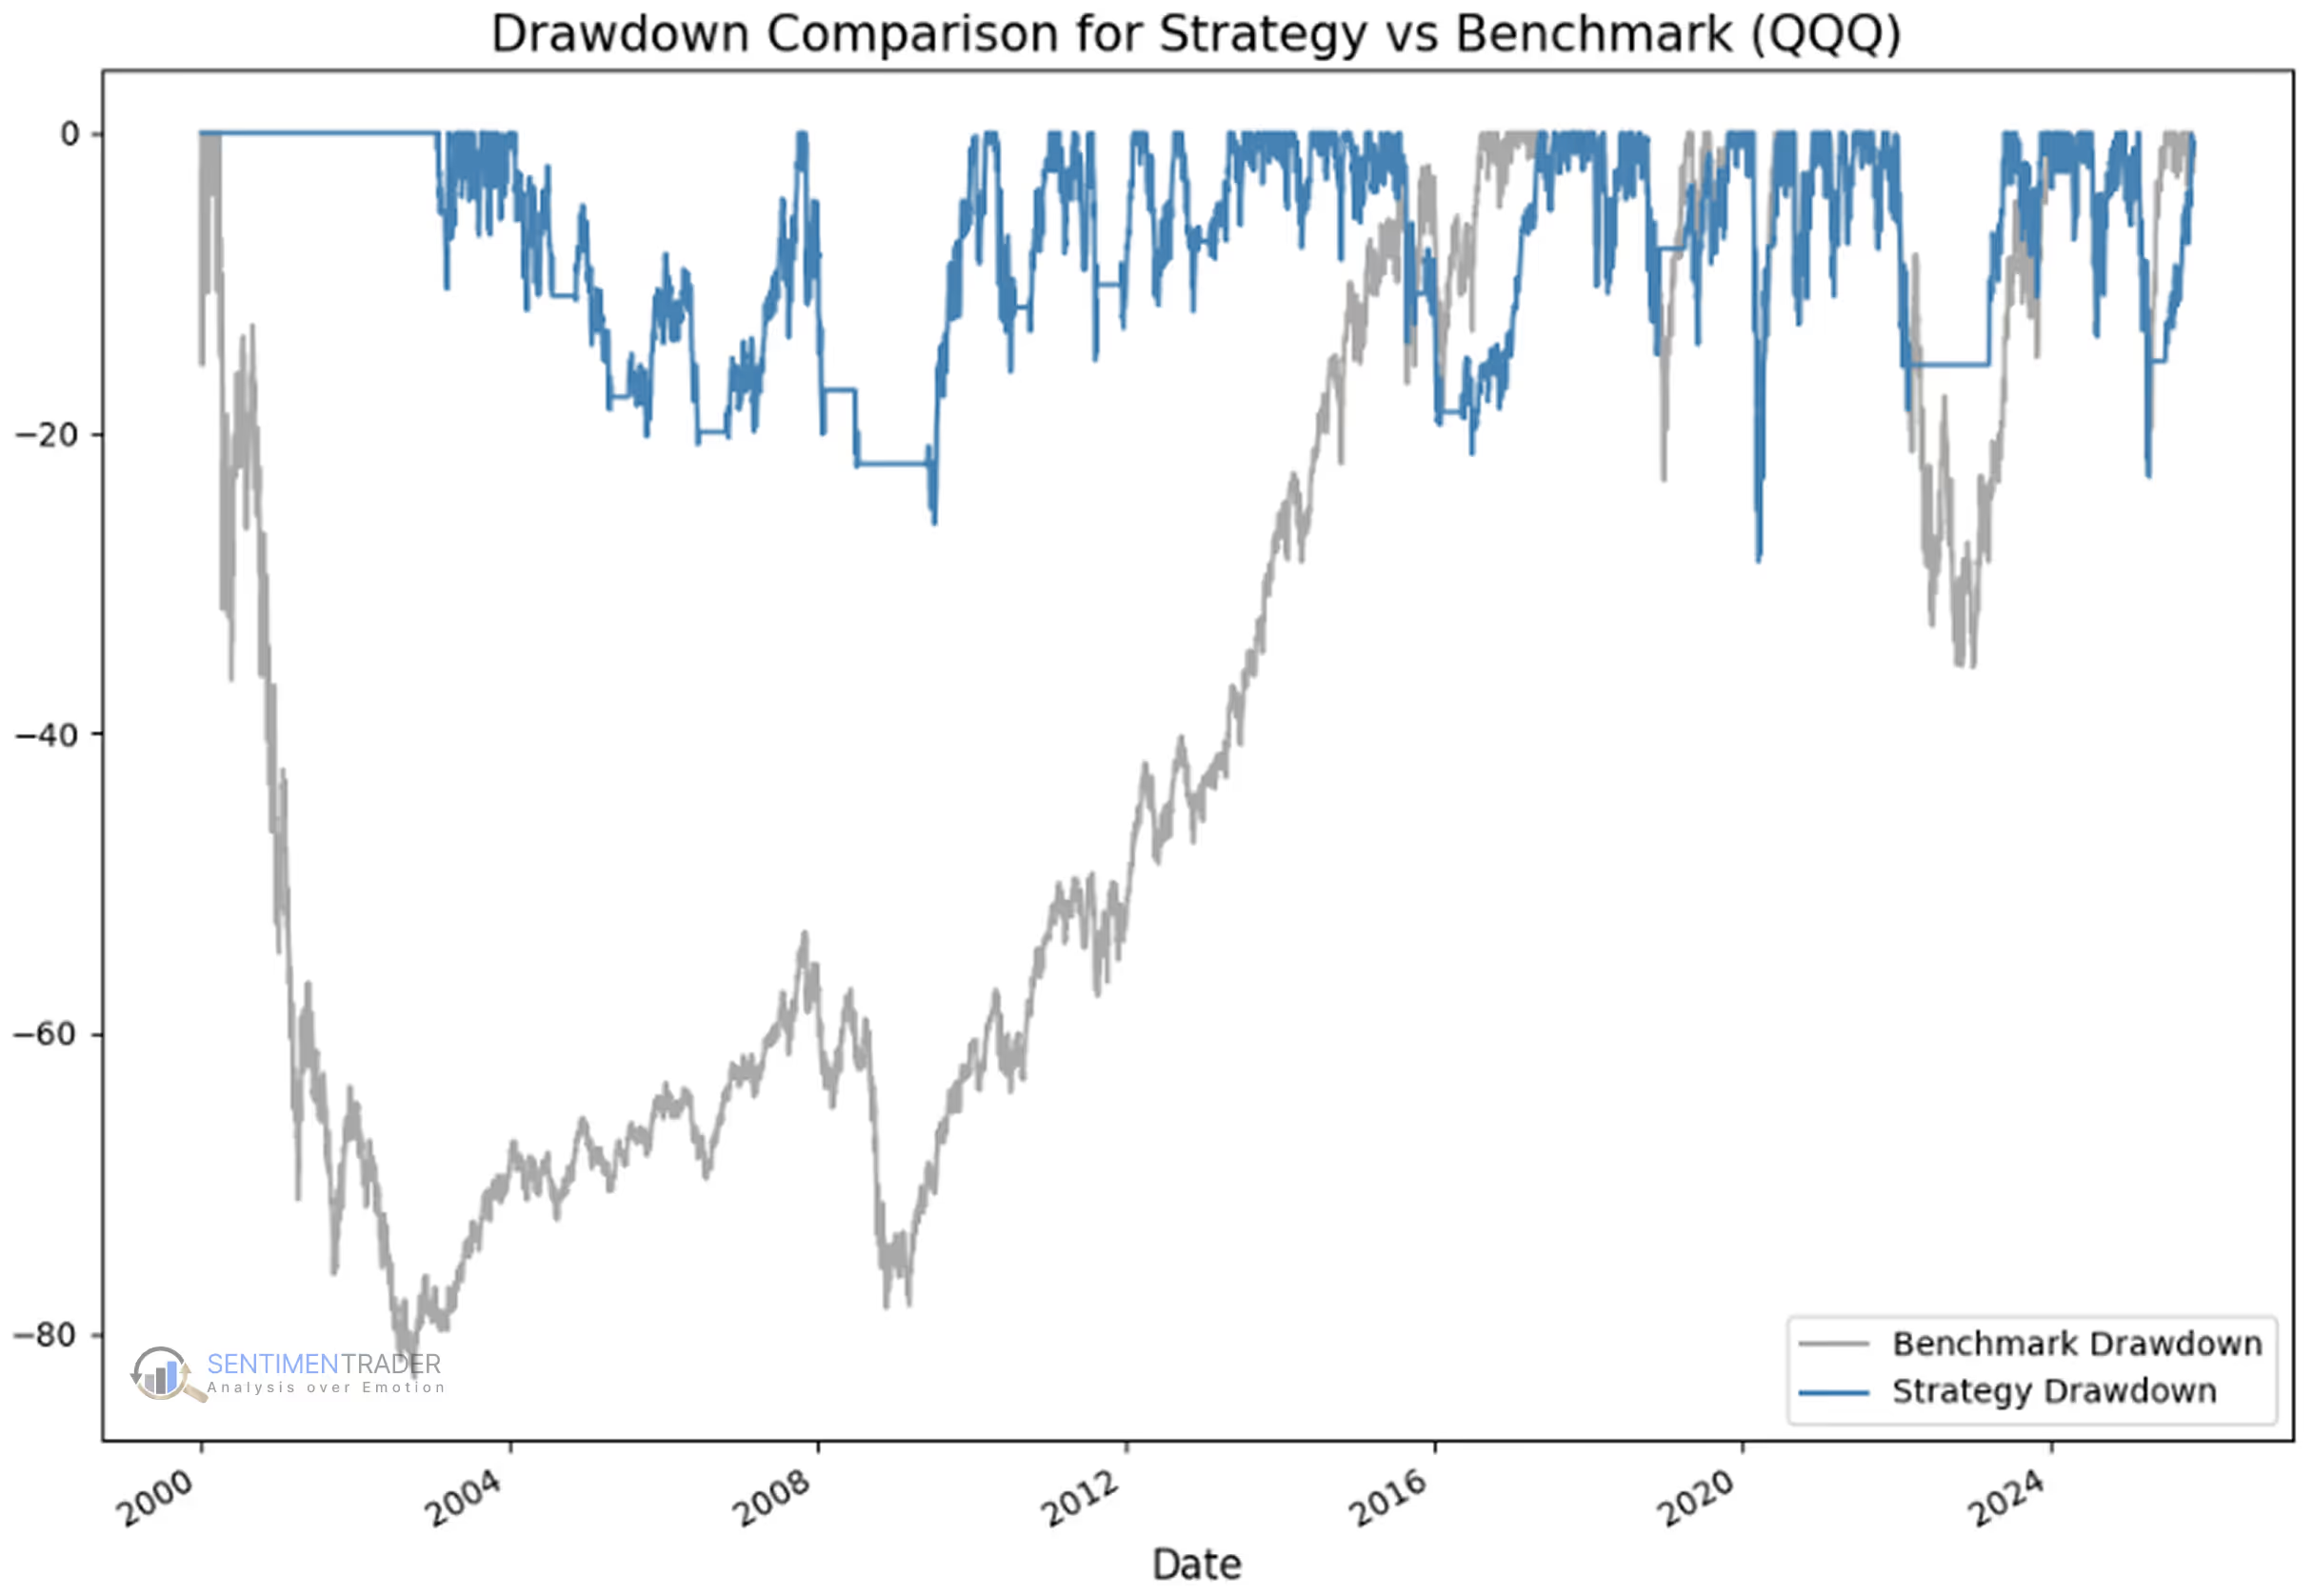
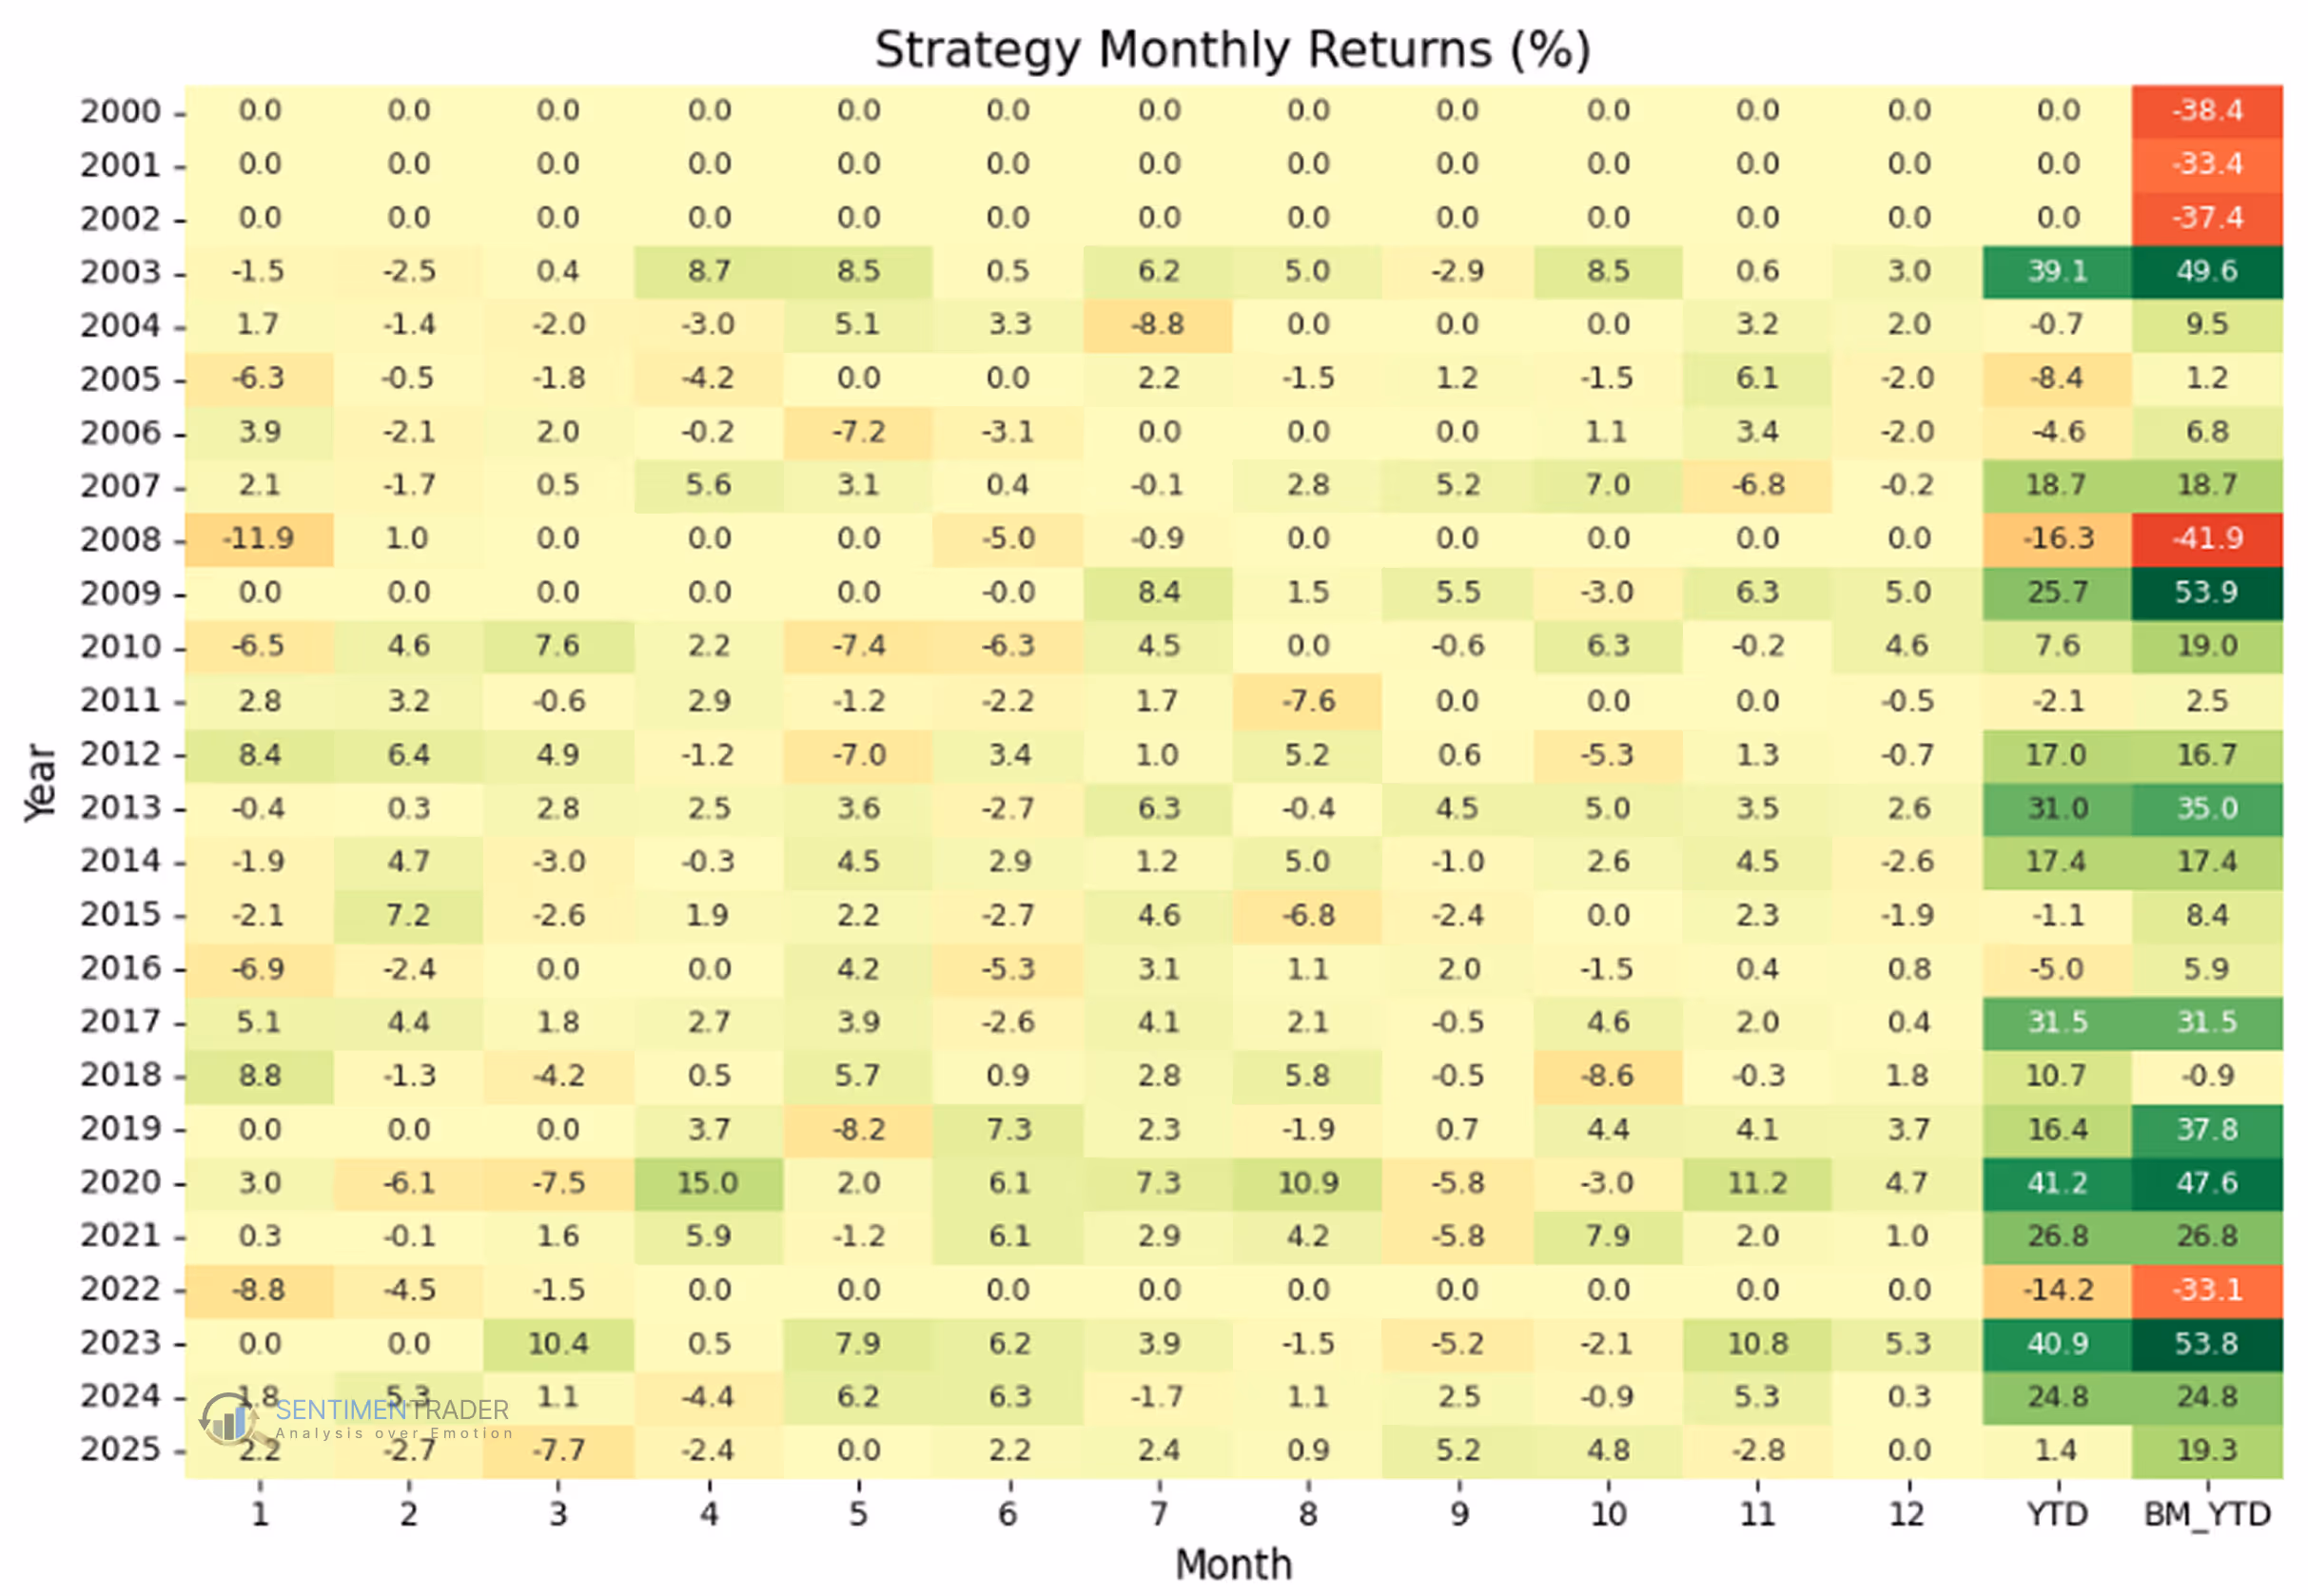
Traders often debate whether these simple tools hold up in practice. So we ran a backtest on the NASDAQ 100 ETF (QQQ) using the classic Golden Cross / Death Cross strategy:
Results over 25 years:
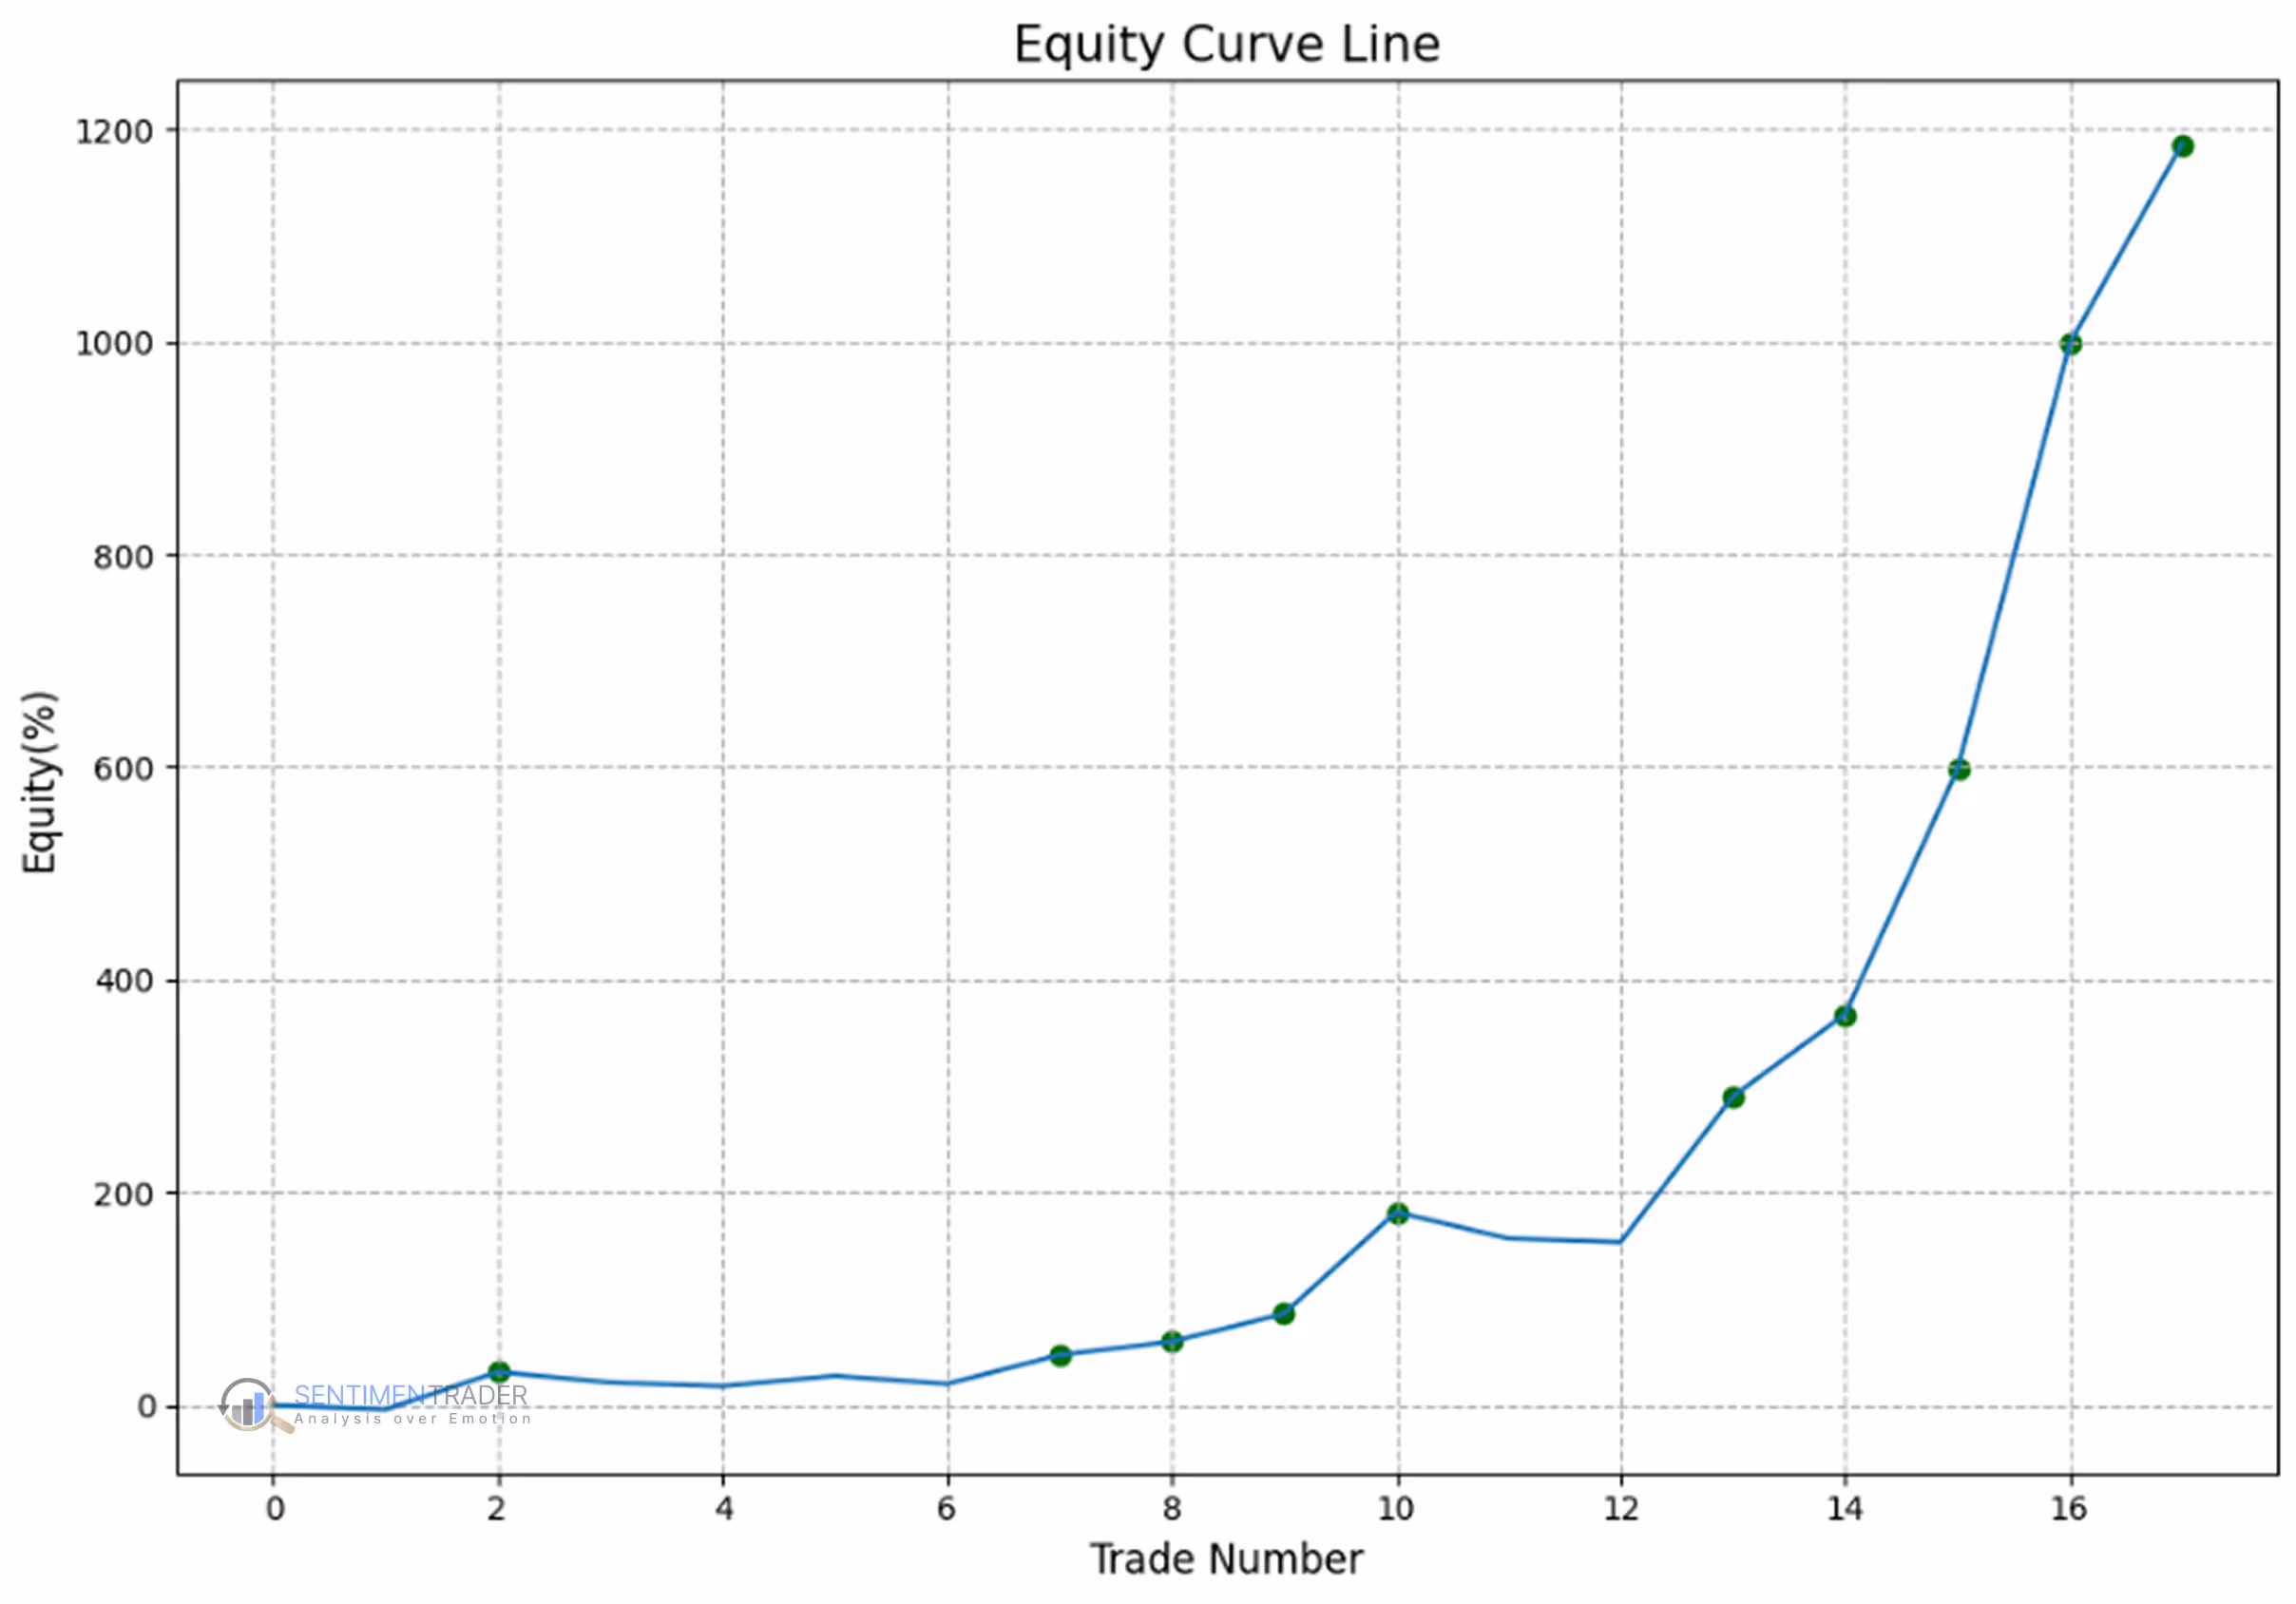
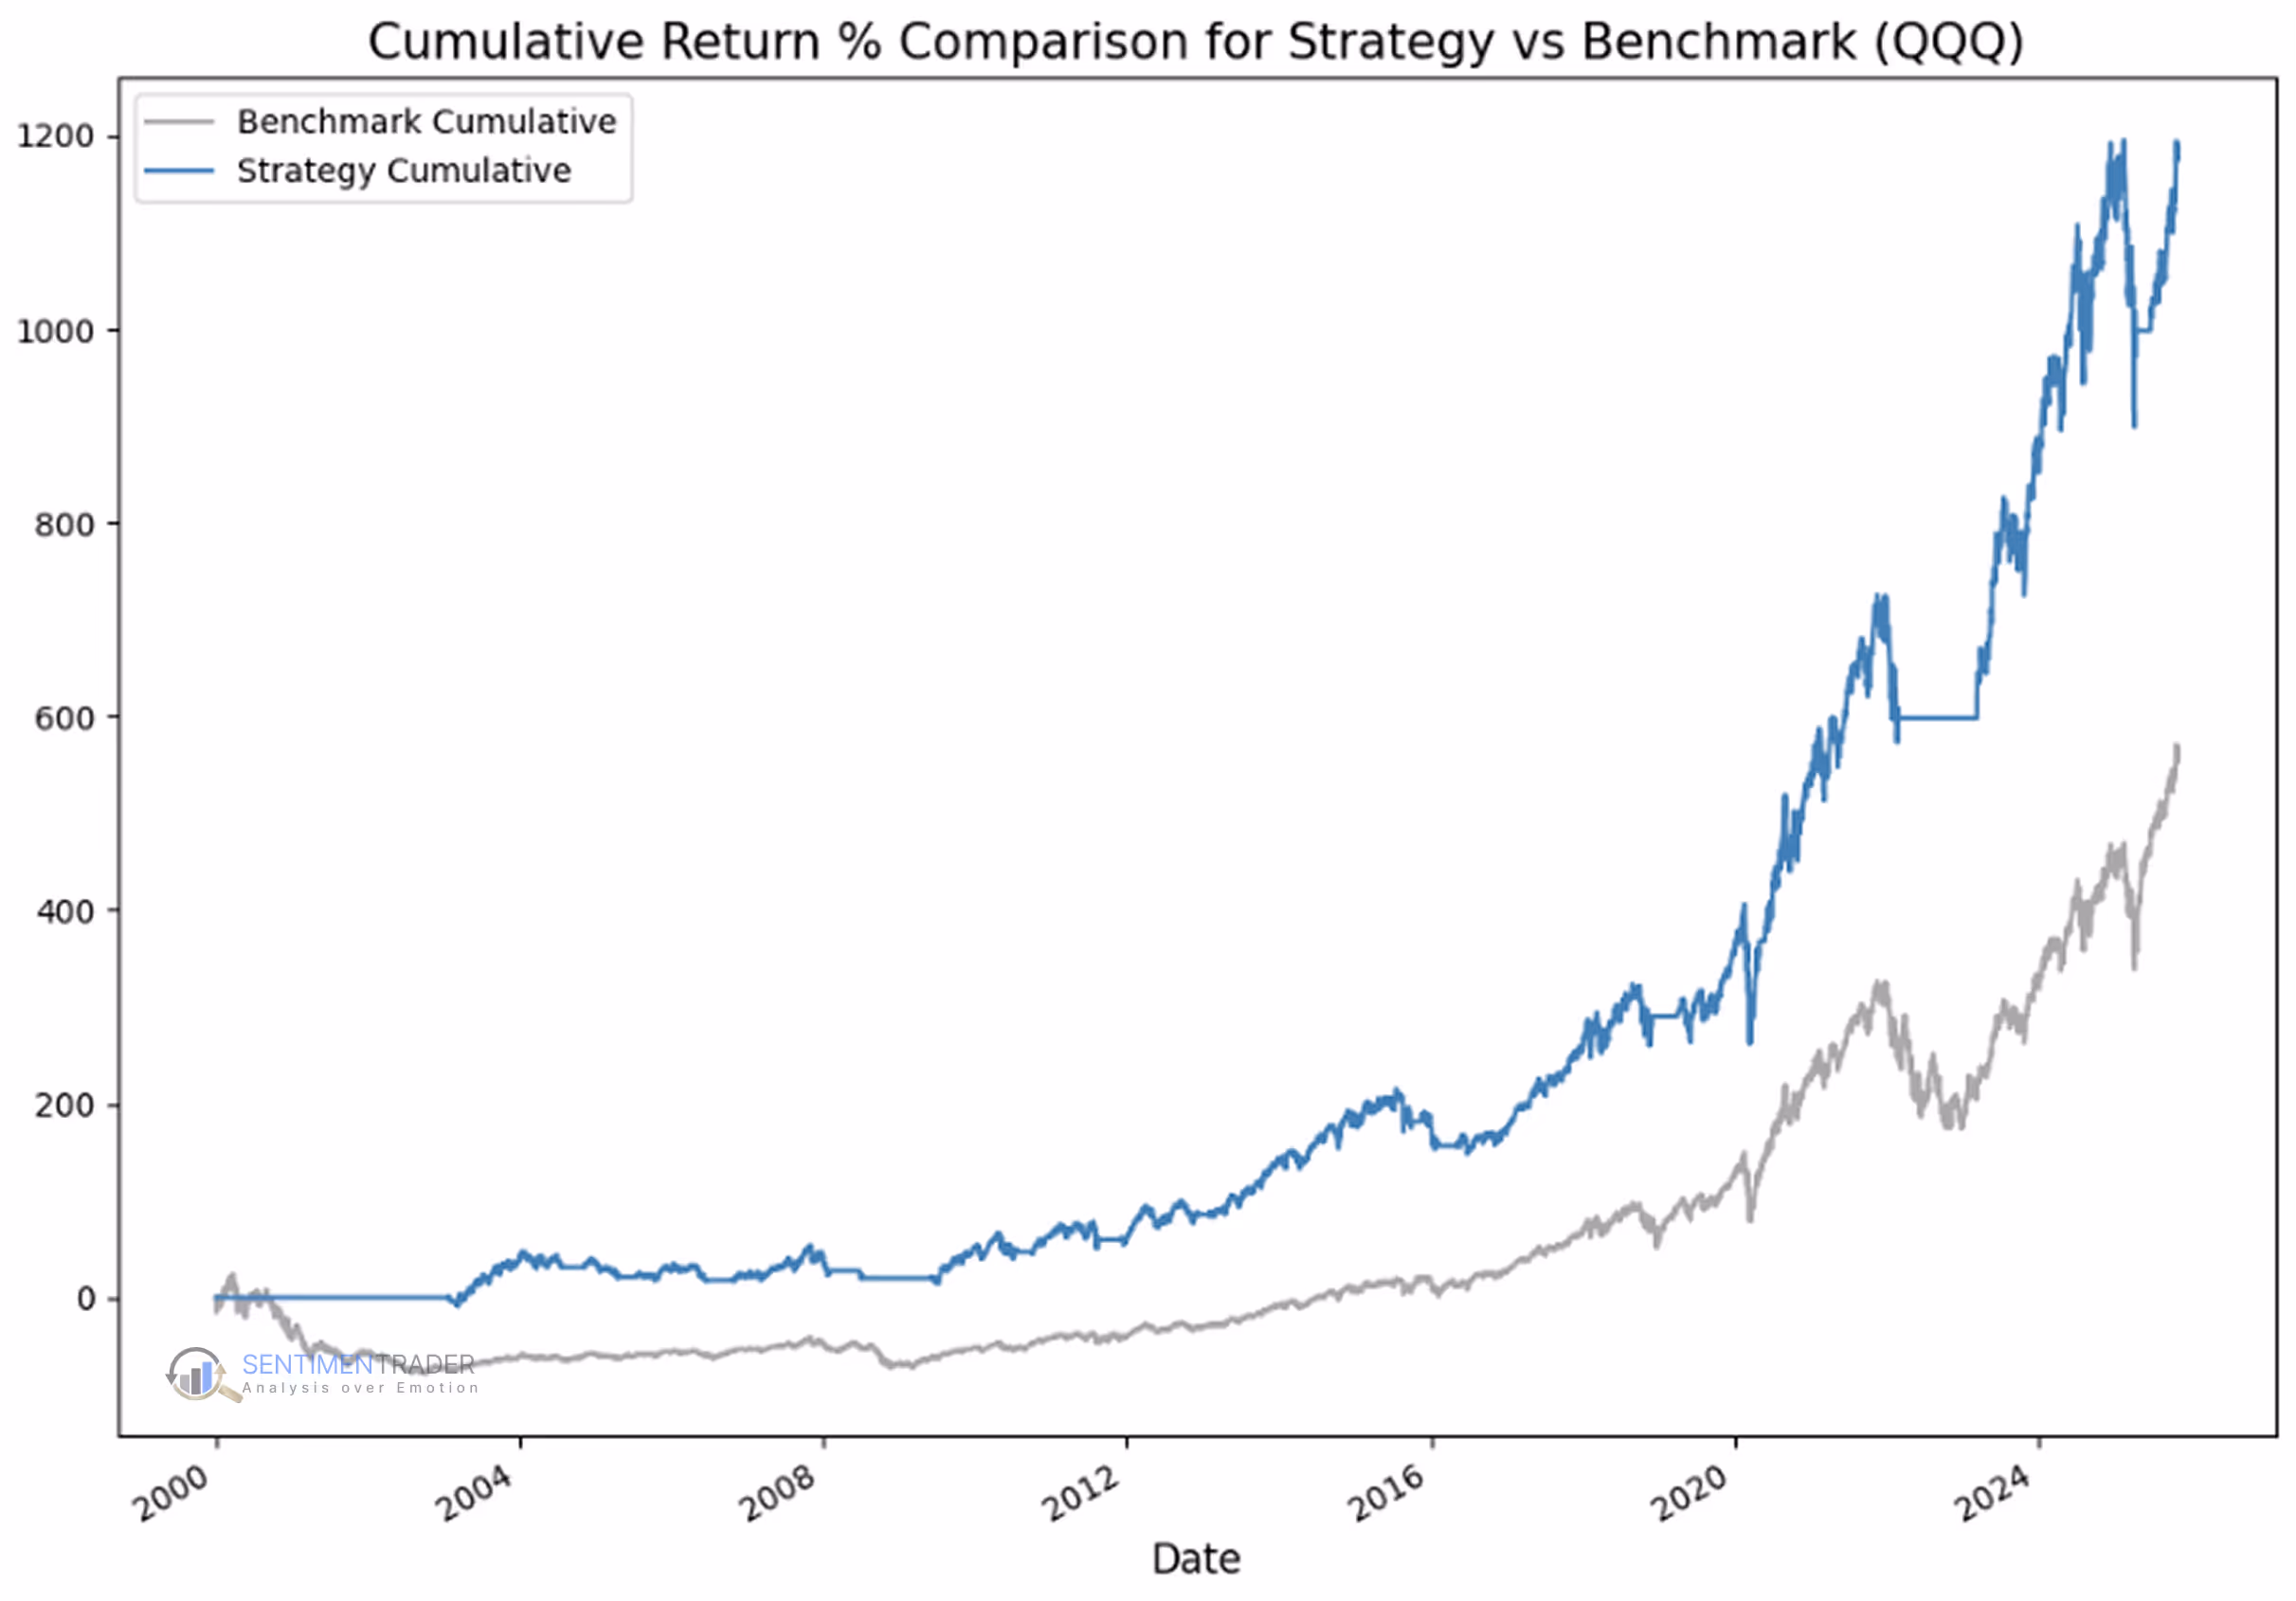
+1186% total return (vs. +577% for buy-and-hold).
Smaller drawdowns: -28% vs. -80% for QQQ in crashes.
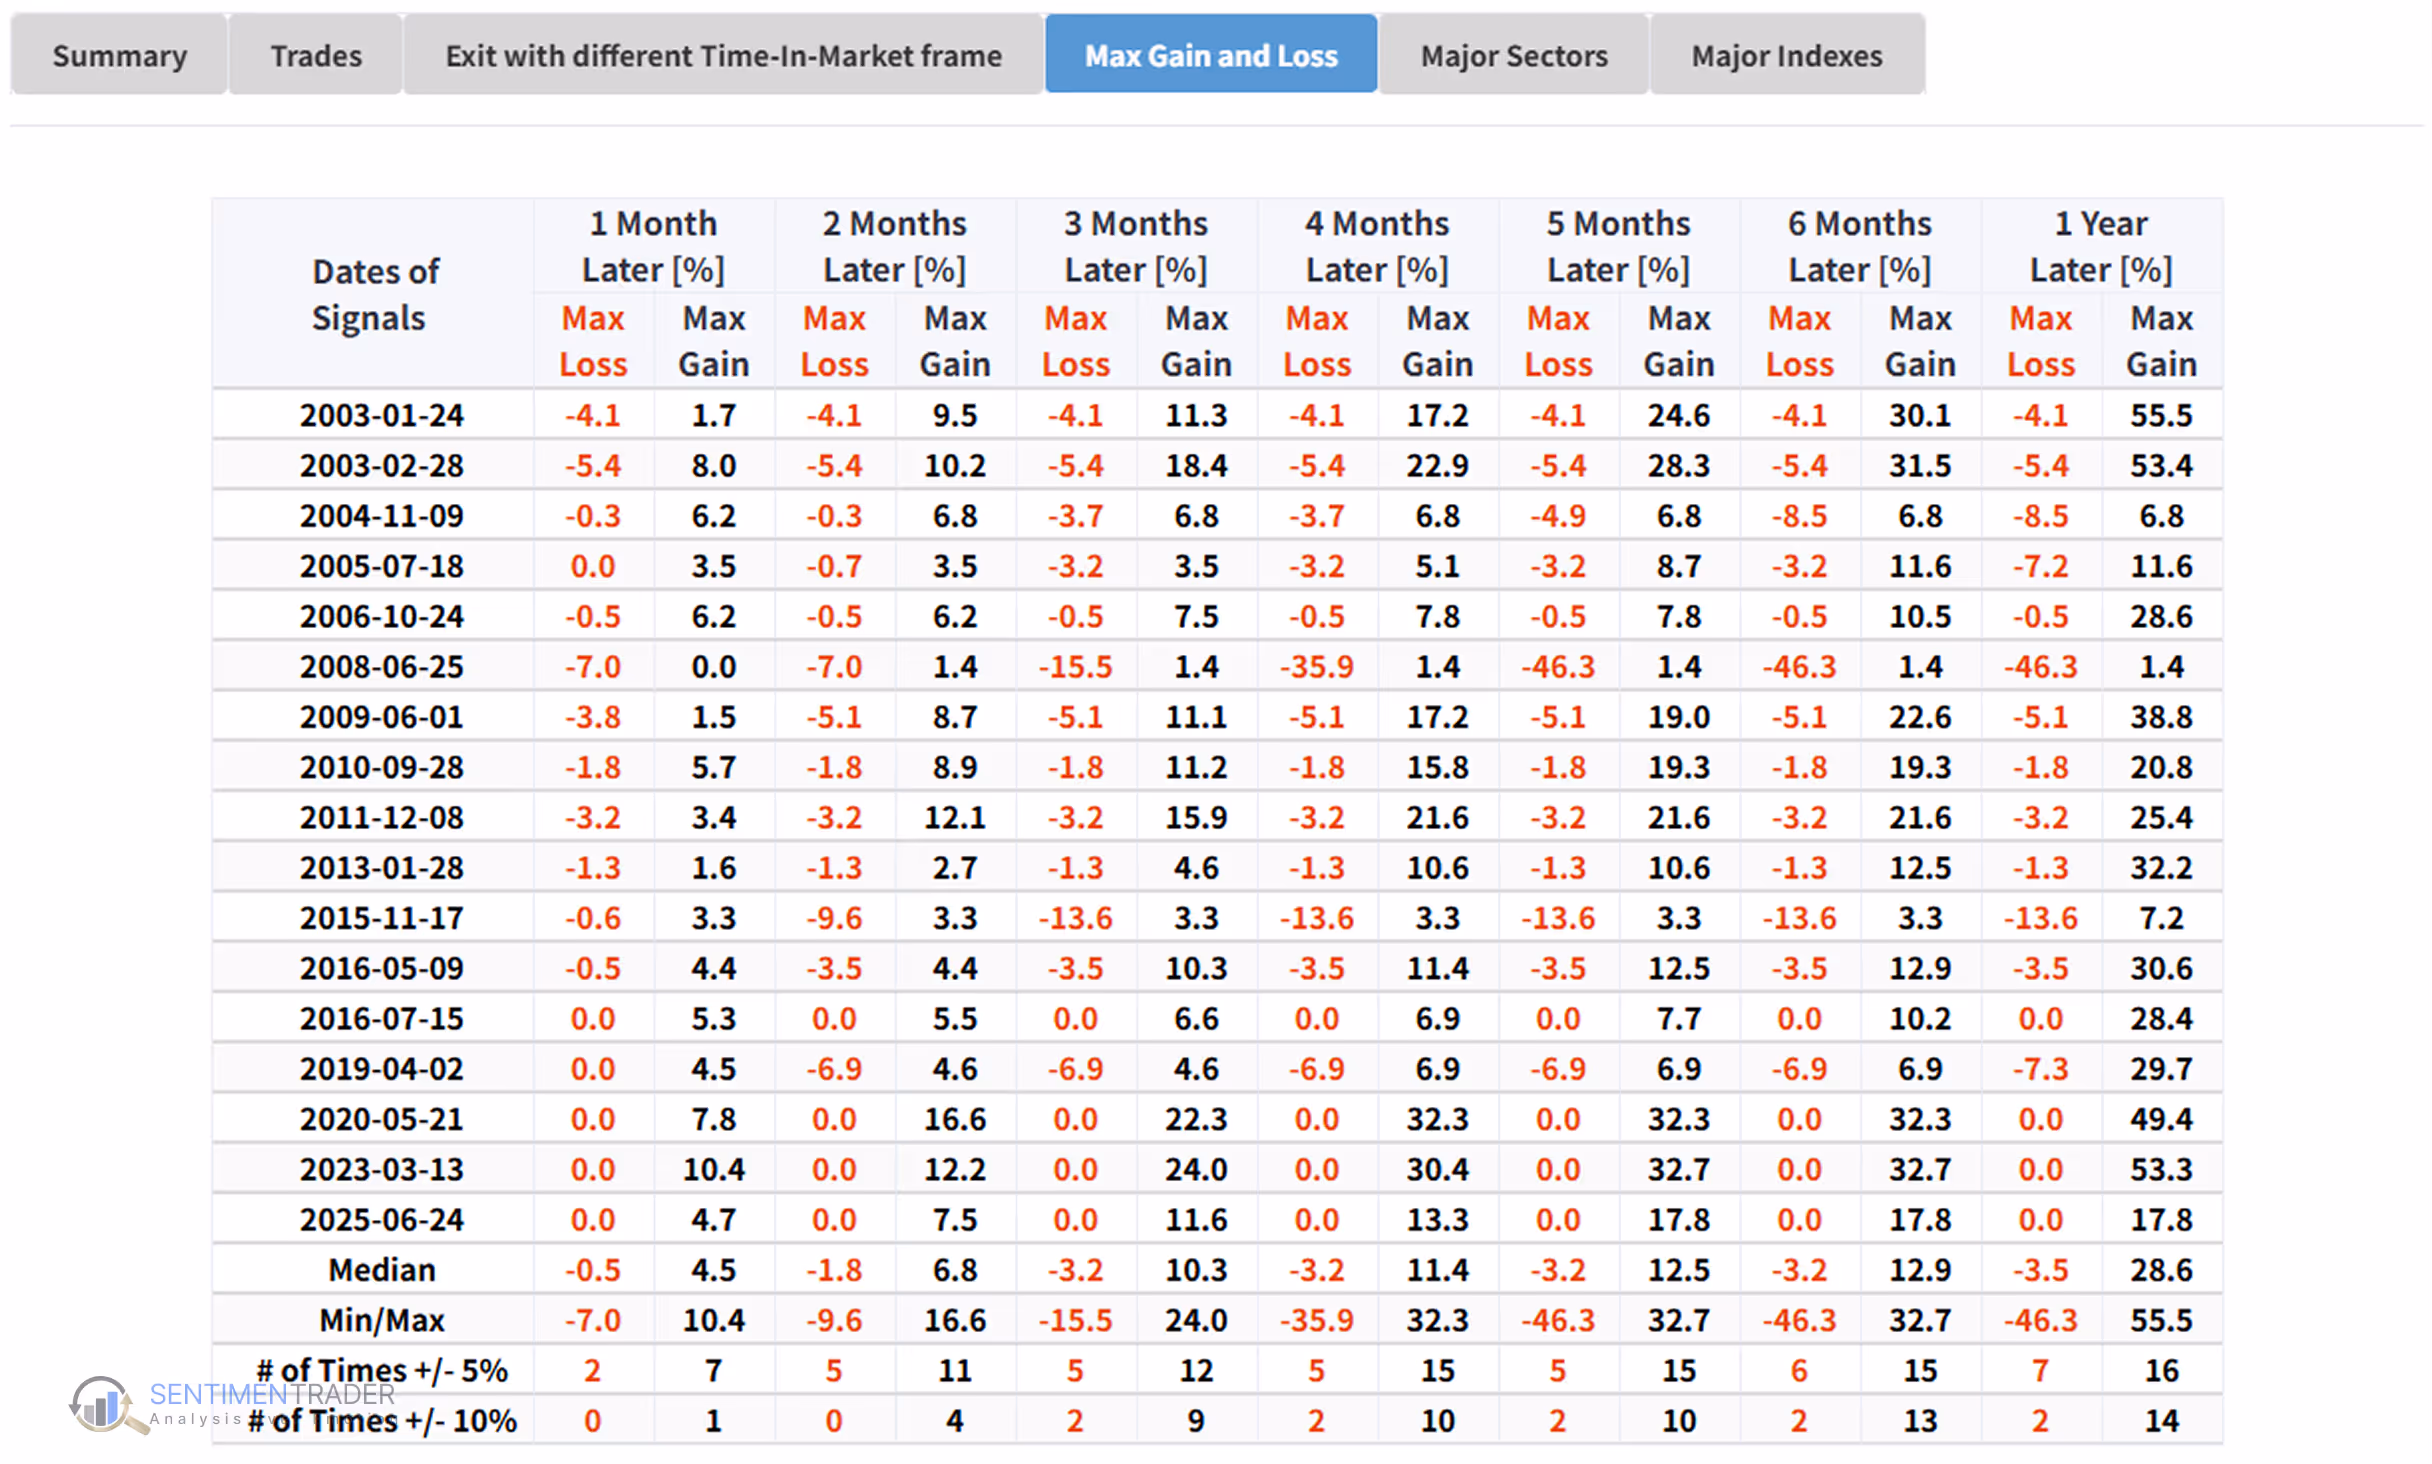
Fewer decisions: Only 17 trades in 25 years, with a 64.7% win rate.
Takeaway: Even though MAs are lagging indicators, they’ve historically helped traders ride major uptrends while sidestepping catastrophic losses.
This backtest was run using SentimenTrader's Proprietary Backtest Engine, which lets you test your strategy with nearly 100 technical indicators and over 17,000 indicators covering Sentiment, Trend Score, Breadth, Macro, and Seasonality. No coding required.
The Technical Bit
For those who want the mechanics, here’s how they’re calculated:
The Simple Moving Average (SMA) gives equal weight to all prices in the period. The SMA formula is:
Where:
P1, P2, ..., Pn are the closing prices for each day in the selected period.
n is the number of periods (e.g., 20 days, 50 days, 200 days).
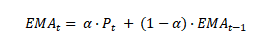
The Exponential Moving Average (EMA) gives more weight to recent prices, making it more responsive. The EMA formula is:
Where:
What This Means for Traders
Moving Averages won’t predict the future, but they give you:
Cleaner perspective on market direction.
Framework for discipline, avoiding emotional decisions.
Risk control when combined with tools like backtesting.
They’re one of the most widely used Trend indicators in technical analysis. Still, because they’re lagging and can create false signals in sideways markets, many traders pair them with indicators from other categories—for example, Momentum tools like RSI to gauge strength, Volume measures like On-Balance Volume to confirm participation, or Volatility tools like Bollinger Bands to assess risk.
That’s why they remain a cornerstone of technical analysis—and why pairing them with SentimenTrader’s backtest engine helps you separate what works from what just sounds good.