Why Linear Regression Forecast Matters
Markets often fluctuate around a central trend, and traders need tools that clarify where price should be based on its past behavior. Linear Regression Forecast transforms statistical regression into a visual tool that projects price trends forward — giving a data-driven view of potential continuation or deviation.
Clarity: Smooths noisy price data into a clean, statistically fitted trendline.
Forecasting insight: Projects the trend forward X bars, helping spot potential continuation zones.
Adaptability: Can include optional smoothing and deviation bands, working across timeframes and asset types.
How Traders Use Linear Regression Forecast
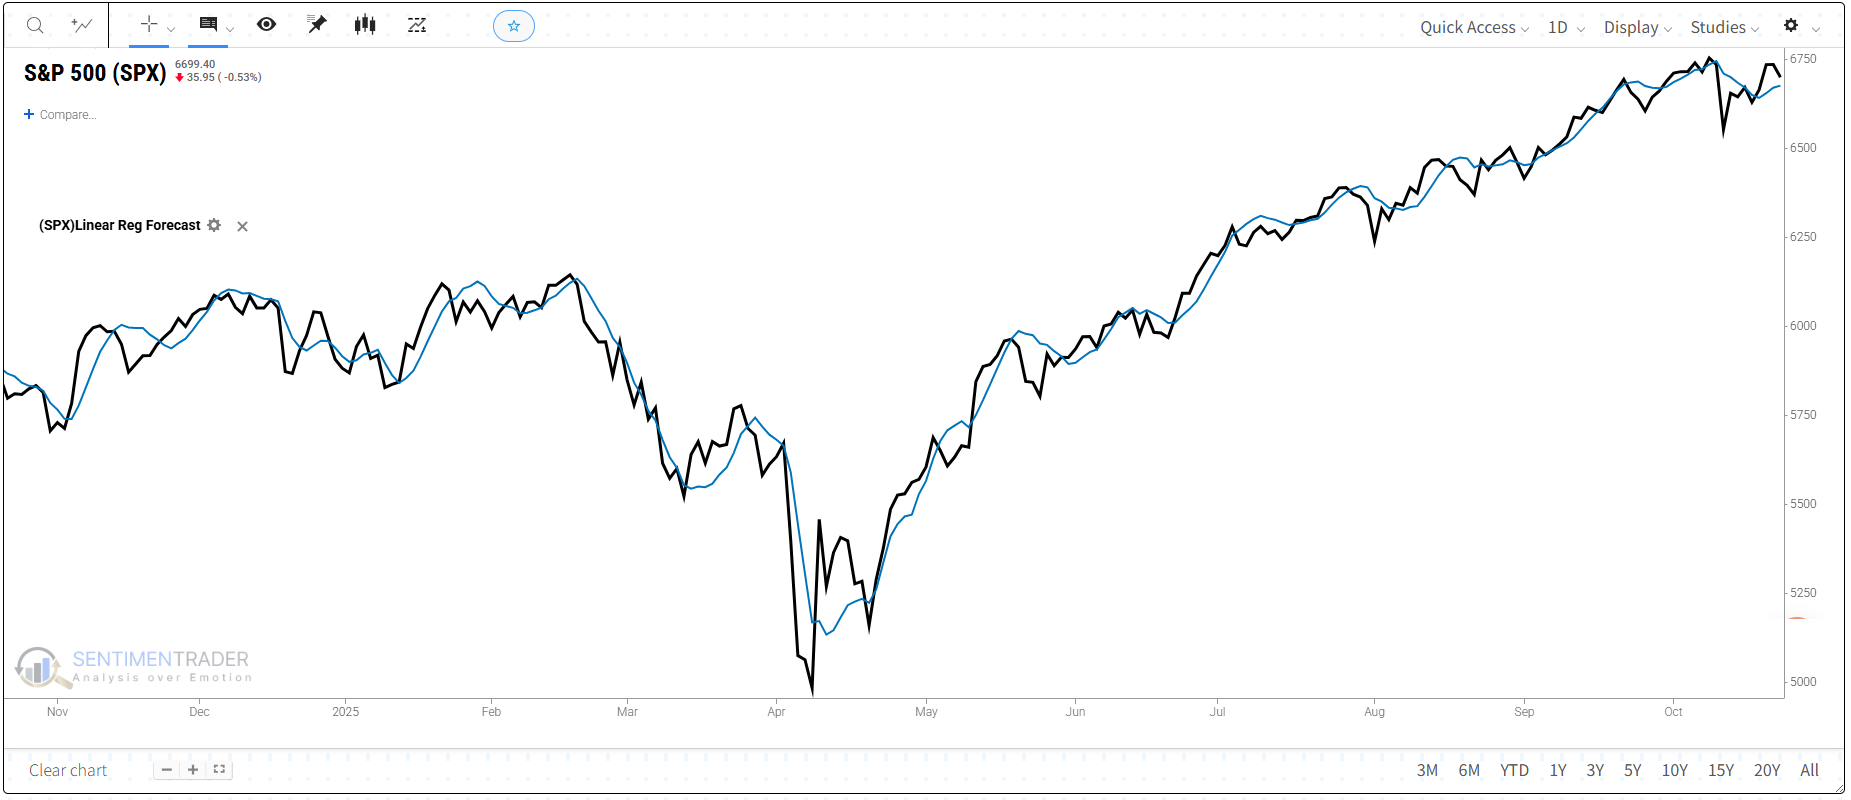
Trend tracking: The main LRF line acts like a dynamic trendline, showing the direction and rate of price change.
Forecast projection: Traders can set a forecast period (e.g., 5 bars ahead) to visualize where the regression line is expected to move next.
Deviation zones: Optional standard deviation bands highlight when prices are unusually high or low relative to the projected trend.
Real-World Results: Do They Actually Work?
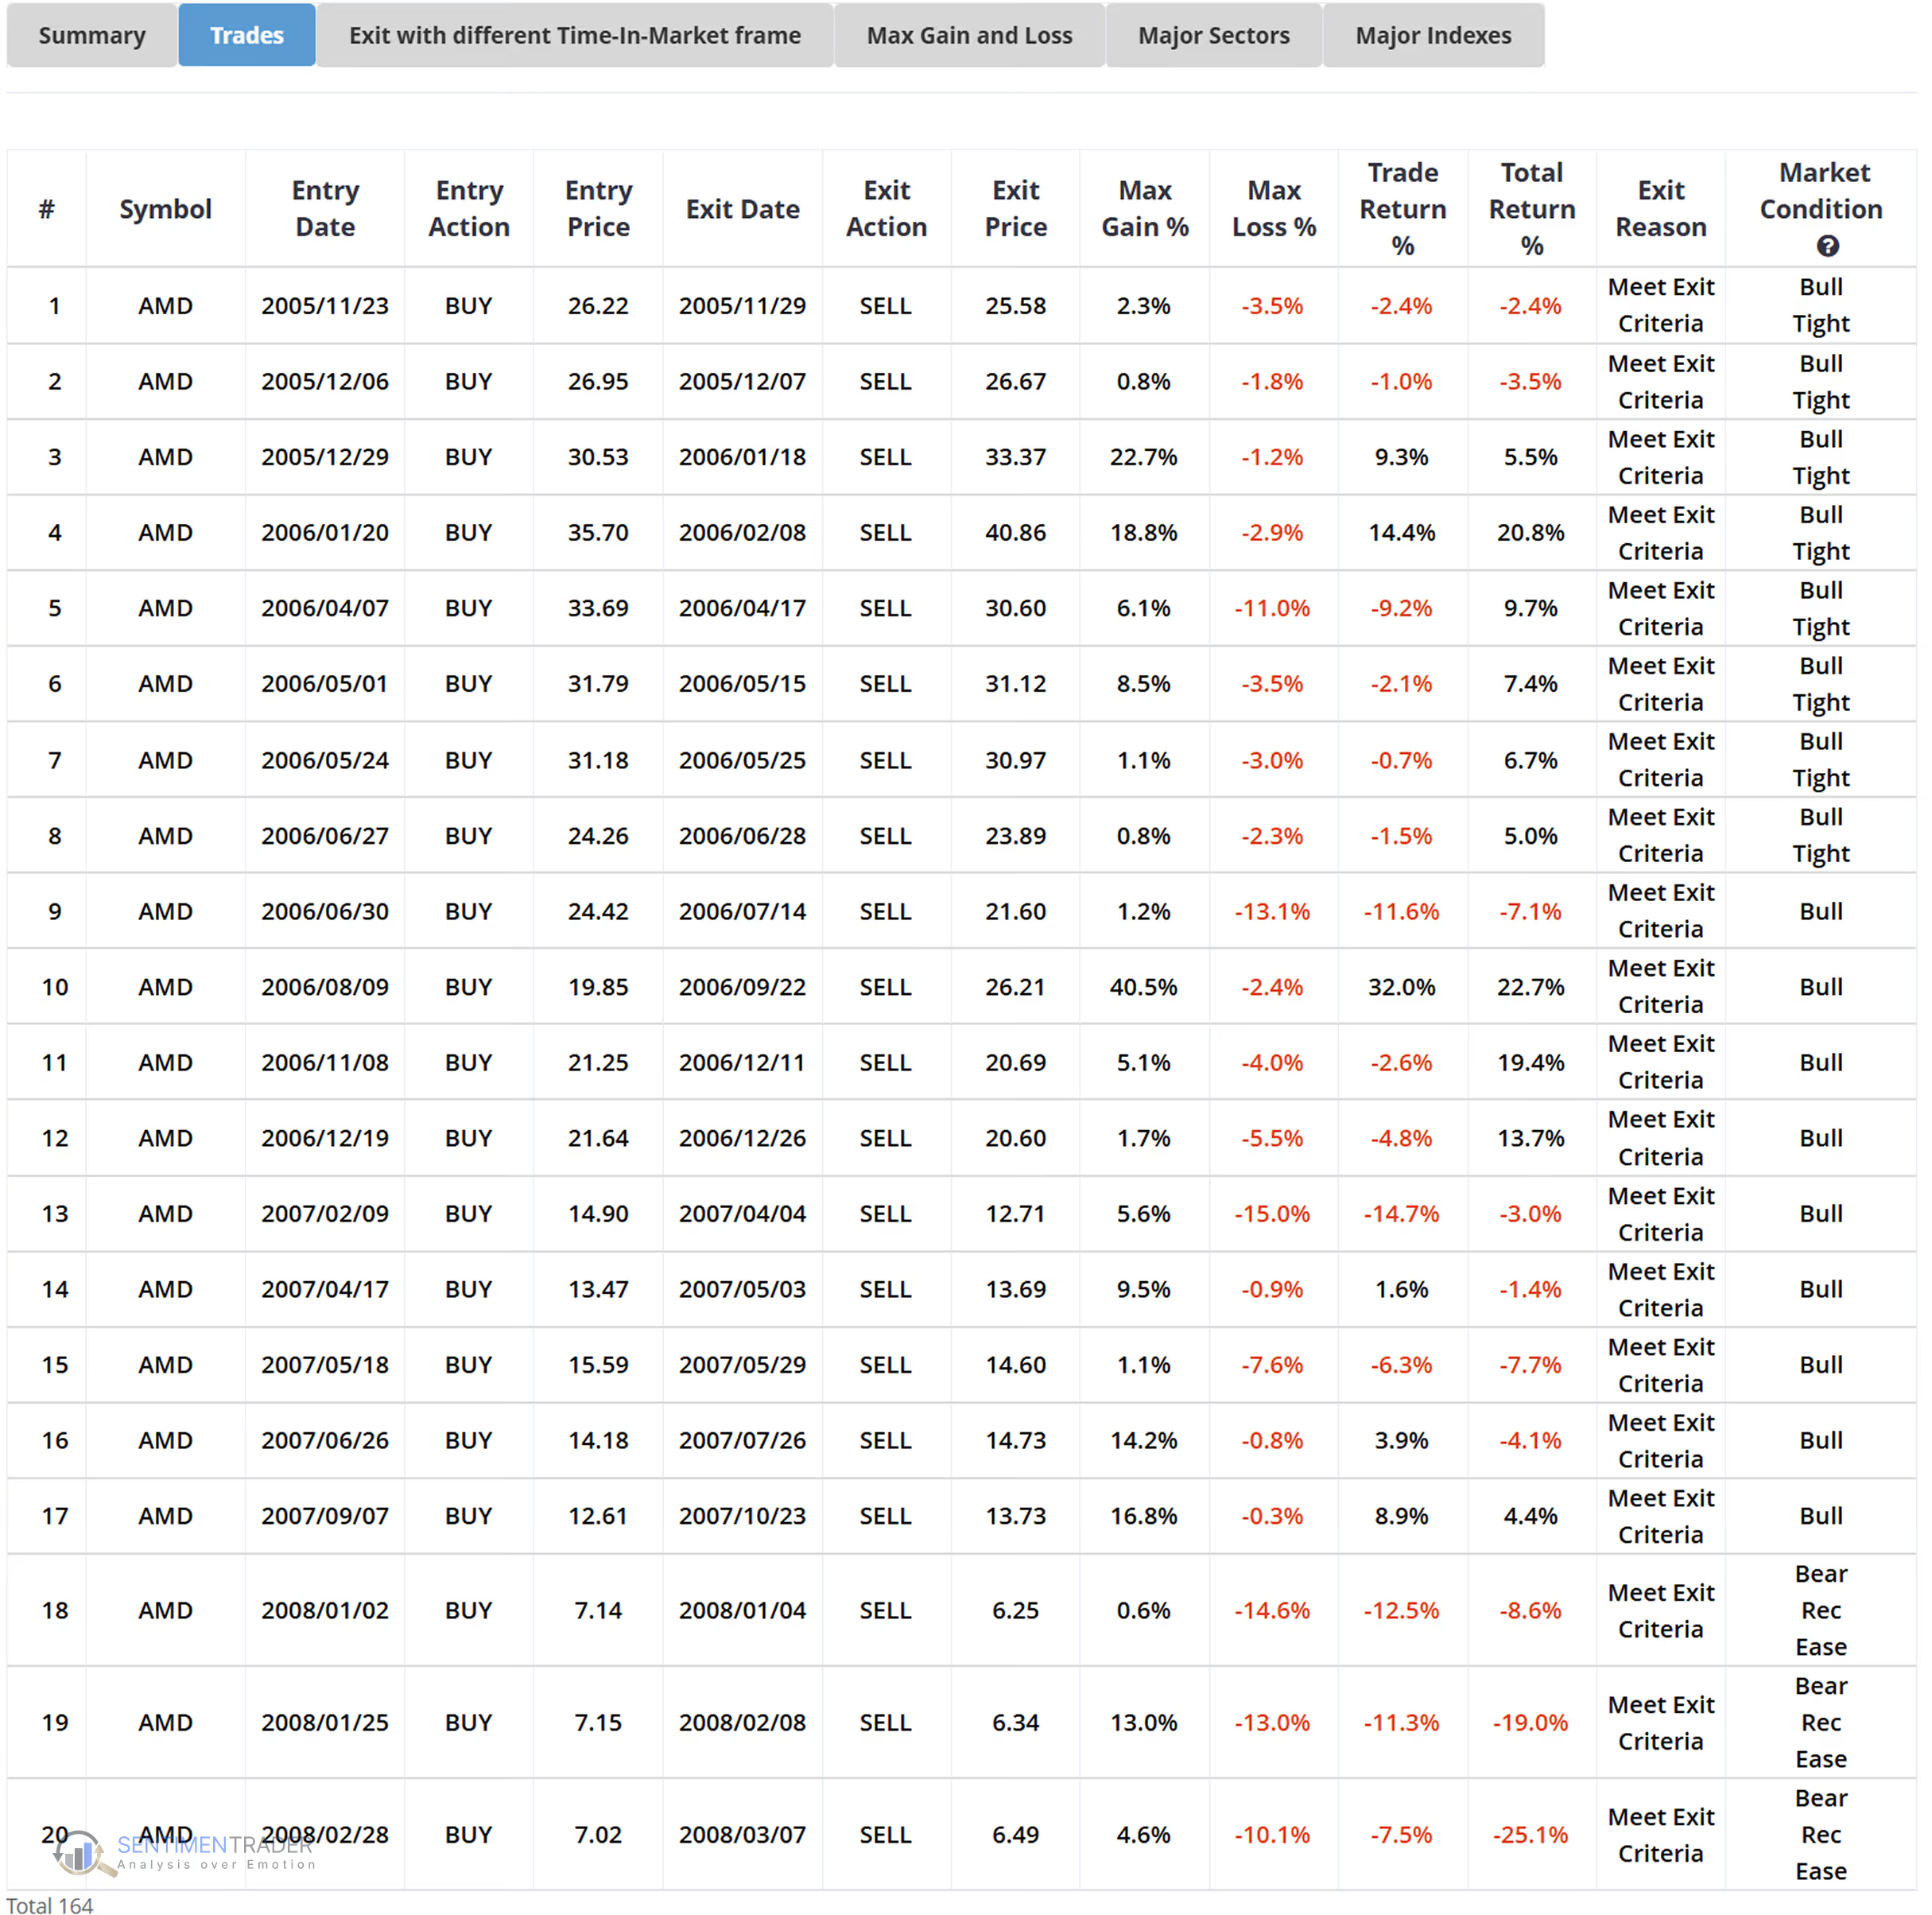
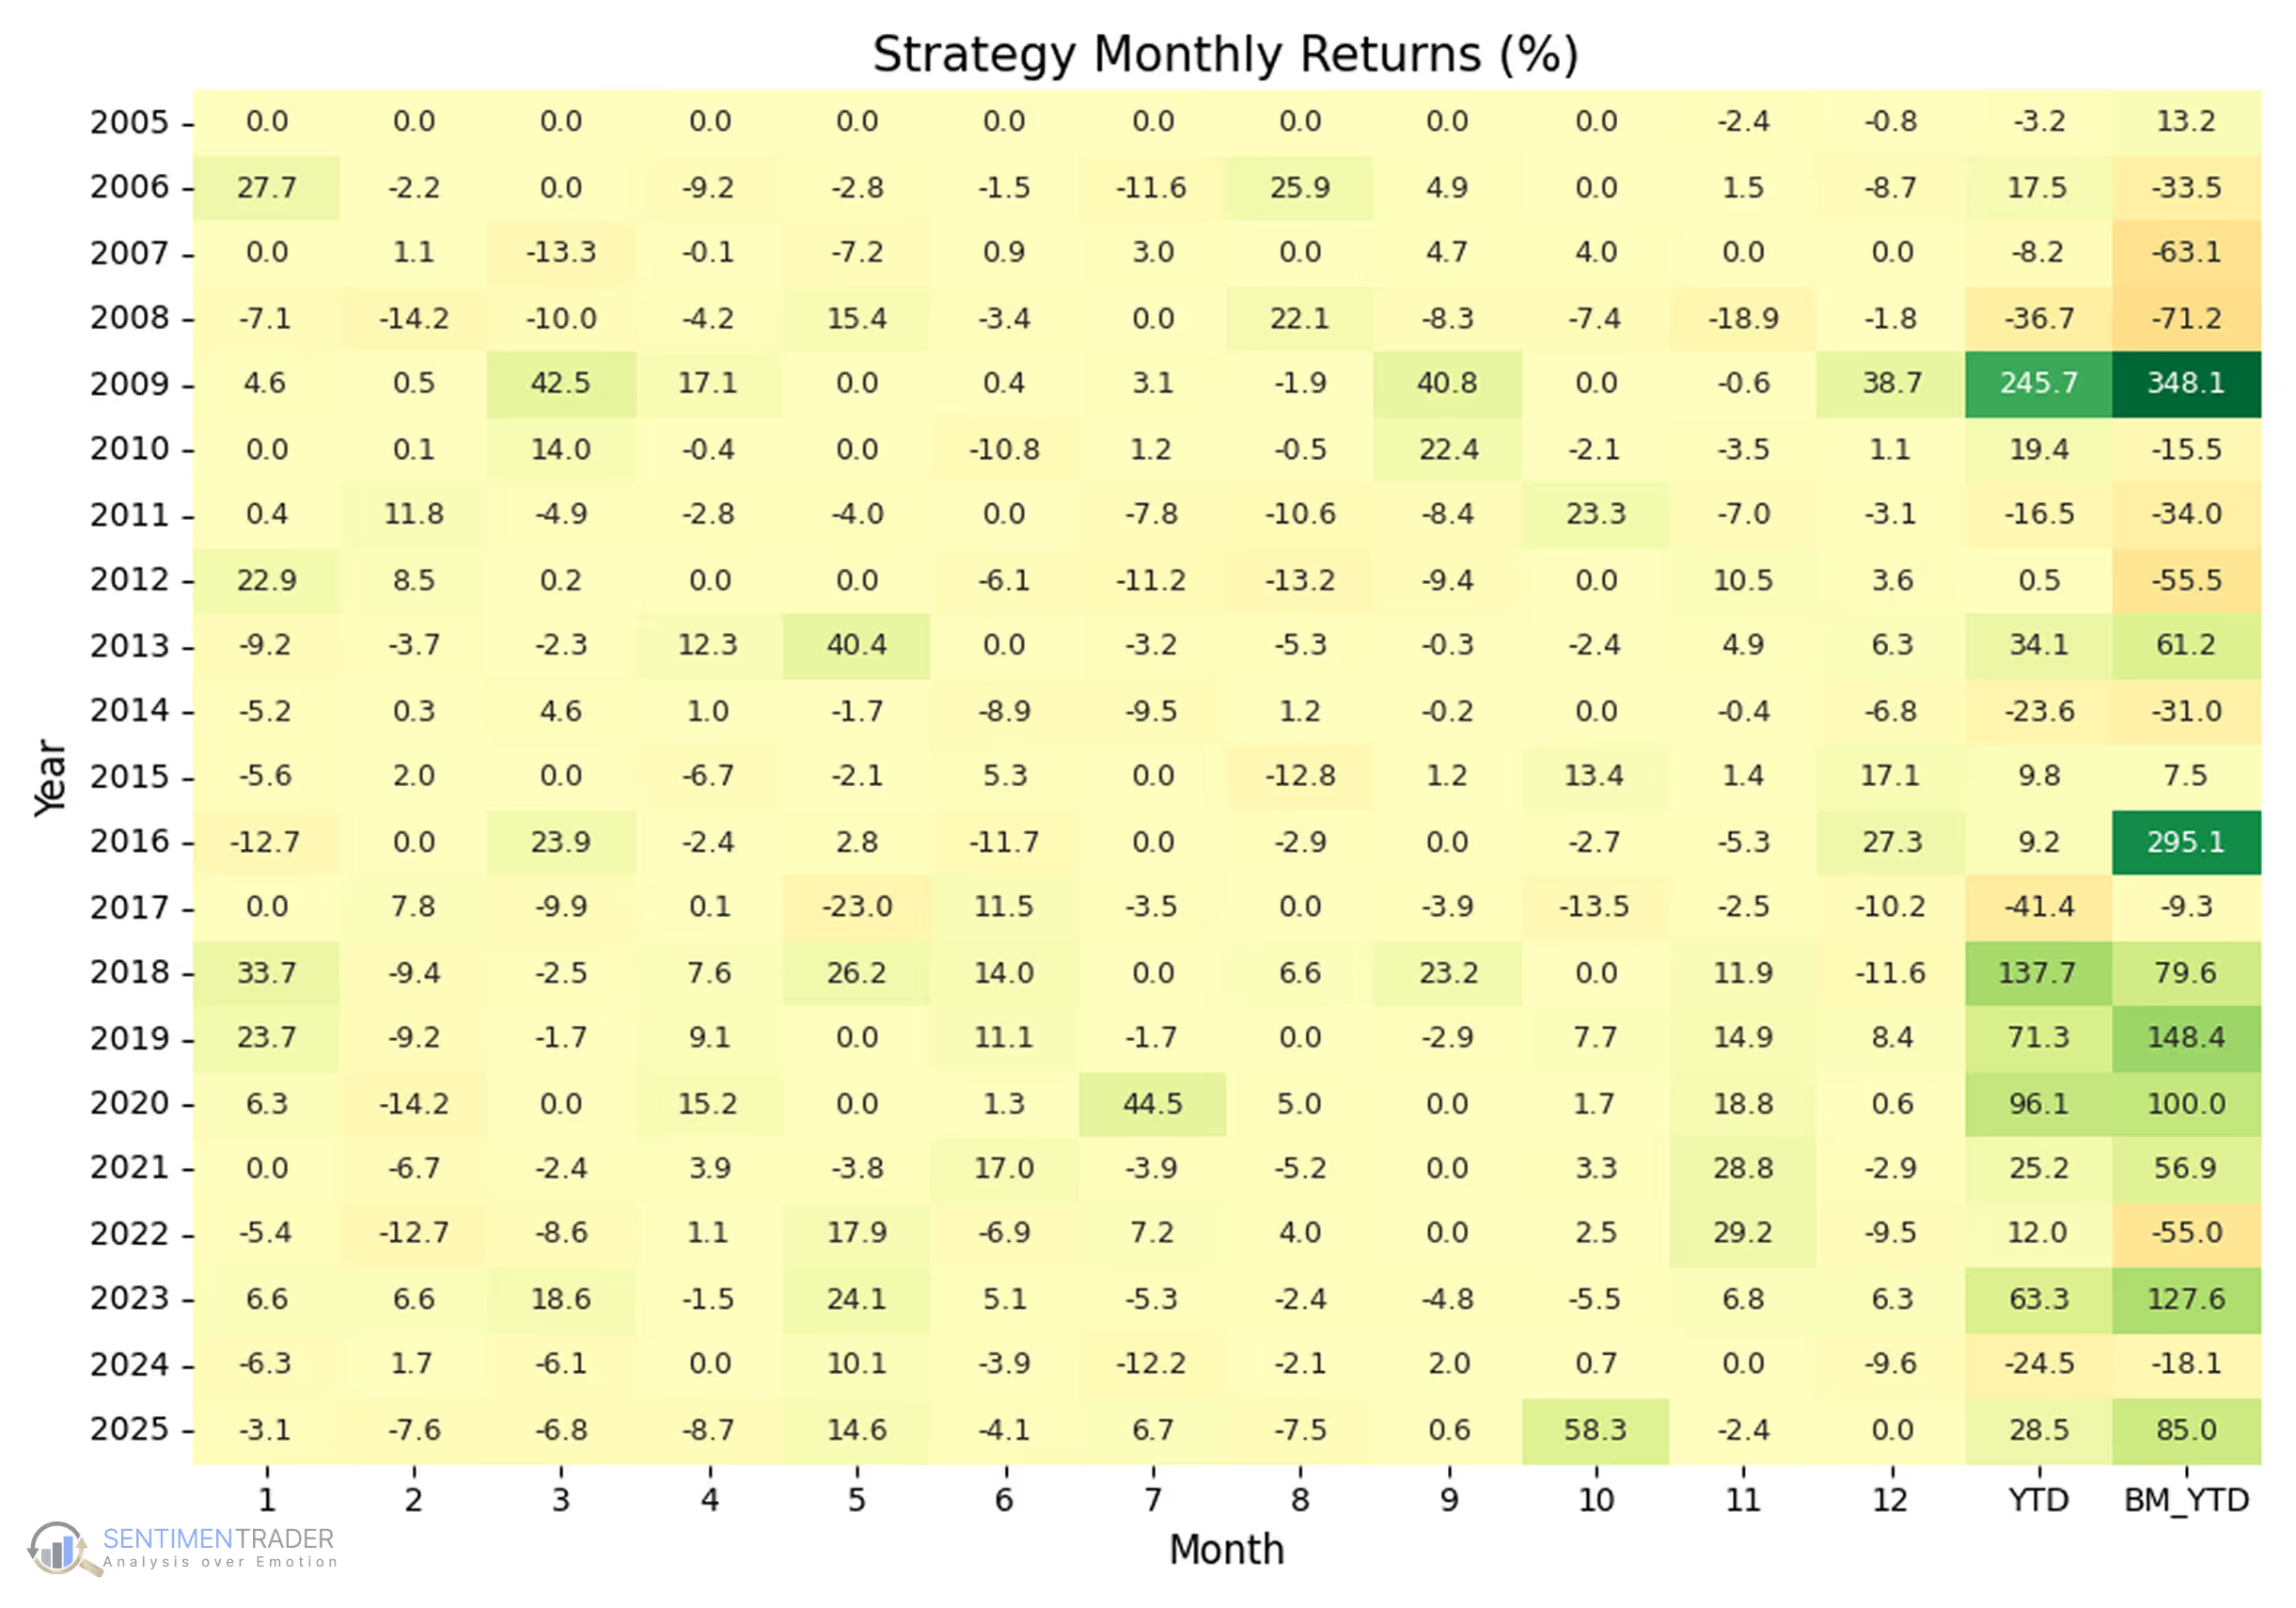
To see how well Linear Regression Forecast performs in practice, we ran a backtest on Advanced Micro Devices (AMD) from 2005 to 2025 using a trend-following setup with momentum confirmation.
Buy: When price crosses below the Linear Regression Forecast line, with MACD confirming positive momentum.
Sell: When MACD crosses below its signal line, signaling trend deterioration.
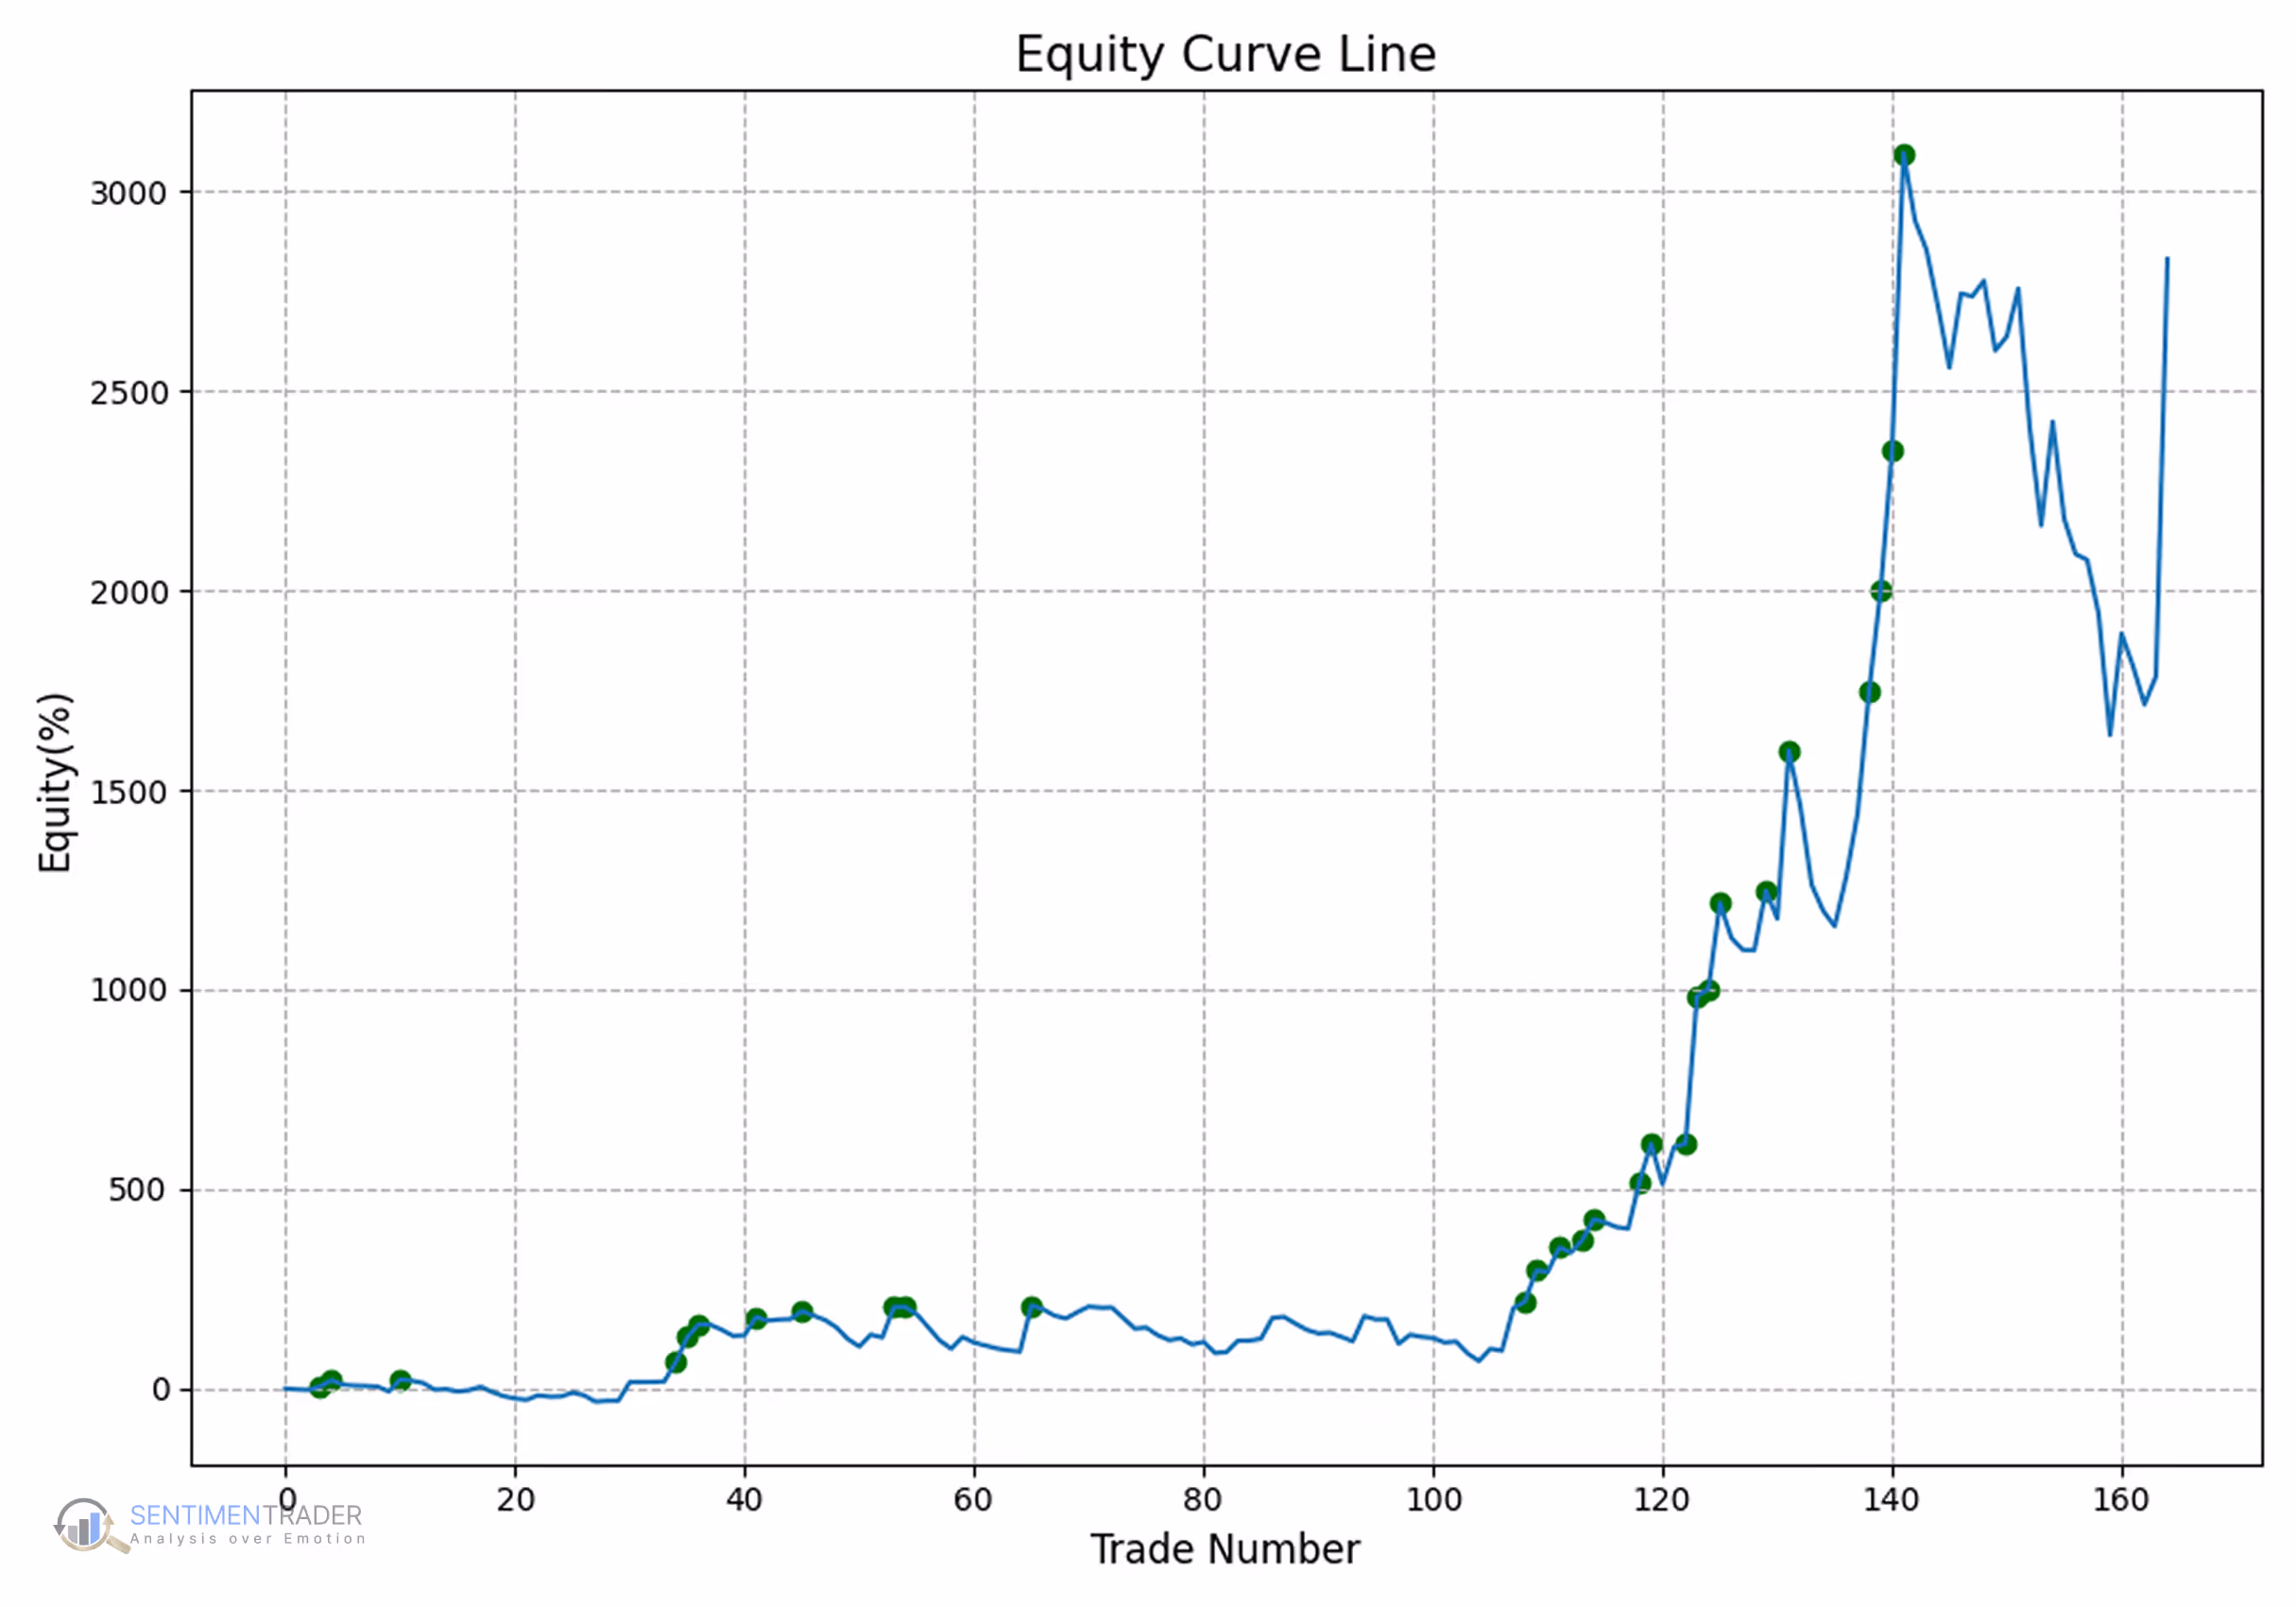
Results over 20 years:
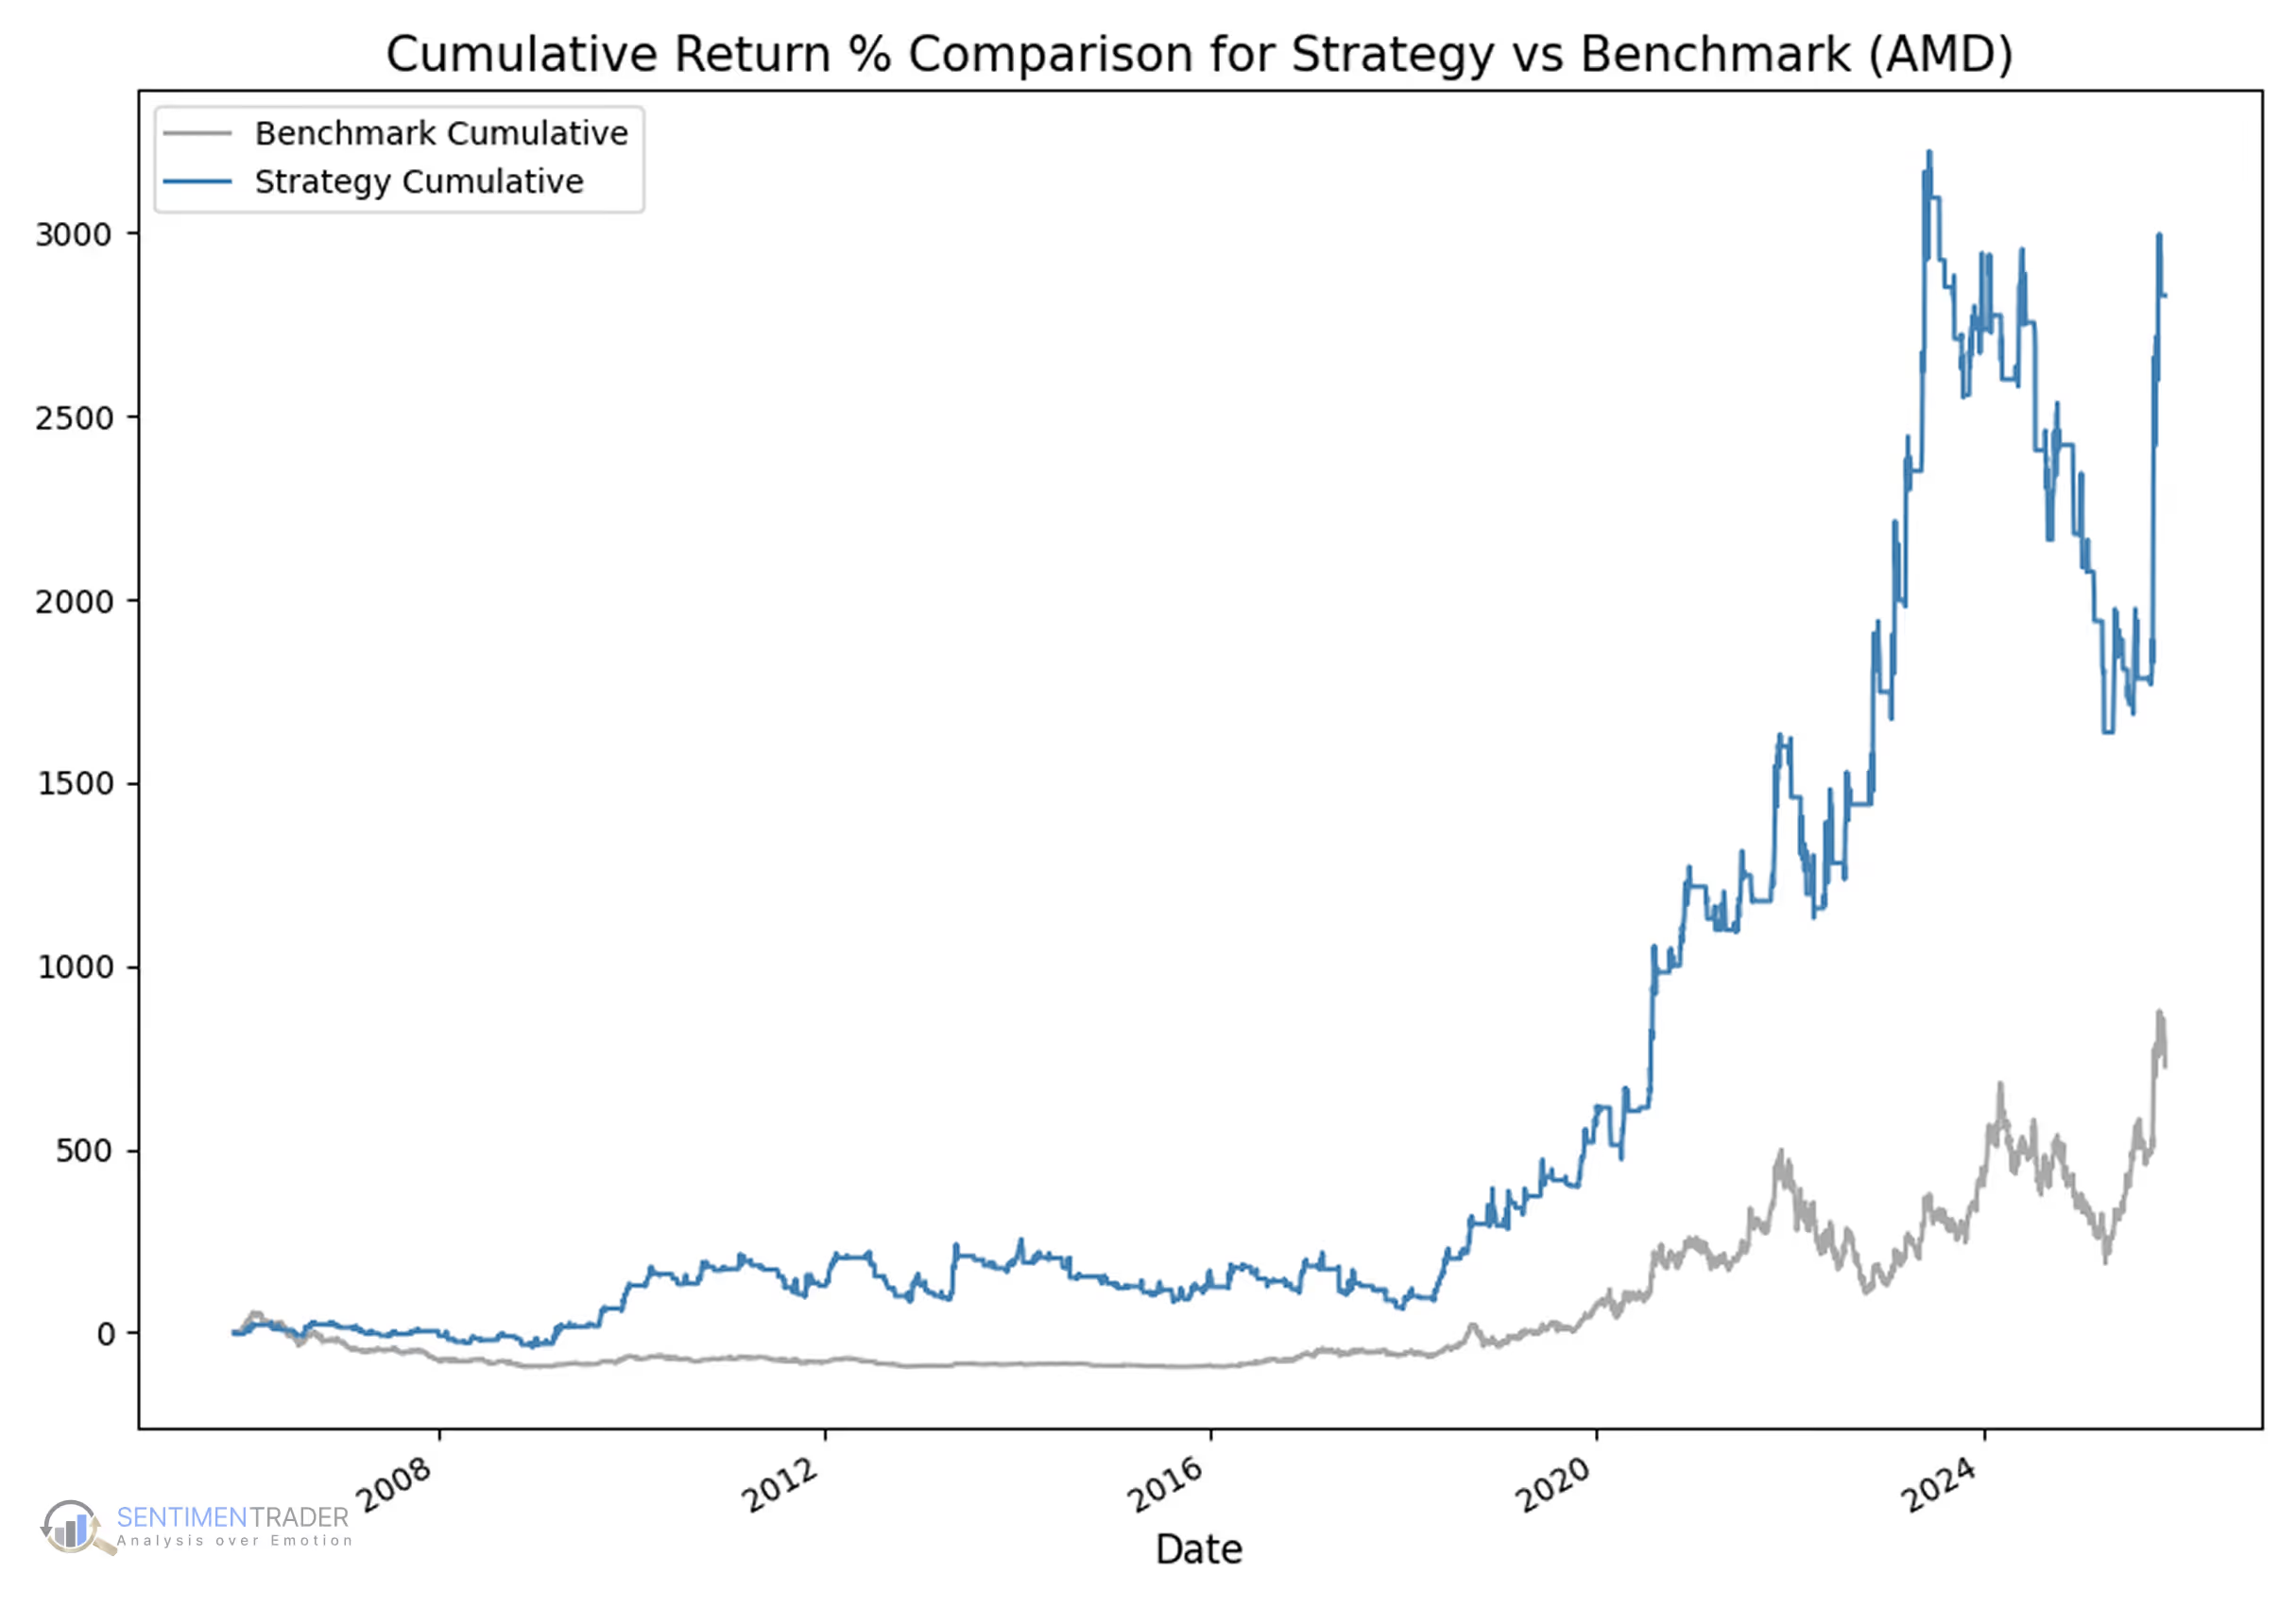
+2,829% total return (vs. +736% for AMD buy-and-hold).
18.4% CAGR, driven by a small number of large trend advances.
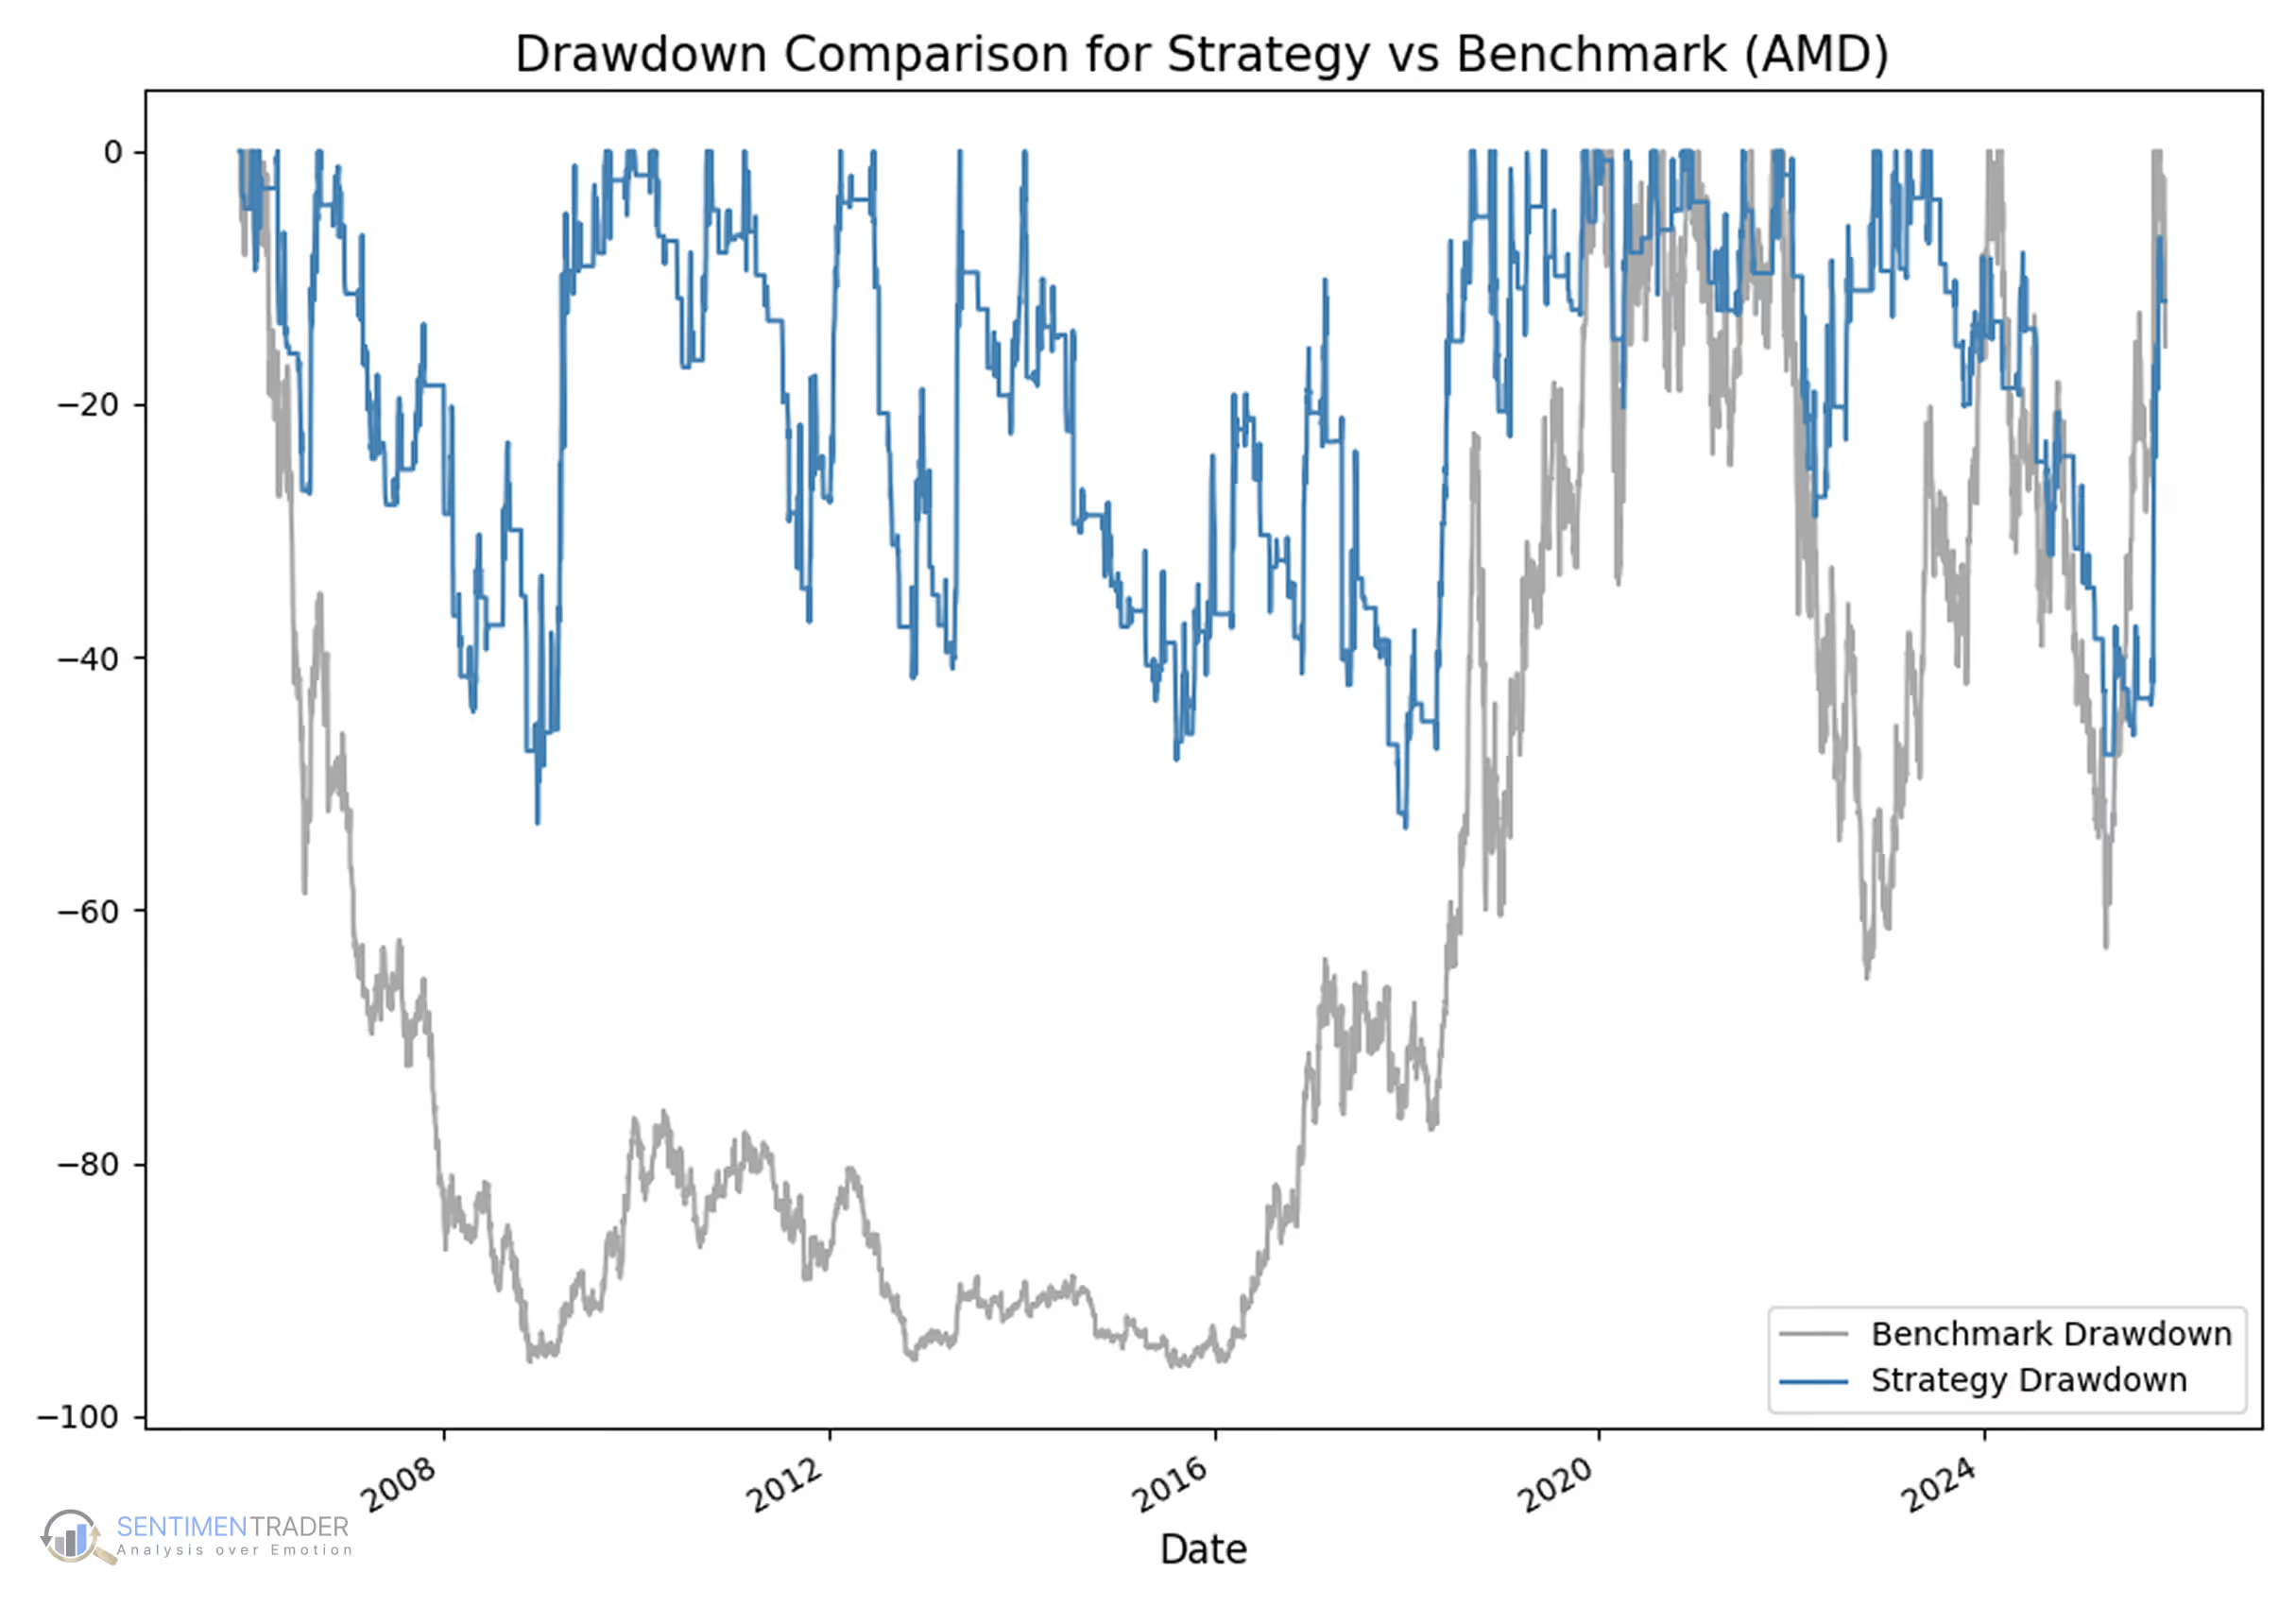
Reduced drawdowns: –53.5% max risk, meaningfully lower than AMD’s historical peak-to-trough declines under buy-and-hold.
Selective exposure: In the market only 37% of the time, reducing participation during extended downtrends.
Takeaway: Even though Linear Regression Forecast produces many small losses and doesn’t capture every move, it has historically helped traders stay aligned with major trend phases while reducing exposure during prolonged sideways or declining markets. Its strength lies in identifying when price is behaving in line with a statistically defined trend, rather than timing short-term reversals.
This backtest was run using SentimenTrader’s Proprietary Backtest Engine, which lets you test your strategy with nearly 100 technical indicators and over 17,000 proprietary sentiment indicators—no coding required.
The Technical Bit
Calculation and components
The Linear Regression Forecast builds on the basic linear equation:
y = mx + b
Where:
The indicator calculates the regression line that best fits price data over a specified lookback period (e.g., 14 bars) using the least squares method.
On each new bar, it then projects this line forward by F bars (the user-defined forecast period, e.g., 5 bars) and plots that projected value. The result is a continuous, adaptive line showing where the trend is statistically expected to be F bars ahead.
Quick note on Least Squares: This statistical technique finds the line that minimizes the sum of squared differences between actual and predicted values — ensuring the best fit for trend estimation.
What This Means for Traders
Linear Regression Forecast turns a classic statistical concept into a trading tool — quantifying trend direction and projecting its path forward. It helps traders visualize expected price zones and measure how far current prices have wandered from the trend.
Still, LRF is not a crystal ball. It assumes linear relationships and can struggle in volatile or sideways markets where price swings are non-linear. That’s why traders often combine it with indicators from other categories — for example, RSI (Momentum) to gauge short-term strength or exhaustion, OBV (Volume) to confirm participation, or Bollinger Bands (Volatility) to assess whether prices are stretched beyond normal ranges.
When used together, these indicators offer a statistically grounded view of whether price is following its expected path or deviating from it significantly.


.png)