SentimenTrader Indicators
Gain market insight from 30,000+ market and asset-level data series, including 4,000+ market-level indicators and 26,000+ stock and ETF-level sentiment (Optix), trend, and volatility series. From proprietary measures like Optix Scores, Trend Scores, and Risk Models to trusted market sentiment benchmarks like AAII Bulls, Put/Call Ratios, and Fear & Greed, our library gives you both exclusivity and transparency.
Our Popular Proprietary Indicators and Charts
Integrate SentimenTrader’s complete library of proprietary sentiment, technical, and macro indicators directly into your platform, spreadsheet, or research system. Perfect for systematic traders, quants, and institutions needing accurate, daily-updated market data.
Smart Money vs. Dumb Money Confidence
Track positioning and confidence spreads between informed investors and crowd-driven traders to gauge market sentiment extremes.
Optix Indicators
(Equities, Bonds, Commodities, Crypto)
Proprietary Optimism Indexes (Optix) for every major ticker — including SPY, QQQ, Gold, Bitcoin, and US Dollar — to measure optimism vs. pessimism at the asset level.
Trend Scores (Absolute & Relative)
A composite trend model that scores assets and sectors from 0–10 based on moving averages and momentum strength — helping you instantly identify leaders, laggards, and sector rotation.
Risk & Probability Models
Tools like the Bear Market Probability Model, Bond Risk Levels, Gold Risk Levels, and Aggregate Signal Model quantify potential downside and risk appetite shifts.
Behavioral Sentiment Models
Fear & Greed, Panic/Euphoria, Excess Optimism/Pessimism Spreads, and Advisor/Investor Models to monitor emotional extremes and contrarian signals.
Macro & Sector Models
STEM, Macro Index Models, and Sector-specific Optix to capture rotation, macro pressure, and cross-asset correlations.
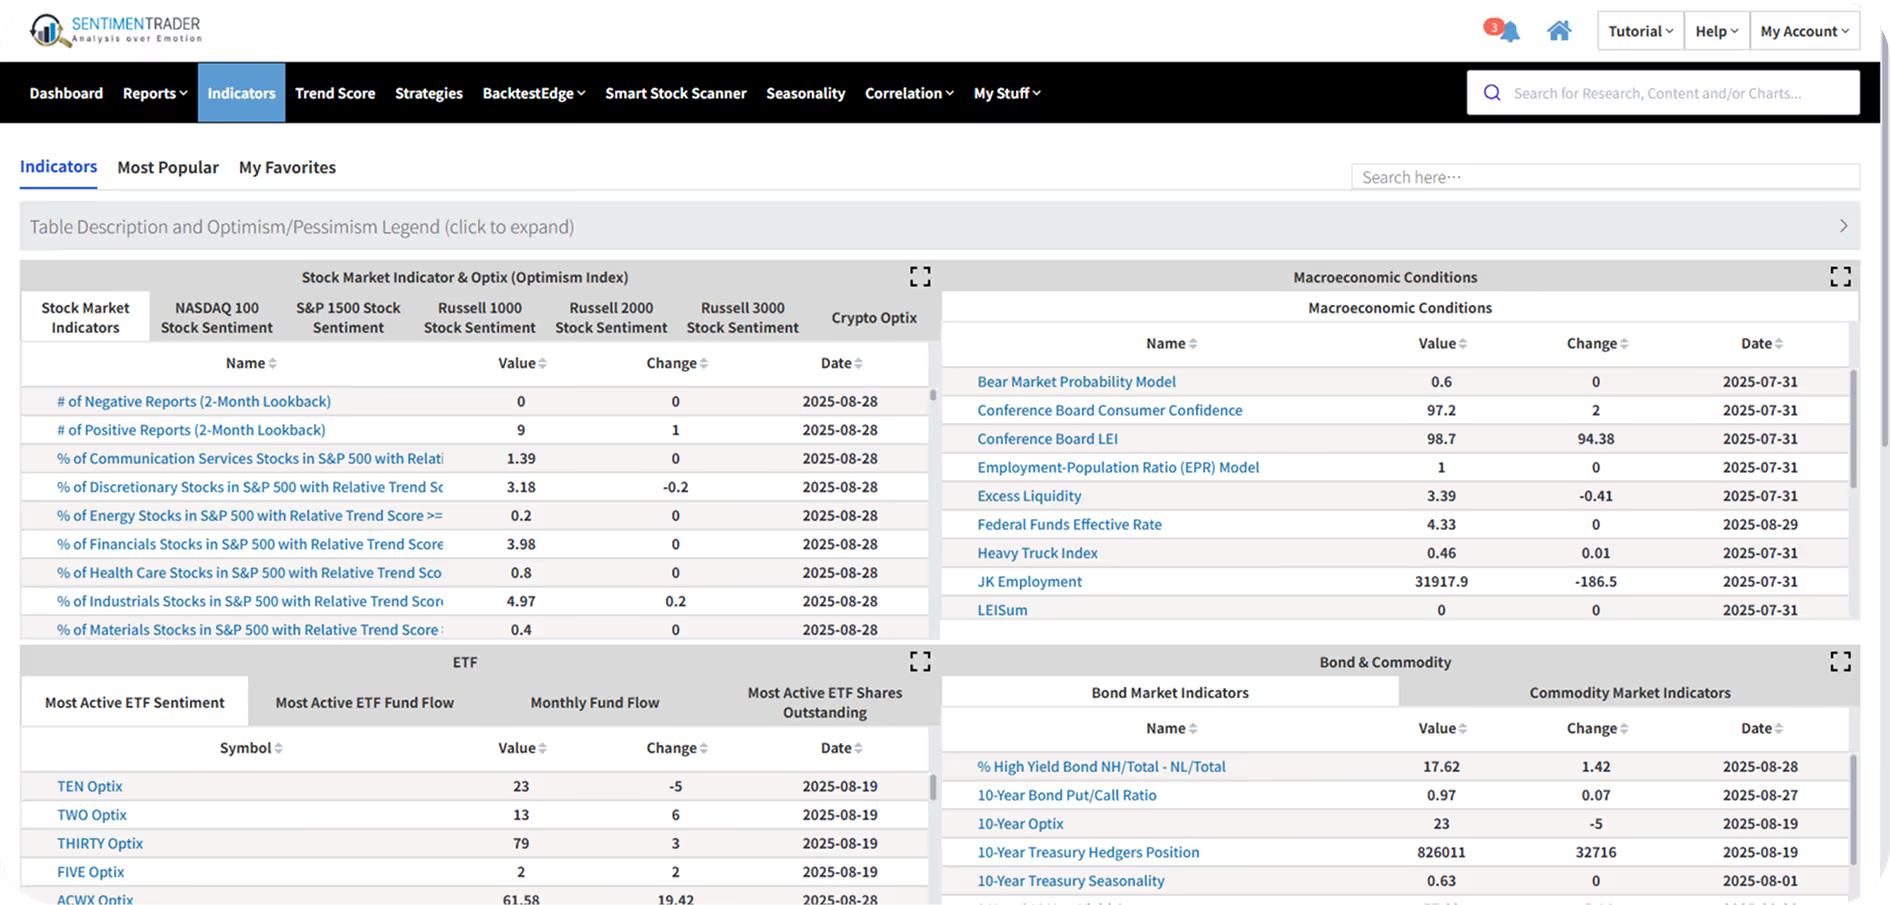
Featured Popular Proprietary Indicators and Charts
Featured Popular Proprietary Indicators and Charts from our library. Click on the
to see more information about the indicator.
Click the icon to see more information about each indicator.
Other Indicators
Aggregate Ratios for all 10 major S&P 500 sectors*
R.O.B.O. Put/Call Ratio™ (one of the purest sentiment Indicators available)*
OEX P/C Ratio (with moving averages)
Options Speculation Index*
Open Interest Ratios for Major ETFs
Risk Reversals for Major Currency Pairs
VIX Transform (transforms VIX into a statistically meaningful chart)*
First Hour/Last Hour Comparison
Last Hour Cumulative Line
Credit Default Swap Index
Gold, Bond, Oil Implied Volatility
NASDAQ/NYSE Relative Volume
S&P 500 Component Correlation
Relative Ratio Ranks for Ipos, Microcaps and more*
28 Panic Breadth Composite indicators*
8 critical metrics each for industries, sectors, countries & gold mining stocks*
HILO Logic Index for NYSE/NASDAQ*
17 metrics each for popular ETFS, sectors and global indexes*
Cumulative Tick for NYSE/NASDAQ*
Advance/Decline Ratio for NYSE/NASDAQ/High-Yield Bonds
SPY and QQQQ Liquidity Premium*
New High/New Low Ratio for NYSE/NASDAQ/High-Yield Bonds
S&P and NDX Down Pressure*
UP Issues and Volume Ratios for NYSE/NASDAQ
S&P and NDX Price Oscillator*
ARMS Index (TRIN) for NYSE/NASDAQ
Percentage of Fidelity Select Funds Beating Cash*
McClellan Oscillator & Summation for NYSE/NASDAQ/High-Yield Bonds
David S&P 500 Aggregate Baskets*
Proprietary Optimism Index (OPTIX) Scores for Commodities*
NAAIM Survey Of Active Investment Managers
Consumer Confidence with % Expecting Rising Markets
Hedge Fund Exposure for Stocks/Bonds/Gold/Dollar*
Pension Fund Allocations*
Wall Street Strategist Asset Allocation
Soft vs. Hard Economic Surprises
Wall Street Analyst Net Price Upgrades
N.F.I.B. Small Business Optimism
JK Bond Cycle Thermometer*
Domestic & Foreign Equity Flow
Domestic & Foreign Bond Flow
Margin Debts/Credits/Available Cash
Retail Money Market Assets
Number of IPO & Secondary Offerings
Equity/Money Market Asset Ratio
Penny Stock Trading Volume
Foreign Investment in US Equities
Monthly Fund Flows for Broad ETF Categories
Daily Fund Flows for more than 45 ETFs
Bear/Bull Social Sentiment indicators for active ETFs
Bearish Percent Social Sentiment indicators for active ETFs
Bullish Percent Social Sentiment indicators for active ETFs
Optimism Indexes for 30+ Commodities/Currencies/Bonds
Commitments of Traders Data (including Hedgers, Speculators and % of Open Interest)
Detailed Seasonality Charts
Sentiment Cycle Discouragement*
Sentiment Cycle Enthusiasm*
Sentiment Cycle Returning Confidence*
New Housing Sales (Total)
Federal Funds Effective Rate
Equity Yield Advantage Ratio(EYAR)*