Why the Equity Put/Call Ratio Matters
The Equity Put/Call Ratio offers a window into the crowd’s real-money expectations. As investors hedge or speculate with options, their collective behavior reveals whether fear or greed is dominating market psychology.
Clarity: Quantifies how option traders collectively position for risk or reward through their preference for puts versus calls.
Context: Reveals when investor sentiment has swung toward excessive fear or confidence relative to history.
Insight: Serves as a contrarian lens — extremes in crowd emotion often mark turning zones in short-term market sentiment.
How Traders Use the Equity Put/Call Ratio
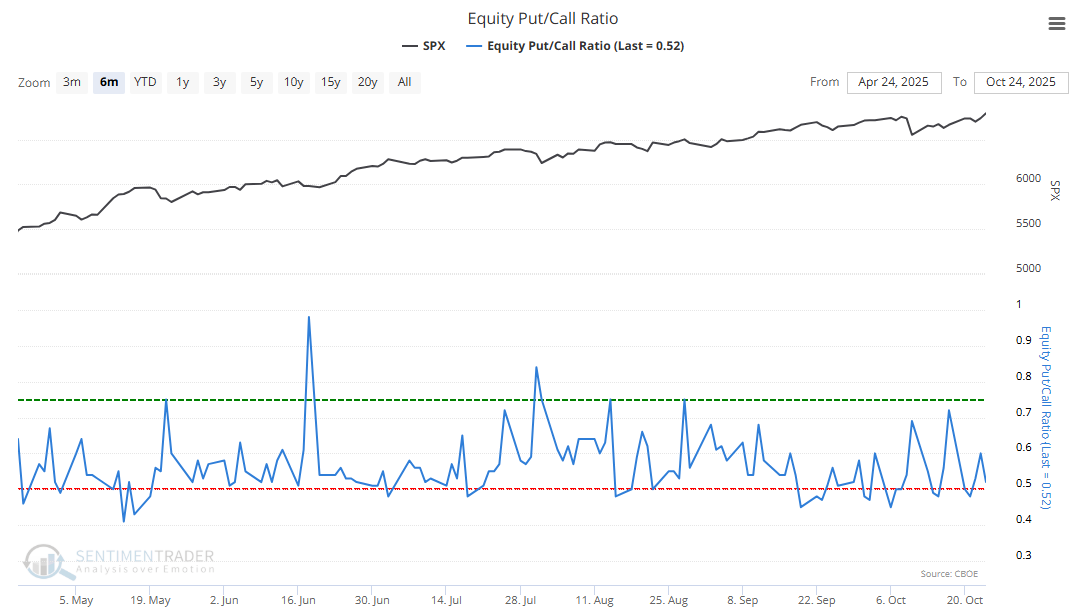
High Readings (Above ~0.75): Indicate heavy put buying and elevated fear. Historically, such levels often appear near short-term market lows.
Low Readings (Below ~0.45): Suggest widespread optimism and strong call demand, conditions that can precede short-term pullbacks or consolidations.
Neutral Zone (~0.45–0.75): Reflects balanced sentiment and tends to coincide with trend continuation phases.
The Technical Bit
Calculation and components
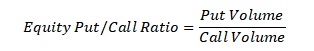
The Equity Put/Call Ratio is calculated by dividing the daily volume of put options by the daily volume of call options traded on individual equities at the CBOE:
Put Options give traders the right to sell a stock at a fixed price. They’re often used to hedge or profit from anticipated declines.
Call Options grant the right to buy a stock at a fixed price, typically used to benefit from expected gains.
Since most options are bought to open rather than sold to open, total volume largely reflects investor conviction. When puts dominate, fear is elevated; when calls dominate, optimism prevails.
This ratio can fluctuate sharply day to day, so smoothing it with a 10-day or 20-day moving average helps reveal underlying sentiment trends rather than short-lived spikes.
What This Means for Traders
The Equity Put/Call Ratio translates raw options activity into an intuitive sentiment gauge — revealing when traders are more focused on protection or speculation.
Extreme readings don’t pinpoint exact turning points but can highlight moments when collective emotion has swung too far in one direction. Many traders combine this ratio with trend or volatility indicators (such as Moving Averages or the VIX) to confirm whether price action supports or contradicts prevailing sentiment.
This indicator is updated daily and available on SentimenTrader’s platform, where it can be explored with SentimenTrader’s Proprietary Backtest Engine alongside other sentiment and behavioral measures to study how investor emotions have historically aligned with short-term market shifts.