
TradingEdge: Questionable price and breadth action, with a jump in speculation

This is a recap of the most notable research published during the week. Price and breath action wasn't great, and while there are a few positive signs popping up, most of what we've seen has suggested flat prices at best in the coming weeks to months. The most distressing sign is a massive jump in speculative trading activity by small options traders (see the bottom of this post).
If there is a piece of research that hadn't been published by Friday, then you'll see a [NEW] tag.
The indexes rallied hard, but...
Stocks rallied hard over the medium-term despite being in a long-term downtrend. This set up an important battle between time frames. Usually, the longer-term environment has won out, at least over the short- to medium-term.
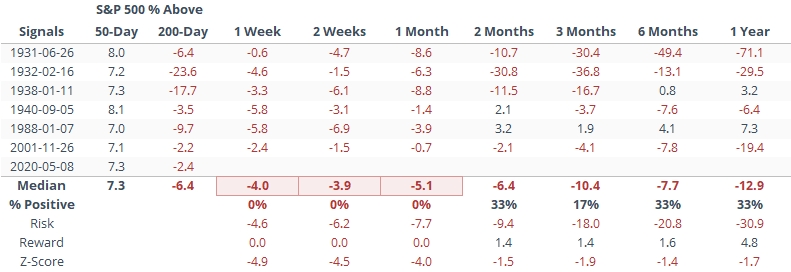
Below, we can see every date since 1928 when the S&P traded at least 7% above its 50-day average while failing to rally to within at least 2% of its 200-day. Prospects were not great over the next 2-12 weeks. Average returns were bad, consistently negative, and with a very poor risk/reward skew.
That's especially when stocks fell in the first week after becoming so overbought, which is what happened this week. Over the next few months, stocks remained weak.
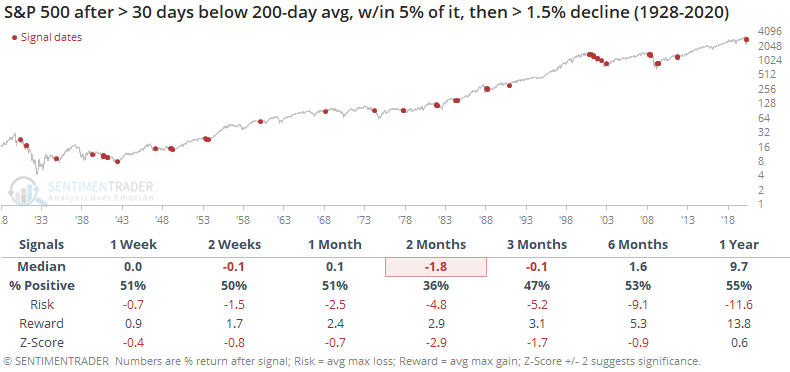
Buyers have tried to push the most benchmarked index in the world above its most widely-watched moving average and failed again. After nearing its 200-day average on Monday, selling pressure kicked in triggering a rejection.
For a 1.5% decline, there were 56 signals. Of those, 82% of them saw a negative return anywhere from 1-12 weeks later.
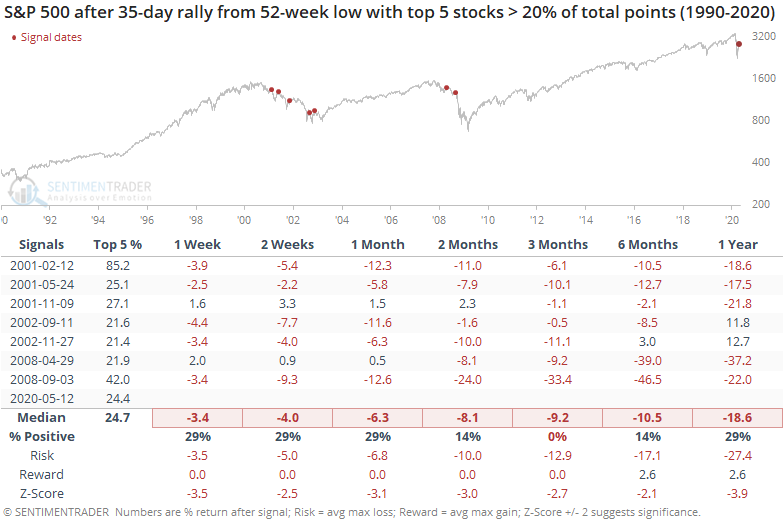
This has been a very top-heavy rally, and that has not been a good sign. Every one of these proved to be a false rally, with the S&P losing ground over the next few months after each one. The risk/reward was horrid.
At 24.4%, the current weighting of the top 5 isn't as egregious as the worst time periods (like February 2001's weight of a whopping 85%) but it's definitely in the top tier.
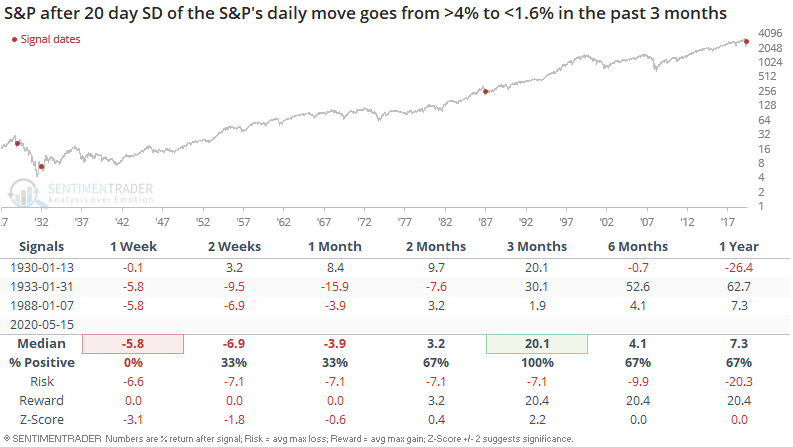
[NEW] Troy notes that the stock market's volatility spiked in March as stocks tanked, and with the S&P 500 swinging sideways now, volatility is falling. This is shown with a 20-day standard deviation of the S&P 500's daily moves:
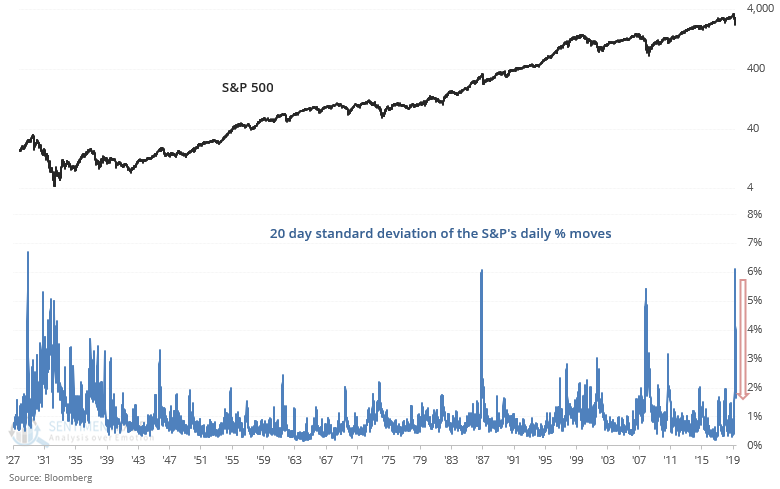
When the 20-day standard deviation went from greater than 4% to less than 1.6%, the S&P had a tendency to pull back in the short-term, regardless of whether the bear market's bottom was in or not. They all showed gains by 3 months later, but one of those was a false rally. The spike in volatility in 2009 didn't trigger because it took longer than 3 months to calm down.
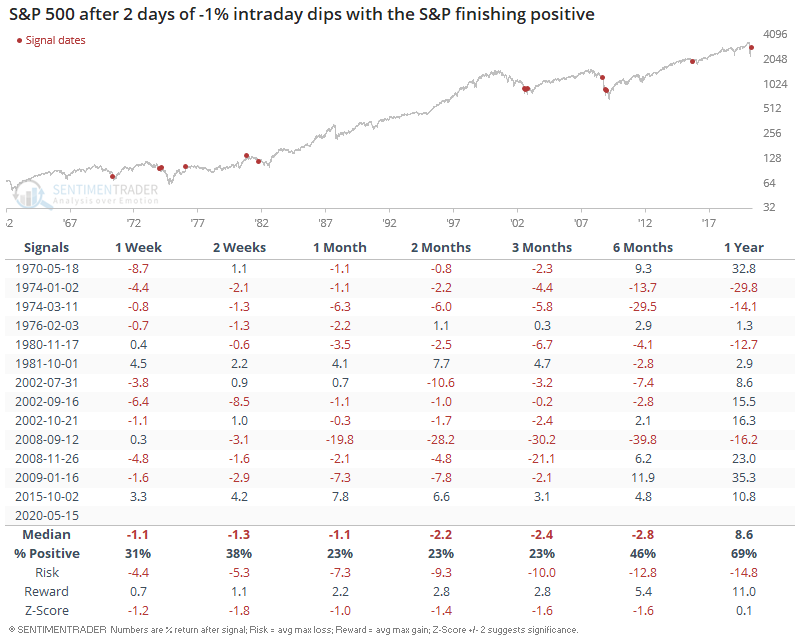
[NEW] Troy shows that market leadership has become narrow, and thus far it seems as if every dip is being bought. But that's not necessarily a bullish sign for stocks. As Bespoke noted, the S&P 500 has experienced 2 days in which the S&P dipped more than -1% intraday yet still managed to close positive.
Such buy-the-dip attempts didn't usually pan out, with stocks exhibiting losses on almost every time frame from the next 1 week to the next 3 months:
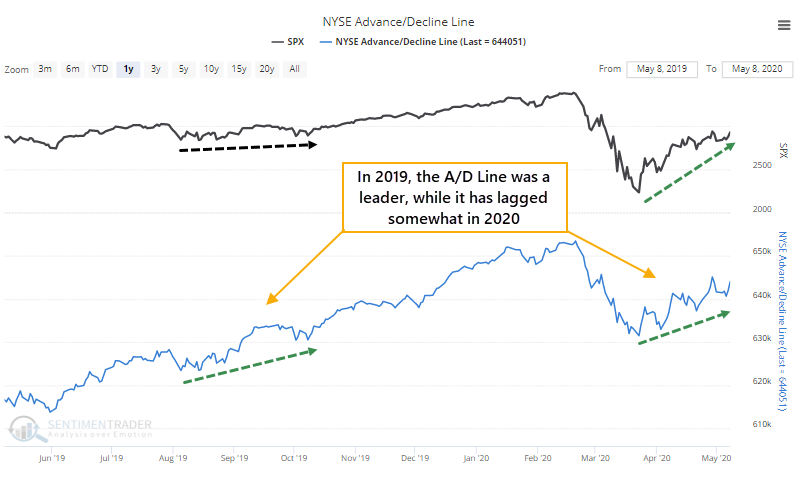
It's not just the indexes
The Advance/Decline Line has lagged, which is another issue.
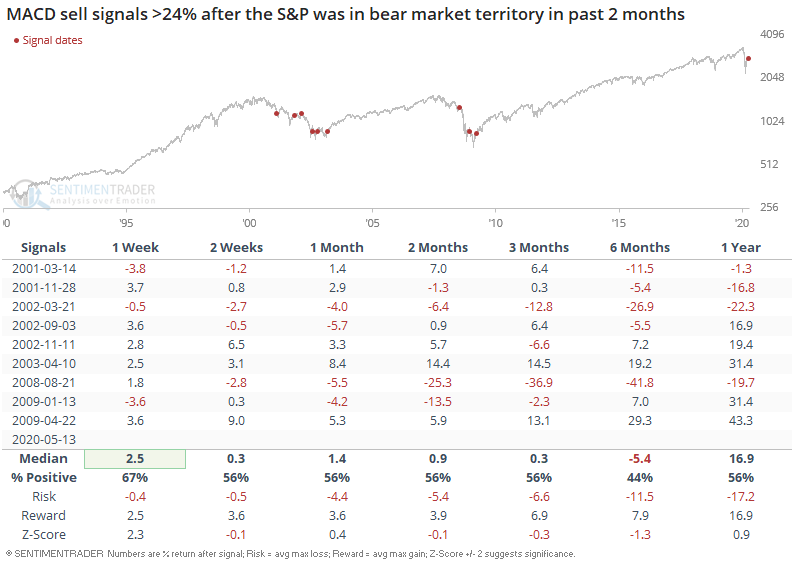
As a result, the percentage of S&P 500 stocks with a MACD sell signal in the past 10 days is starting to creep up,
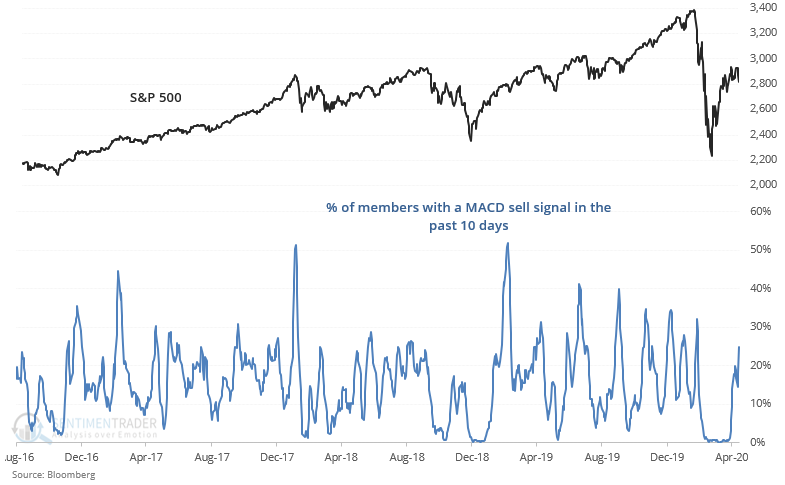
Here's what happened when a rising number of stocks witnessed MACD sell signals while the S&P was recently in bear market territory (-20% below 52 week high) sometime over the past 2 months. Not great.
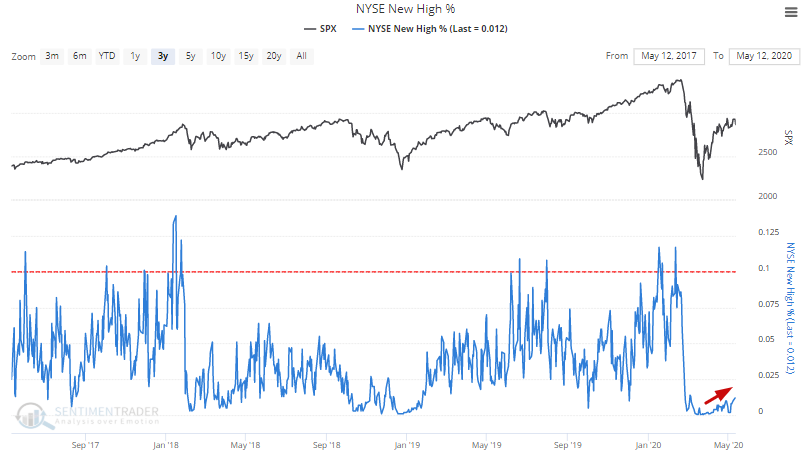
One of the few heavily skewed positives over the past week is that the recent uptrend in U.S. equities has caused the % of issues making new 52 week highs to tick higher. So while many stocks are struggling, there has been some concentrated buying in some of the winning stocks, pushing them to new highs.
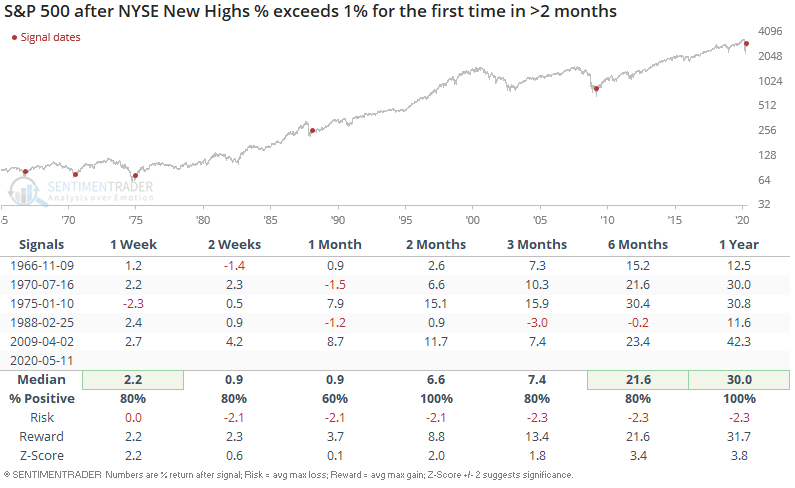
When breadth started to recover after a long streak of virtually no 52 week highs, the S&P 500's returns over the next year were universally bullish. This happened exclusively after major bear markets ended (after 2007-2009 bear market, after 1987 crash, after 1973-1974 bear market, etc):
Sentiment is still giving a very mixed picture
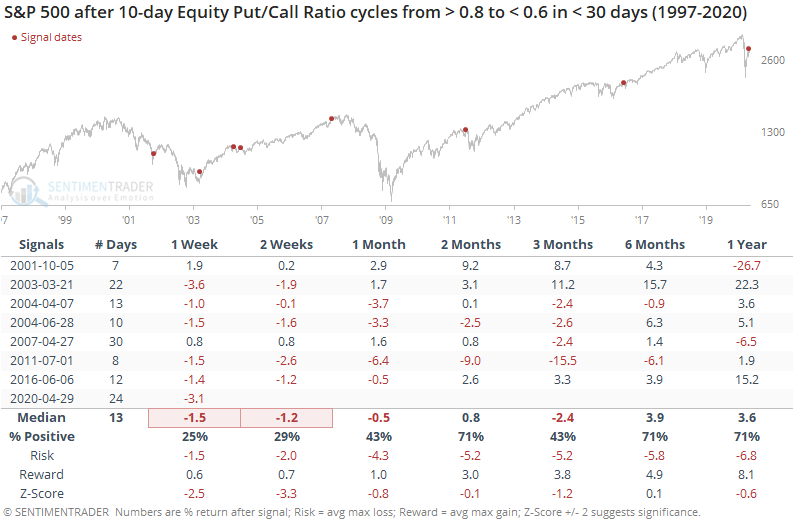
One of the many measures of panic that triggered in March was the overwhelming preference for traders to reach for put options, hedging against the possibility of further losses.
At its peak in March, the 10-day average of the Equity-only Put/Call Ratio neared 1.0, meaning more volume in protective put options than speculative calls. That's one of the highest readings in the history of the data. It has since calmed down and moved well into neutral territory.
Even if we're in a bull market, which is when these quick shifts in sentiment tend to occur, future returns were iffy.
[NEW] Troy shows that the long term picture is murky right now. The University of Michigan Consumer Expectations Index, which looks at how consumers view their own and the economy's financial prospects, tanked 26% over the past 3 months:
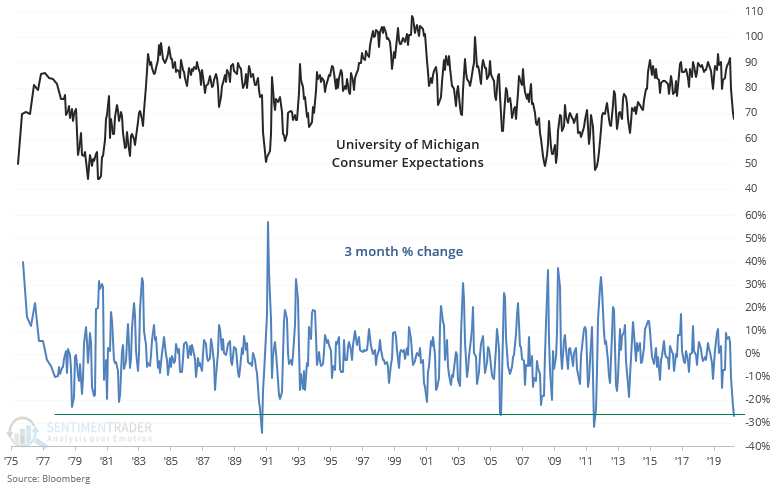
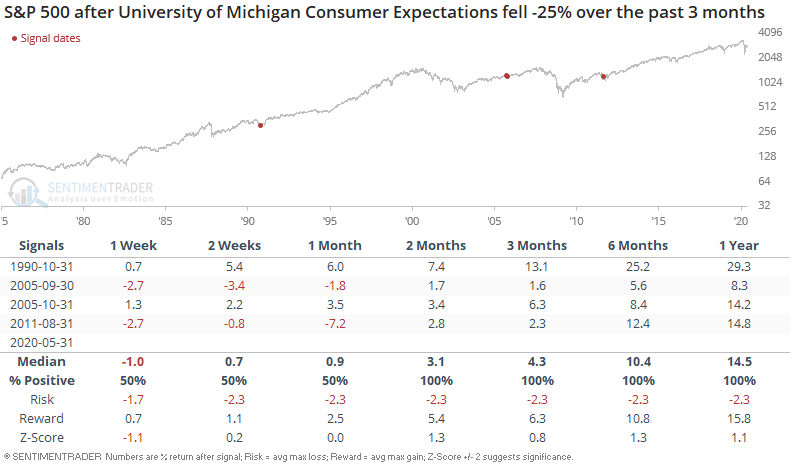
There have been 3 other cases in which expectations about future prospects fell so rapidly, and all 3 led to more gains for stocks over the next 6-12 months:
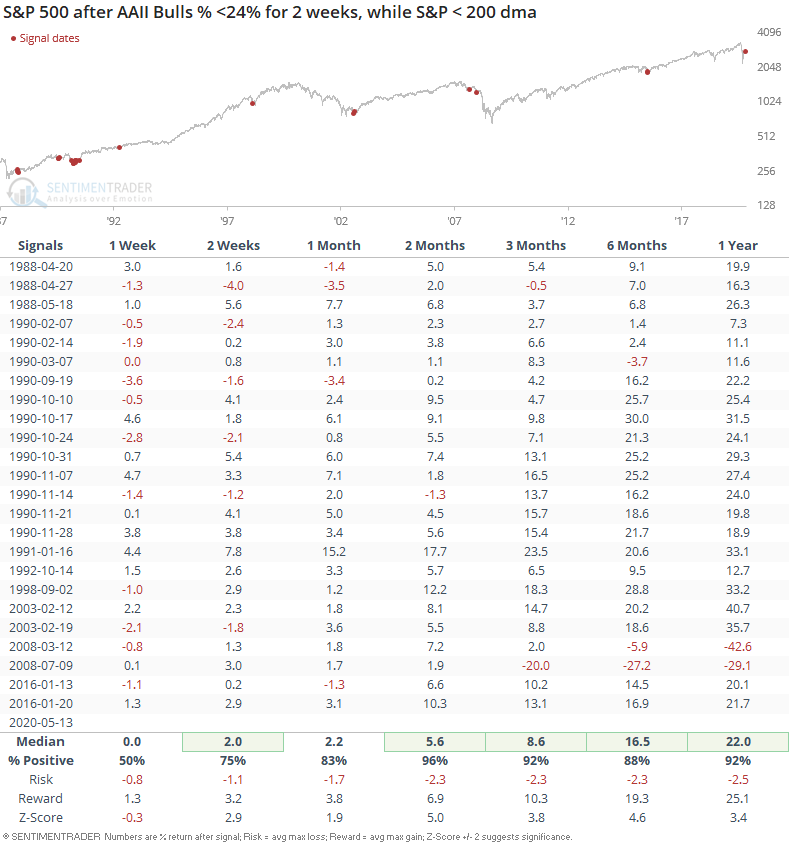
And if we only look at the cases in which AAII Bulls were low for 2 weeks, as it is right now, the S&P's forward returns are still extremely bullish:
It's tempting to think that "insiders" are selling to the herd, because there has been a spike in secondary or add-on offerings, and the Smart Money Flow Index is lagging, but neither one was a consistent factor in the past.
[NEW] So, the AAII survey is suggesting that individual investors are extremely negative. But that's only telling us what people are saying. Sometimes there is a disconnect between what people say and what they do, and that's evident this week.
Despite the survey, small options traders have once again leveraged up betting on a rally. They have opened more than 14.5 million contracts that depend on rising prices (buying calls and selling puts). At the same time, they pulled back on their bearish strategies (buying puts and selling calls). This includes both equities and ETFs.
The difference between them was exceeded only by the week of February 14.
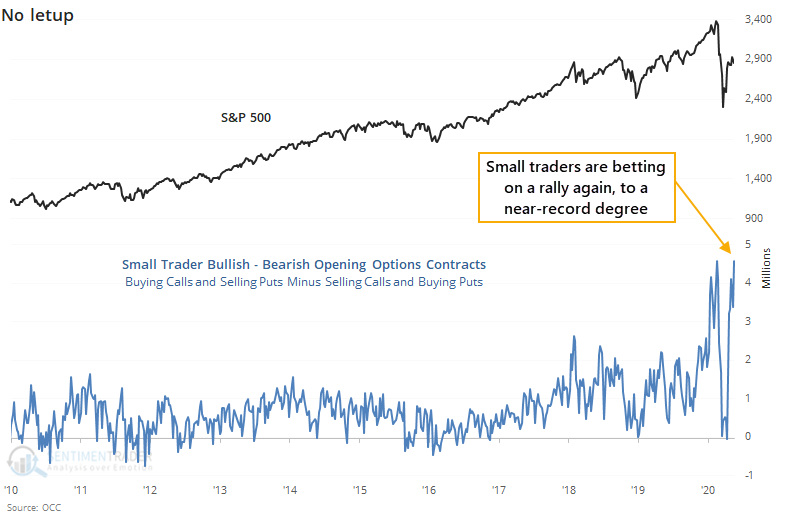
After opening more bearish strategies than bullish ones in late March - early April, they've pulled a complete 180 and are back to extreme, and leveraged, bets on a rally.
There's no indicator we watch that should be more distressing to bulls than this one.
On a medium-term time frame, questionable price and breadth action, combined with evidence of real-money, leveraged bets on a rally by those who tend to be consistently wrong at extremes, seems to be more compelling than the relatively few bullish factors at the moment (like the recovery in new highs and survey-based suggestions of pessimism), suggesting it would be hard to trust a rally in the coming week(s).