
MACD breadth
Breadth indicators are extremely popular among traders because they attempt to convey "the underlying message of the market". One of these is "the % of stocks with a MACD buy/sell signal". Like many indicators, this works decently well on the bullish side but is somewhat questionable on the bearish side.
The % of S&P 500 stocks with a MACD sell signal in the past 10 days is starting to creep up, which is to be expected since stocks fell over the last 2 days. This figure will jump over the next few days if the S&P continues to pull back:
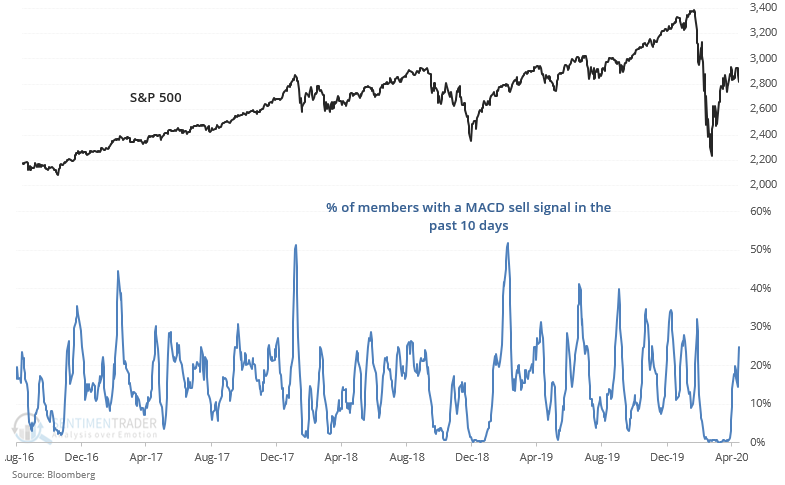
It's easy to make a popular hyperbole-driven argument such as "Almost 25% of Stocks have triggered MACD Sell signals – a significant number of Stocks rolling over. Similar large spikes led to market pullbacks/Volatility, particularly in recent years." The data makes these arguments less convincing:
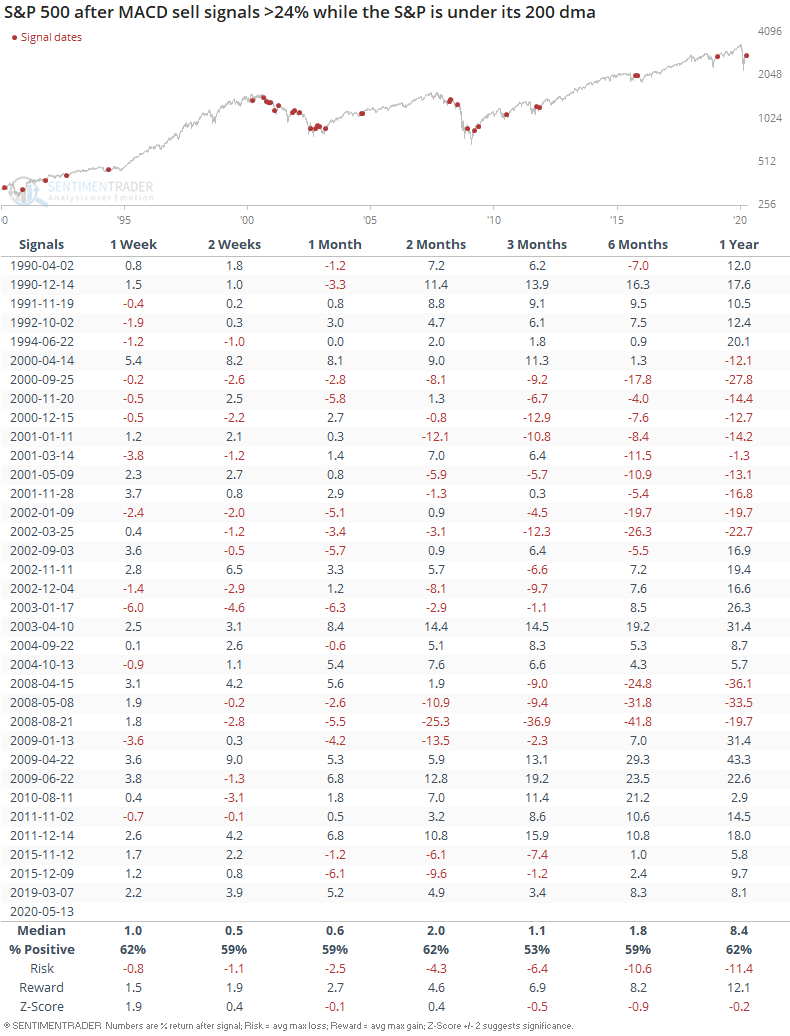
When a rising number of stocks witnessed a MACD sell signal while the S&P was under its 200 dma, the S&P 500's forward returns were more bearish than random, but hardly constituted as giving traders a consistent bearish edge on any time frame:
We can look at this in a different way: here's what happened when a rising number of stocks witnessed MACD sell signals while the S&P was recently in bear market territory (-20% below 52 week high) sometime over the past 2 months:
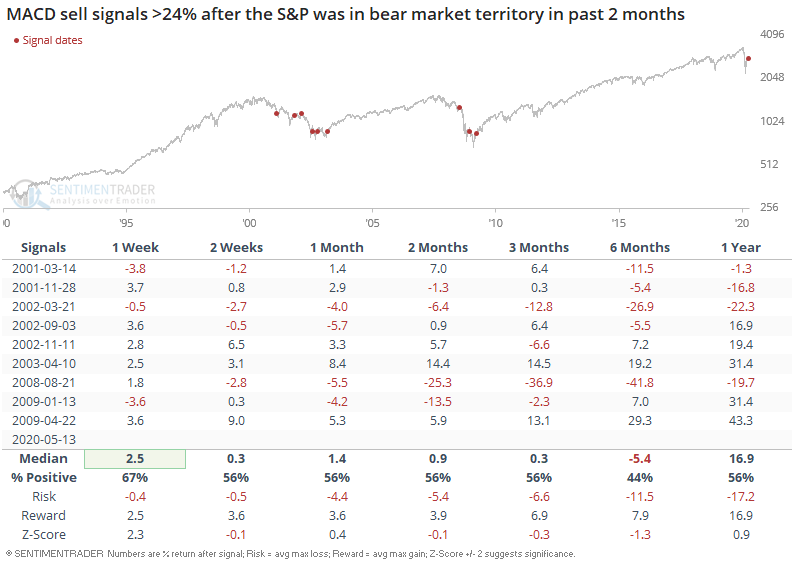
The S&P's forward returns over the next 6 months were more bearish than random, since several of these cases occurred near the top of bear market rallies.