Data &
Technology
Research
Reports
Report Solutions
Reports Library
Actionable
Strategies
Free
Resources
Simple Backtest Calculator
Simple Seasonality Calculator
The Kelly Criterion Calculator
Sentiment Geo Map
Public Research Reports
Free Webinar
Pricing
Company
About
Meet Our Team
In the News
Testimonials
Client Success Stories
Contact
Log inLoginSign up
< BACK TO ALL REPORTS

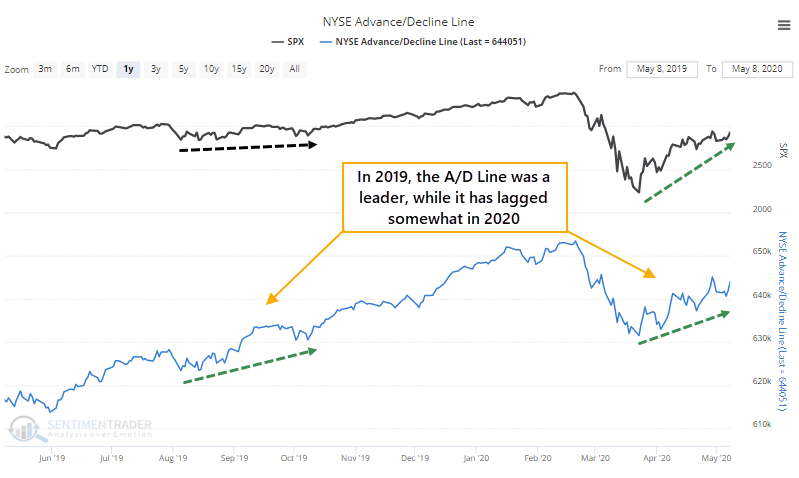
Not much oomph as the Advance/Decline Line lags

Jason Goepfert
2020-05-11
The major indexes have rallied hard off their lows from March. After a couple of initial breadth thrusts, though, overall advance/decline figures have been unimpressive. The Cumulative line on the NYSE is only about 2% off its lows, one of the worst performances relative to gains in the S&P 500 when coming off a 6-month low.

Stocks have been doing very well and approached new highs for the recovery late last week. Well, the indexes did, anyway.

There was a big breadth thrust in the initial kick-off from the low, but since then, there have been more signs that not all securities are coming along for the ride. By Friday, the S&P recovered more than 30% off its low, but the Cumulative Advance/Decline Line for the NYSE hasn't seen nearly as much of a bump. Even the line specifically for the S&P 500 itself has been lagging.

Below, we can see every time the S&P rallied off a 6-month low for 33 days as it has now. But these signals only show the times when the rally in the S&P index was much more than the rally in the A/D Line. For most of these, stocks saw a healthy gain but the A/D Line was barely above its low.

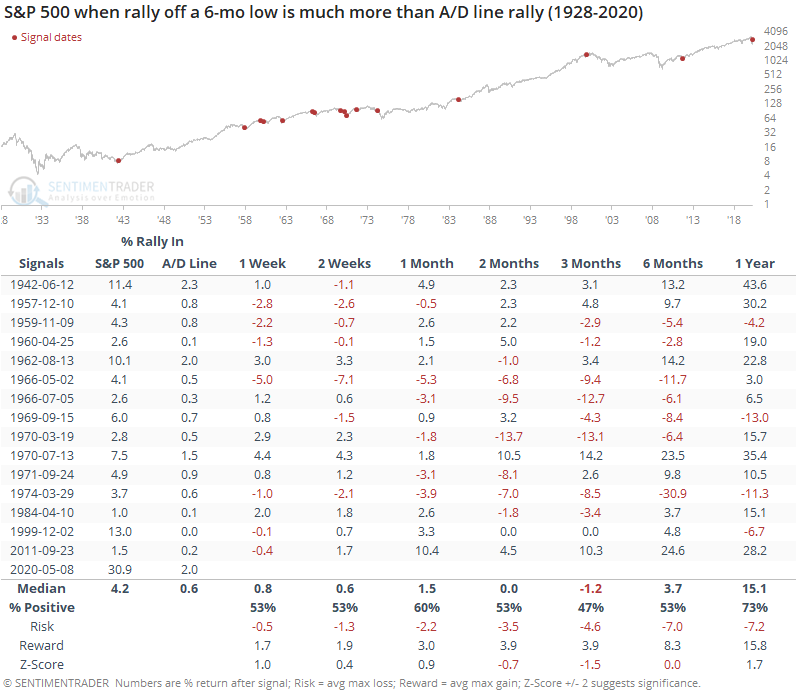
Returns weren't terrible, but over the next three months, the S&P was negative more often than positive, with more risk than reward.

To see if it has made any difference, we can compare the returns after those signals to times when the rally in the S&P was more comparable to rallies in the A/D Line.

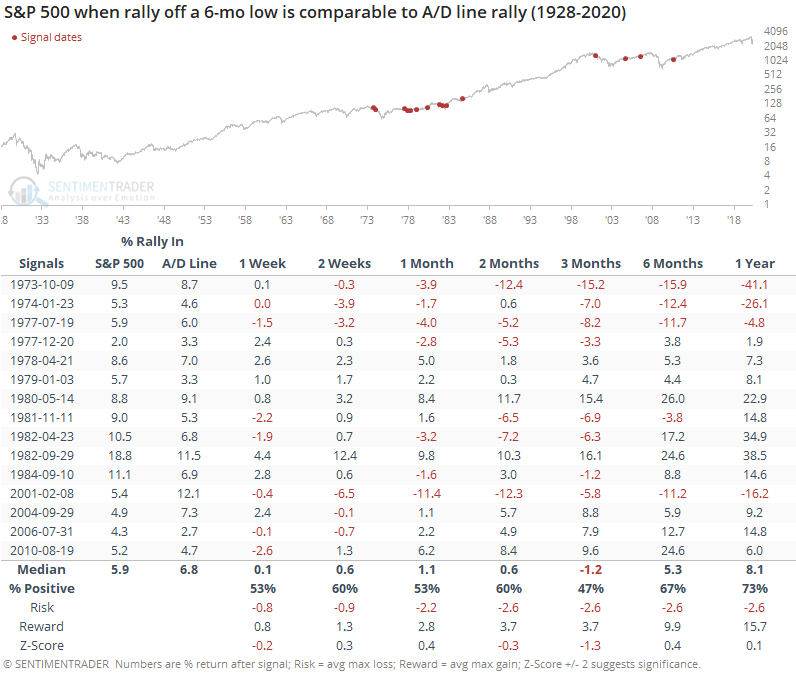
Even though breadth was much better in these cases, and the index wasn't outpacing the average stock by much, returns over the next three months still weren't great. Risk was less than in the first table, but overall returns were still uninspiring.

The reason is simply that stocks had already rallied for a month and a half following a low, so the initial kick of buying interest had mostly been used up. It didn't matter much that the A/D Line was lagging, as forward returns mostly followed the same path. There is a very slight negative skew to the returns following lows when breadth was lagging, but not enough to consider it an outright negative.

Sorry, you don't have access to this report

Upgrade your subscription plan to get access
Go to Dasboard
DATA &
TECHnologies
IndicatorEdge
‍
BackTestEdge
‍
Other Tools
‍
DataEdge API
RESEARCH
reports
Research Solution
‍
Reports Library
‍
actionable
Strategies
Trading Strategies
‍
Smart Stock Scanner
‍
FREE
RESOUrCES
Simple Backtest
Calculator
Simple Seasonality
Calculator
The Kelly Criterion
Calculator
Sentiment Geo Map
‍
Public Research Reports
‍
Free Webinar
COMPANY
‍
About
‍
Meet our Team
‍
In the News
‍
Testimonials
‍
Client Success Stories
Pricing
Bundle pricing
‍
Announcements
‍
FAQ
© 2024 Sundial Capital Research Inc. All rights reserved.
Setsail Marketing
TermsPrivacyAffiliate Program
Risk Disclosure: Futures and forex trading contains substantial risk and is not for every investor. An investor could potentially lose all or more than the initial investment. Risk capital is money that can be lost without jeopardizing ones’ financial security or life style. Only risk capital should be used for trading and only those with sufficient risk capital should consider trading. Past performance is not necessarily indicative of future results.

Hypothetical Performance Disclosure: Hypothetical performance results have many inherent limitations, some of which are described below. No representation is being made that any account will or is likely to achieve profits or losses similar to those shown; in fact, there are frequently sharp differences between hypothetical performance results and the actual results subsequently achieved by any particular trading program. One of the limitations of hypothetical performance results is that they are generally prepared with the benefit of hindsight. In addition, hypothetical trading does not involve financial risk, and no hypothetical trading record can completely account for the impact of financial risk of actual trading. for example, the ability to withstand losses or to adhere to a particular trading program in spite of trading losses are material points which can also adversely affect actual trading results. There are numerous other factors related to the markets in general or to the implementation of any specific trading program which cannot be fully accounted for in the preparation of hypothetical performance results and all which can adversely affect trading results.

Testimonial Disclosure: Testimonials appearing on this website may not be representative of other clients or customers and is not a guarantee of future performance or success.