
TradingEdge: Signs of speculation continue to pop up

This is a recap of the most notable research published during the week.
There are lingering signs of impressive breadth and price recovery, especially in tech, which bode well long-term. But the path to get there looks increasingly rocky. The flattening out of the rally under the 200-day average in the S&P 500, and signs of speculation among mom-and-pop types, are especially worrying.
If there is a piece of research that hadn't been published by Friday, then you'll see a [NEW] tag.
Small traders and "dumb money" are pushing their bets
The rally has been extremely front-end loaded, with a handful of stocks driving the rally. The lack of continued participation among many stocks has helped some longer-term measures, including surveys like AAII, remain in pessimistic territory. Others, usually shorter-term, are showing more optimism.
The biggest issue is just how extreme some of the shorter-term indicators are. When we look at a group of traders who tend to be wrong at emotional extremes, the warning sign is clear.
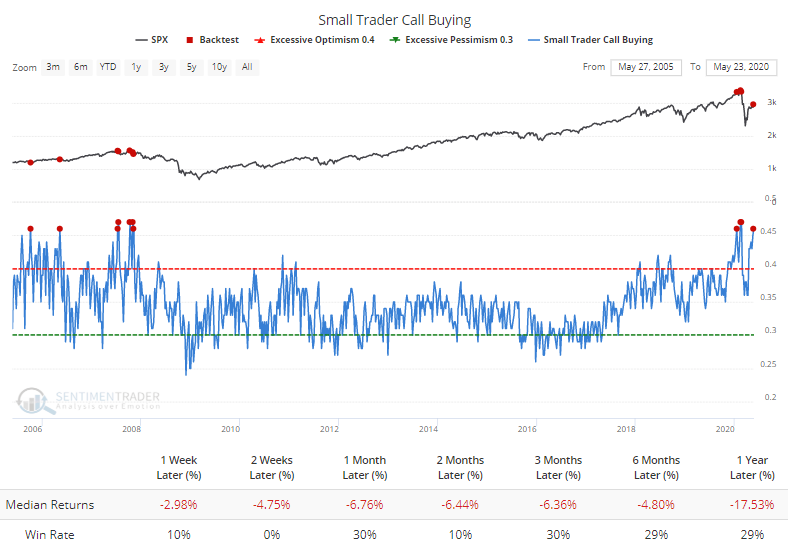
During the week ended May 15, the smallest of options traders, those with trades for 10 contracts or fewer at a time, opened a new record of net bullish positions.
[NEW] They pushed that even further this past week. They used more than 45% of their total volume on buying speculative call options, on par with the highest levels of aggressive betting in 15 years. It has not worked out well for them. According to the Backtest Engine, the S&P 500 declined every time small traders got this bullish.
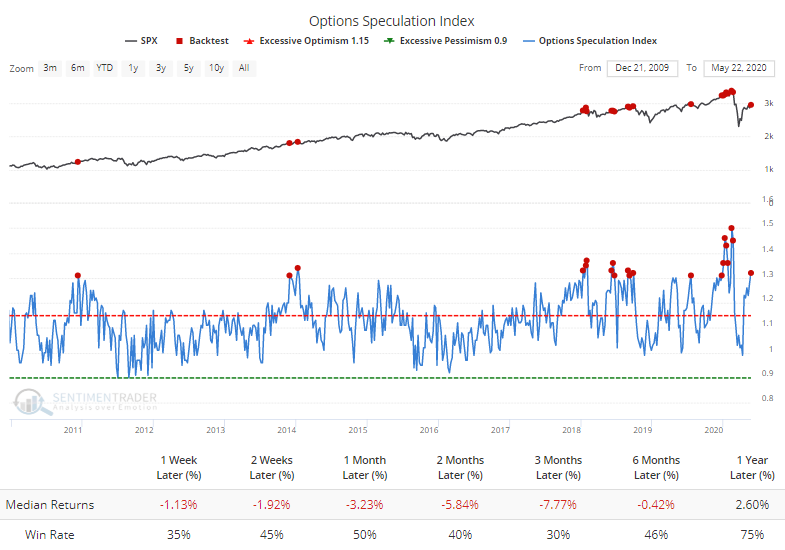
They're not the only ones placing heavy bets on a continued rally. Call buying and put selling was so popular across all traders that it pushed the Options Speculation Index above 1.3, meaning that traders opened 30% more bullish contracts than bearish ones. Again, the Engine shows this has not worked out well when traders across the spectrum were betting so heavily on a rally.
Short- and medium-term sentiment is getting more and more optimistic. Our Dumb Money Confidence Spread is now at 0.59. While this is nowhere near as extreme in January/February, this is typically where a lot of bear market rallies stall.
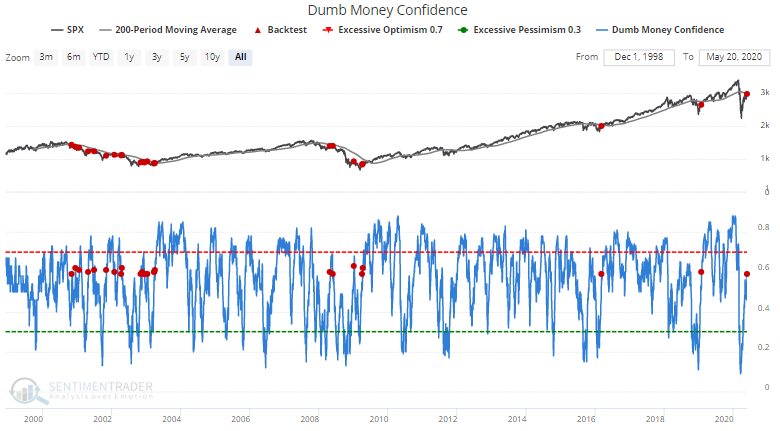
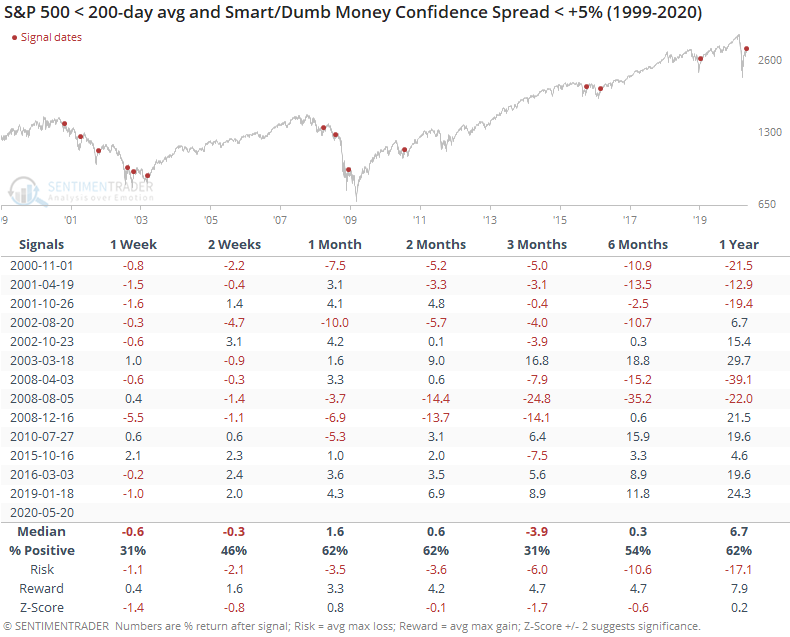
Both Smart Money Confidence and Dumb Money Confidence are both high, which is confusing in itself. Normally, the two move opposite each other. Even so, the spread between them is nearing zero. During bear markets, we start to enter the danger zone when sentiment becomes neutral after bouts of severe pessimism. That's where we are now.
The (very) odd thing is that speculators in index futures, which are on the other side of "smart money" hedgers in equity index futures, continue to press their short bets. Over the past decade, this has been a big positive for stocks. In 2007-08 it was decidedly not. We've been assuming this is a good sign, but it's getting to the point now where it's so unusual we have to doubt it a little bit.
Stocks haven't been able to make much progress
Three weeks ago, the S&P 500 approached its 200-day average for the first time in over a month, and it still hasn't been able to close above it.
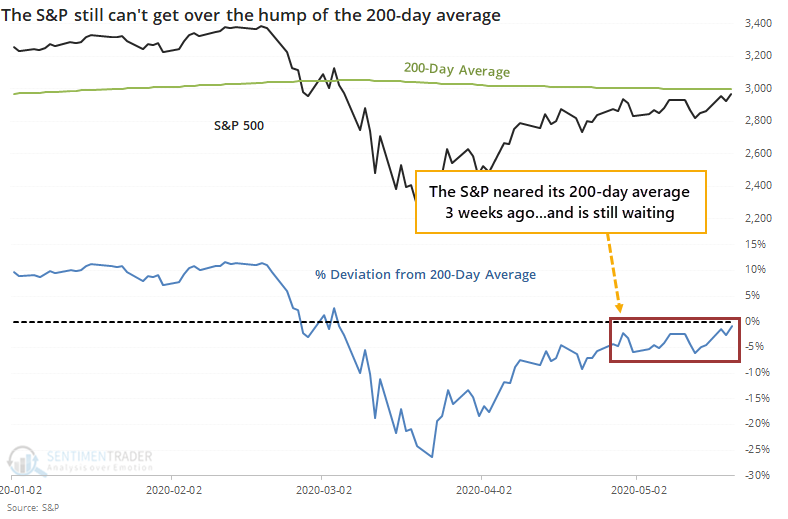
While it's been trapped below its 200-day average, it's still trading above its 50-day, It has been stuck between those time frames for a month.
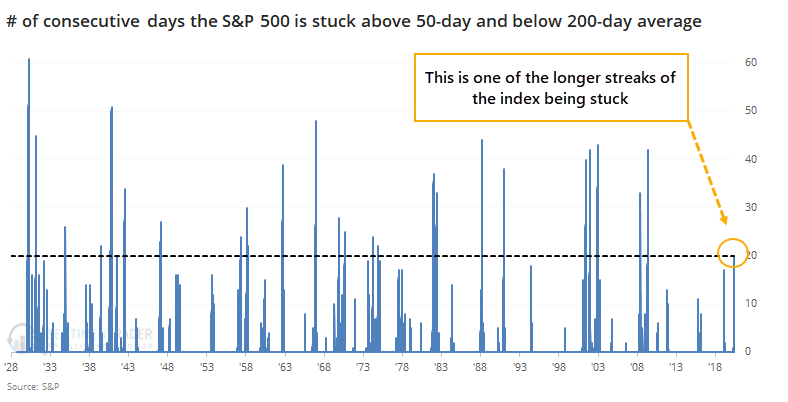
It's kind of a no-win situation. If the S&P broke down below its 50-day, then returns were bad (and terrible in recent decades). If it broke out to the upside, then returns were limited across almost all time frames, with really only one exception in 1970. All of the others either saw losses in the month(s) ahead or failed rallies.
Speaking of the 200-day average, when we go back to 1990 and look for every 40-day period that had the highest correlation to how the past 40 days have unfolded in terms of the percentage of stocks in the S&P trading above their 200-day moving averages.
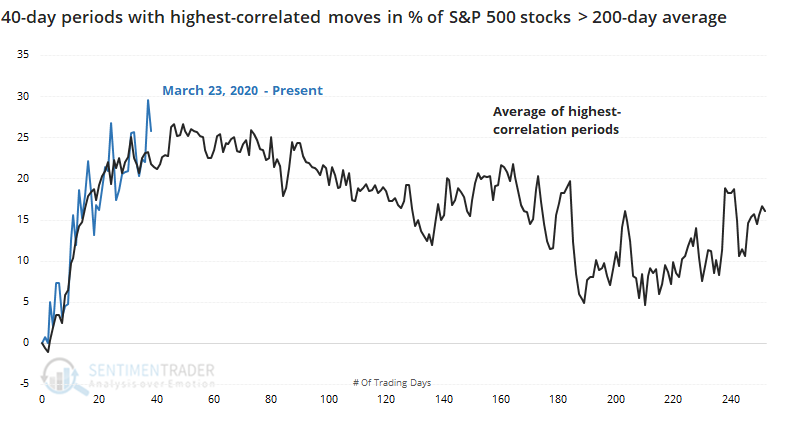
It was a decent sign, especially longer-term. The next 1-2 months were mostly positive, but not exceptionally so. There was a higher probability of seeing a positive return from 3-12 months later, with a perfect record a year later. The average return wasn't that great, about in line with random, but the risk/reward skew was healthy.
While it might not be the slam-dunk positive it was if we rely on the 2009 template, it does suggest a modest upside bias long-term.
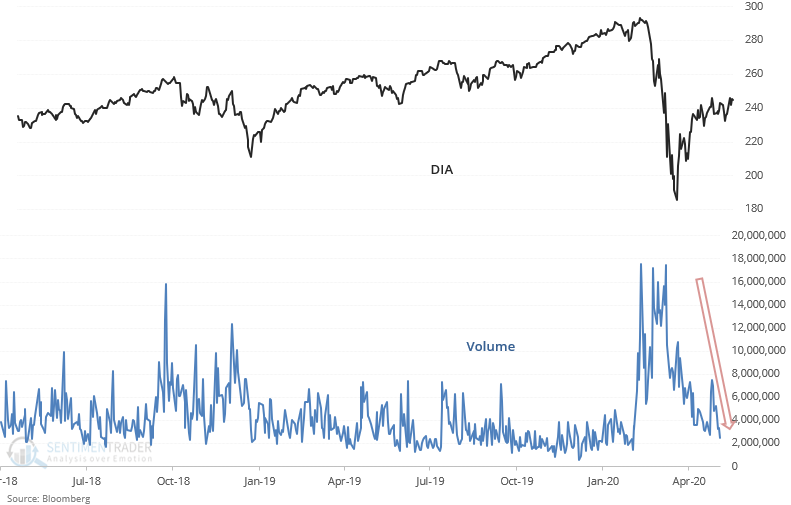
[NEW] Troy notes that the broad U.S. stock market and many other stock indices around the world have gone nowhere over the past 3 weeks. The lack of a clear direction has occurred along with a significant drop in volume.
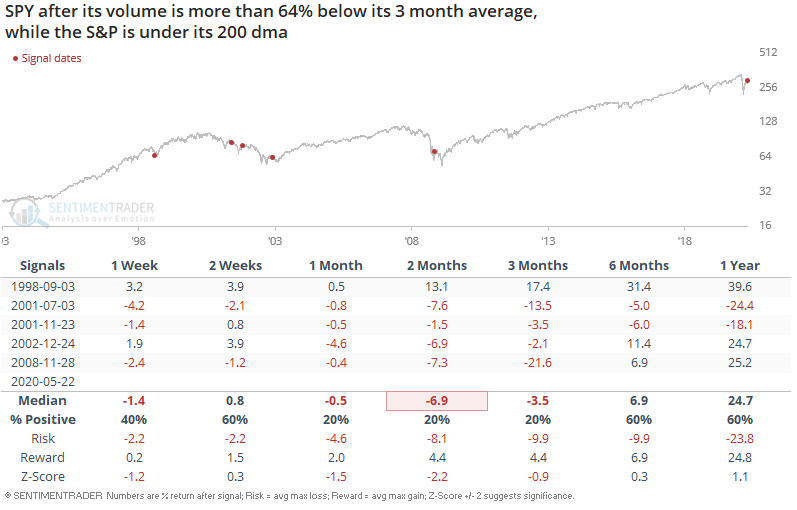
This is normal - volume spikes on market crashes and fades on market rallies. SPY's volume has fallen to a multi-month low and is now more than 64% below its 3-month average:
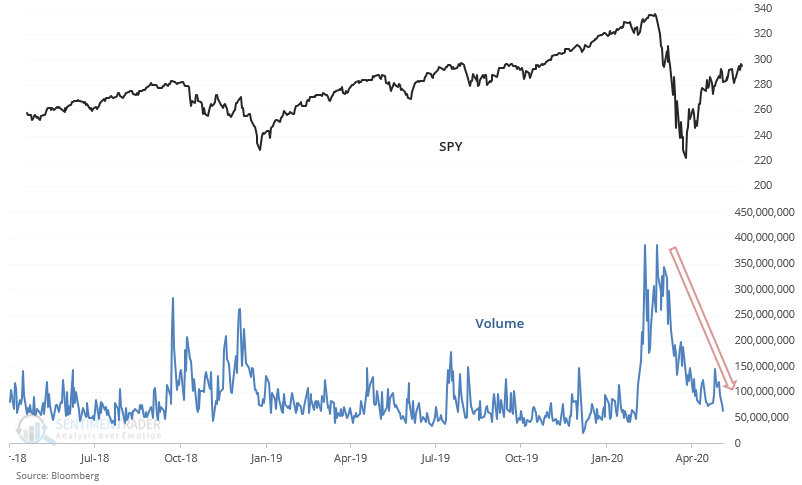
When this happened in the past, SPY's returns over the next 3 months were worse than random, especially while SPY is under its 200 day moving average. From 2000 - present this consistently led to a pullback over the next 2 months as this marked the peak in bear market rallies:
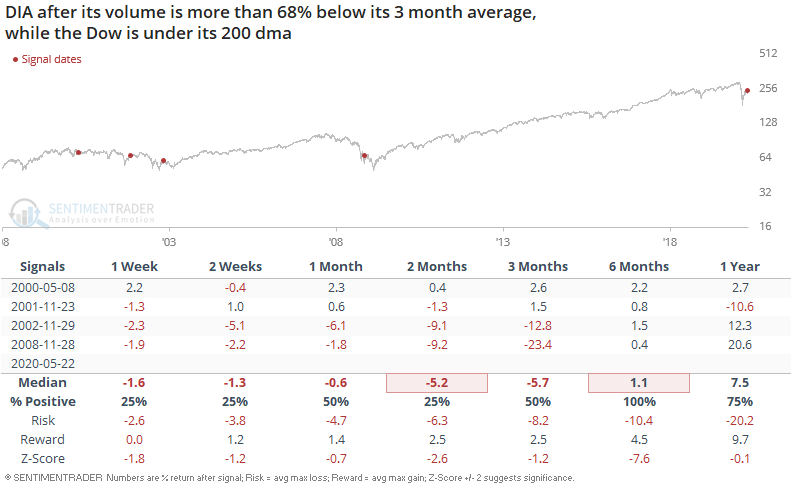
DIA's volume is also falling after a spike in March:
Historical cases that occurred while the Dow Jones Industrial Average was under its 200-day average often led to short term market pullbacks:
The surge on Monday helped to curl the S&P 500's 200-day average higher, the only major market to see that. Among others, for the first time in months, less than half of major world equity indexes are in a bear market.
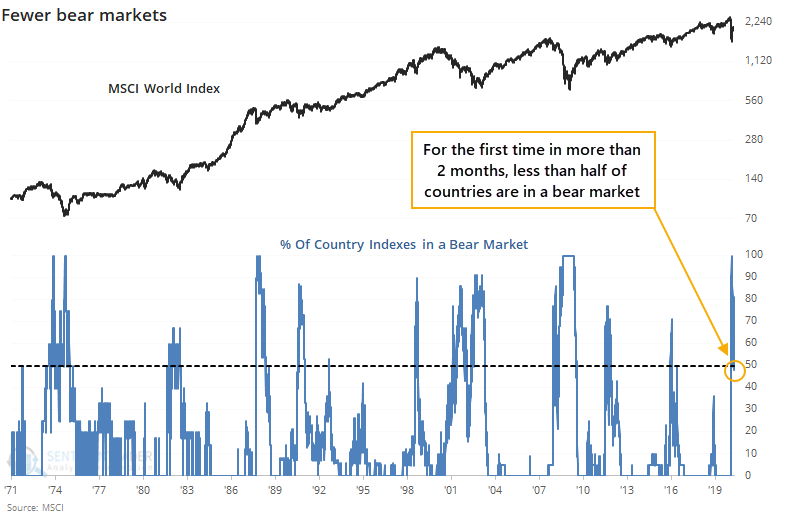
It proved to be a false start too many times to consider it a positive now. Most of the time, the successful signal was the 2nd or 3rd one after a protracted decline. Or even if there was only a single signal, the World Index didn't typically take off on a sustained rally right away. It showed a gain 81% of the time a month later, but only 44% of the time after three months.
Growth stocks have massively outperformed value stocks during the current stock market rally. The Russell 2000 Growth/Value ratio's 14 month RSI is at the highest level since the dot-com bubble.
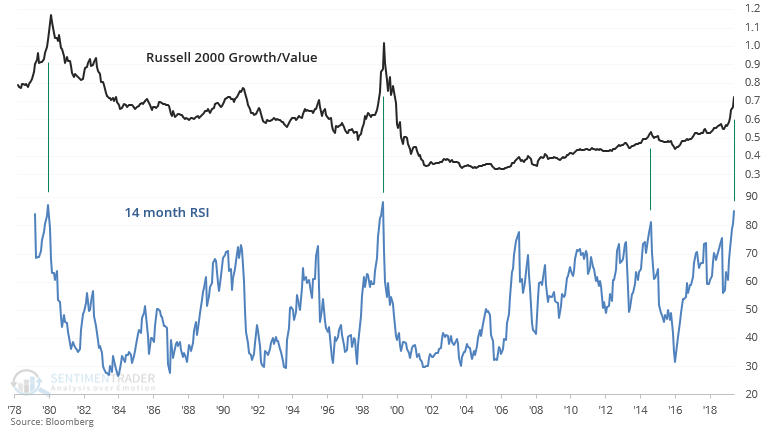
Such extreme momentum among small cap growth stocks relative to small cap value stocks has only occurred 3 other times since 1980:
- February 1980: stocks fell -20% over the next month
- December 1999: near the peak of the dot-com bubble
- July 2015: stocks cratered in August
[NEW] Troy shows that the calm in equities this week coincided with a rebound in various commodities such as oil. Oil prices are rising as economies around the world re-open and demand for oil increases.
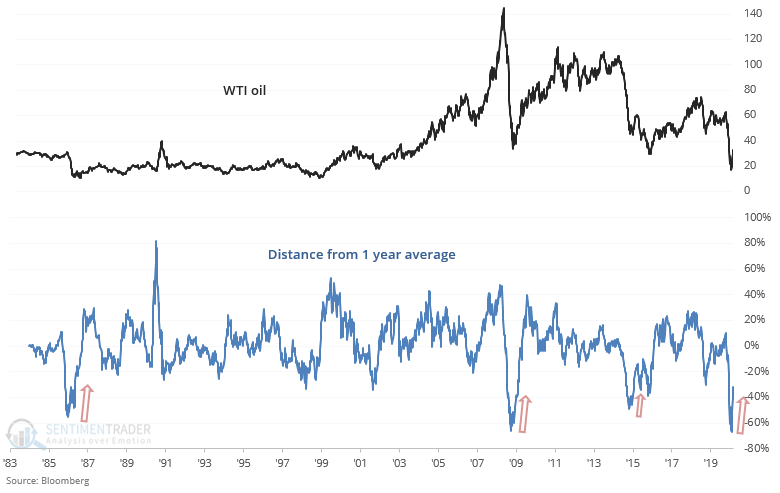
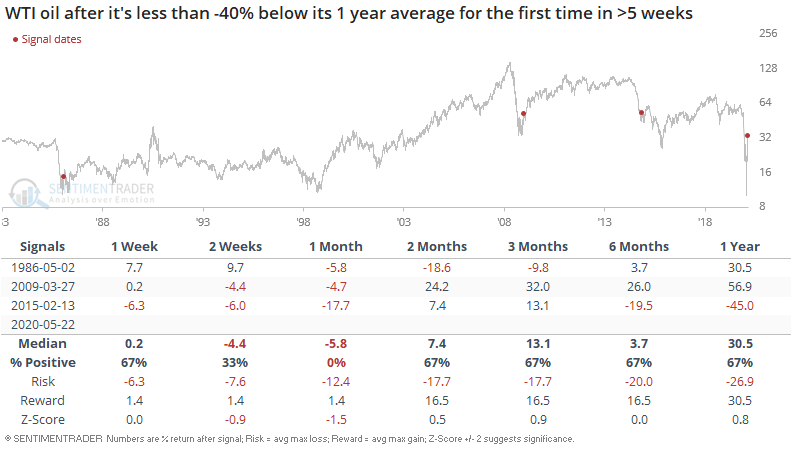
When WTI oil was more than 40% below its 1 year average for the first time in > 5 weeks, oil typically pulled back over the next month, regardless of whether the next move was a bull market or bear market move.
Not everything was negative
While evidence of speculative activity is worrying, as is the stall in prices, Monday's session saw yet another 90% up volume day. This is the 6th time in the past 50 days in which so much volume flowed into up issues:
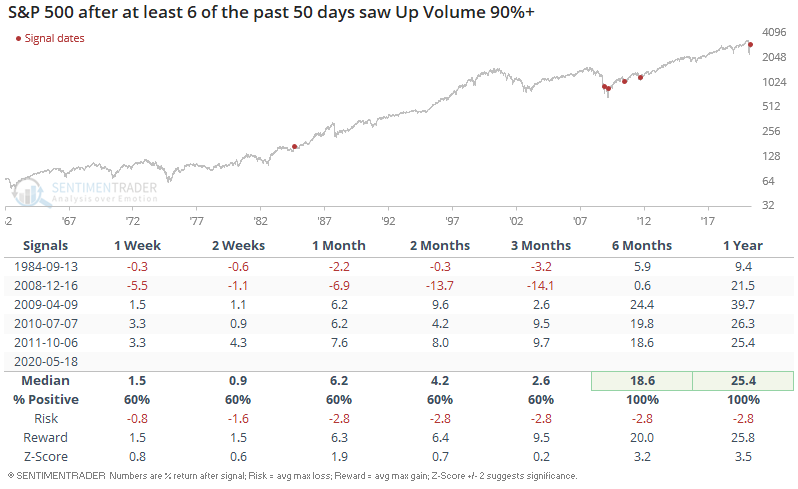
Like most things nowadays, there were few precedents, but they were all positive 6-12 months later.
Financial conditions around the world are easing as economies start to rebound and financial markets calm down. This can be seen through the Bloomberg U.S. Financial Conditions Index, which tracks the level of financial stress in the U.S. equity, bond, and money markets to assess the availability and cost of credit.
The Bloomberg U.S. Financial Conditions Index has rebounded above 0.8 for the first time in 45 days:
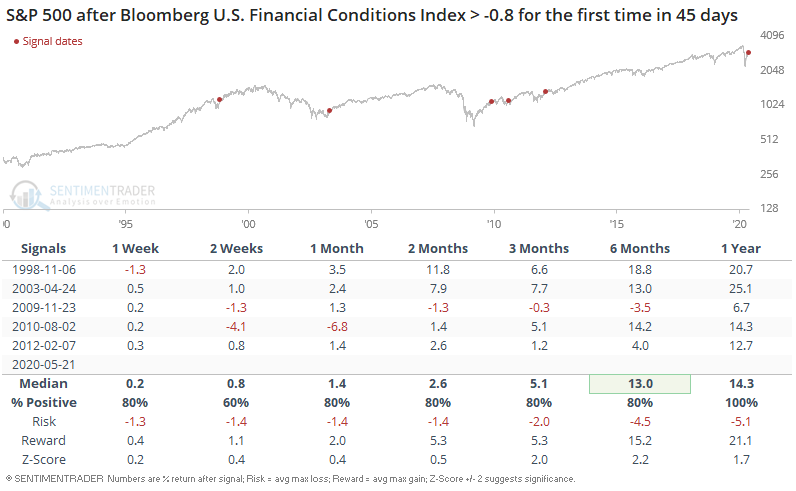
Historically, this often happened after a major correction or bear market and led to more gains for U.S. equities over the next year.
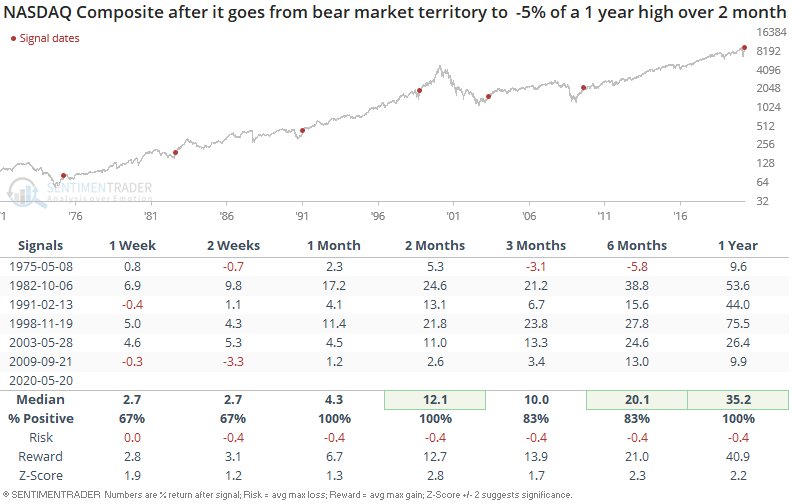
Similarly, the NASDAQ Composite is within -5% of an all-time high: When the NASDAQ Composite cycled from bear market territory (-20% below a 1 year high) to within -5% of a 1 year high, the NASDAQ's returns over the next year were consistently bullish:
The breadth thrusts and speed of the retracement of the decline have been positives that we've been hammering on since late March, so their continued presence isn't too much of a surprise and confirms that we could (should) consider that this is the early stage of a long-term recovery, with a high likelihood of higher prices over the next year.
The path to get there, though, looks increasingly rocky. The flattening out of the rally, while under the 200-day average in the S&P, has caused trouble consistently in the past. And signs of speculation, especially among mom-and-pop types, are especially worrying.