
TradingEdge: More economic weakness as stocks hold up

This is a recap of the most notable research published during the week. It's a tough stretch here, with gains in stocks moderating but not showing a particularly strong bias either way. That's mostly true in other assets as well. If there is a piece of research that hadn't been published by Friday, then you'll see a [NEW] tag.
Econ data still negative, but lagging
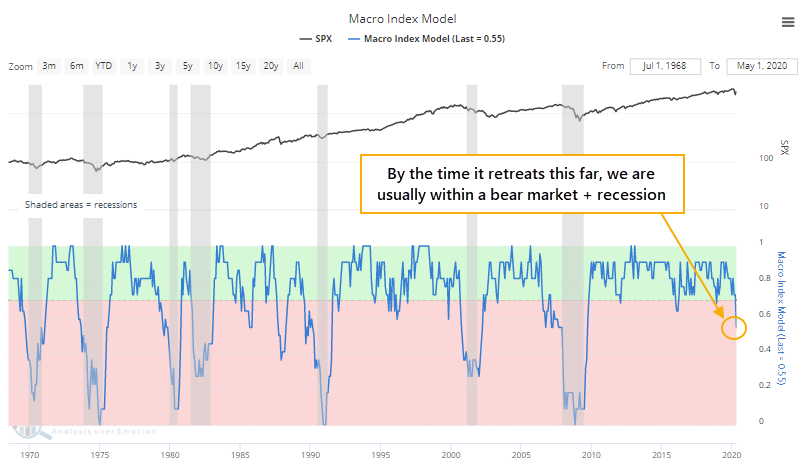
One of our main Buy/Sell Signals has flipped to a sell. The Macro Index Model, reflecting mostly monthly economic data, has deteriorated the most since the last recession.
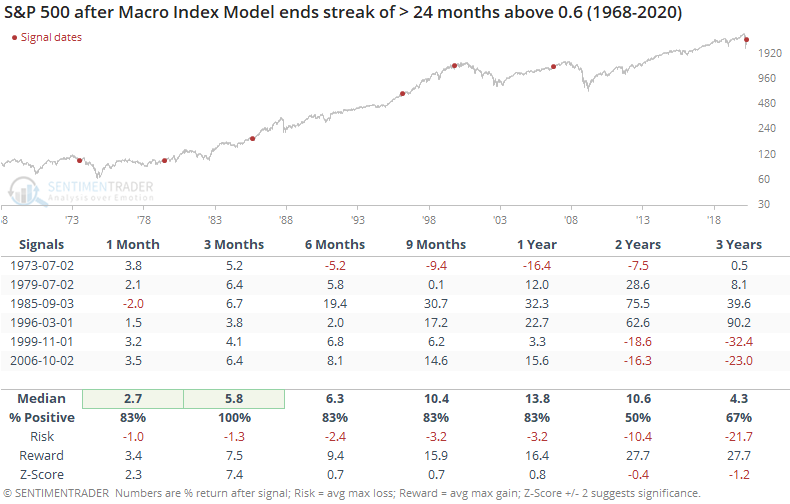
If we only look at times when the signal fell below 0.6 for the first time in at least two years, then the S&P's future returns were better. Three suffered major losses, and three escaped mostly unharmed.
The biggest caveat against the model's warning is the positive momentum leading up to the latest readings, the speed of the decline and recovery, as well as fiscal and monetary response, which is all of which are beyond what any of the other signals witnessed.
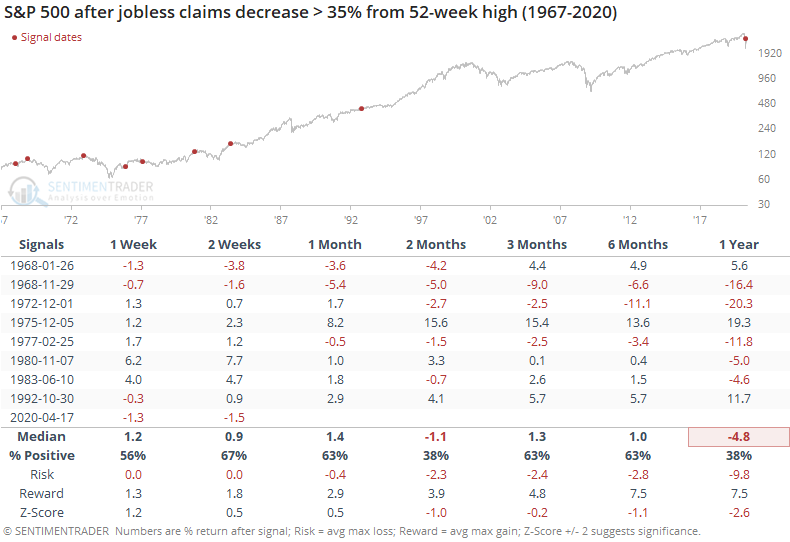
The model uses employment as an input, and jobless claims are still massive even though it seems like we've seen a peak. That hasn't necessarily been a good sign.
Stocks still rockin'
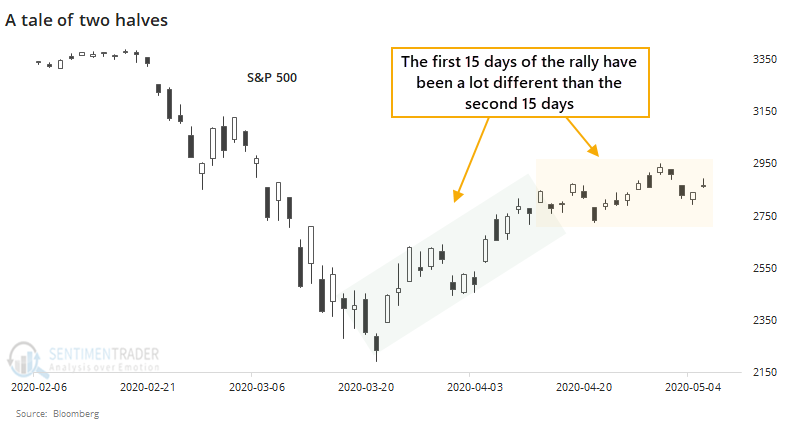
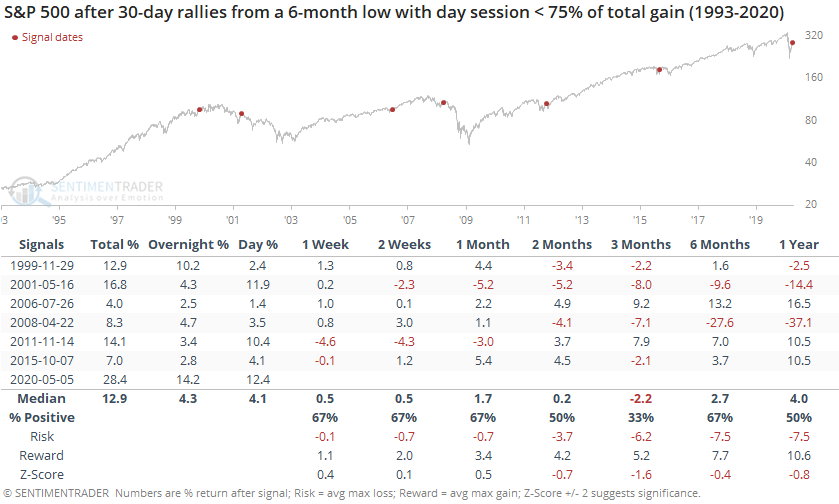
Since stocks bottomed on March 23, they've shown impressive gains. After 30 days, the S&P 500 was still showing a gain of nearly 30% from its lows.
The trouble (maybe) is that that the rally has been so front-loaded. The first 15 days of the 30-day rally generated virtually all of the gains. While the second 15 days have shown a gain, it was barely positive.
Returns were okay most of the time, but there were two big losers over the next 6-12 months. If the S&P fell back and showed a loss or only a small gain over the next month or so, then that weakness tended to bleed over into longer-term returns as well.
Overall, there isn't anything in the pattern to suggest an investor should become more defensive just because the gains have petered out. The biggest caveat would be that if we do roll over from here and show losses over the next 1-2 months, it would usher in some of the more unpleasant longer-term precedents.
Most of the gains have come overnight, but that doesn't necessarily mean the rally is doomed to failure.
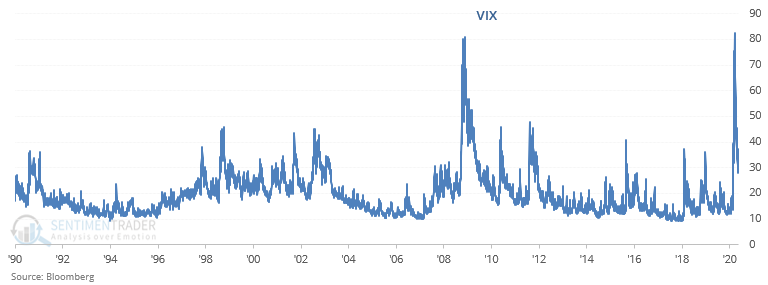
Because the rally was so front-loaded, volatility is falling as daily movements decline.
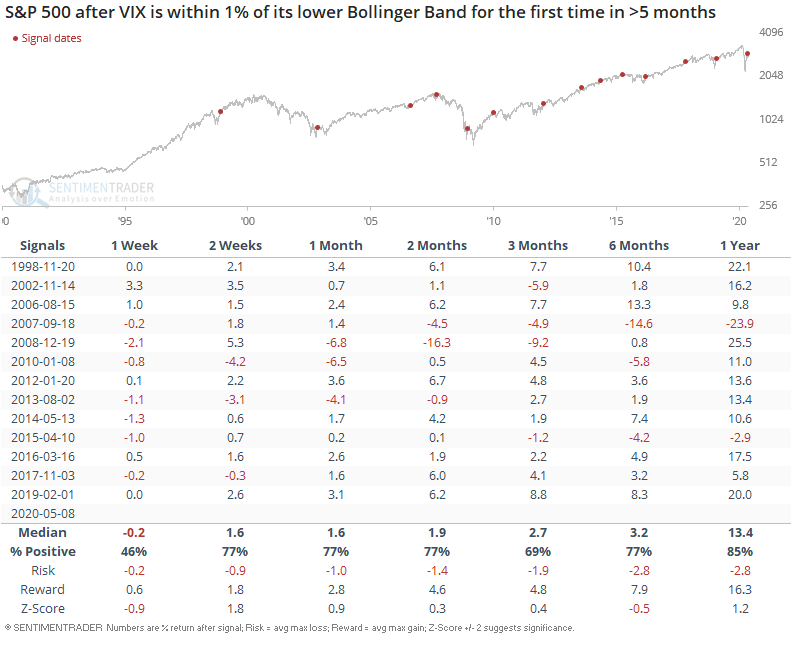
[NEW] Troy mentions that as Urban Carmel noted, the VIX is close to its lower Bollinger Band for the first time after a historic spike:
When the VIX is within 1% of its lower Bollinger Band for the first time in more than 5 months, the S&P's returns over the next week were mixed/bearish. On a longer-term basis (1 year forward), this mostly led to more gains, with a big exception at the stock market's top in September 2007:
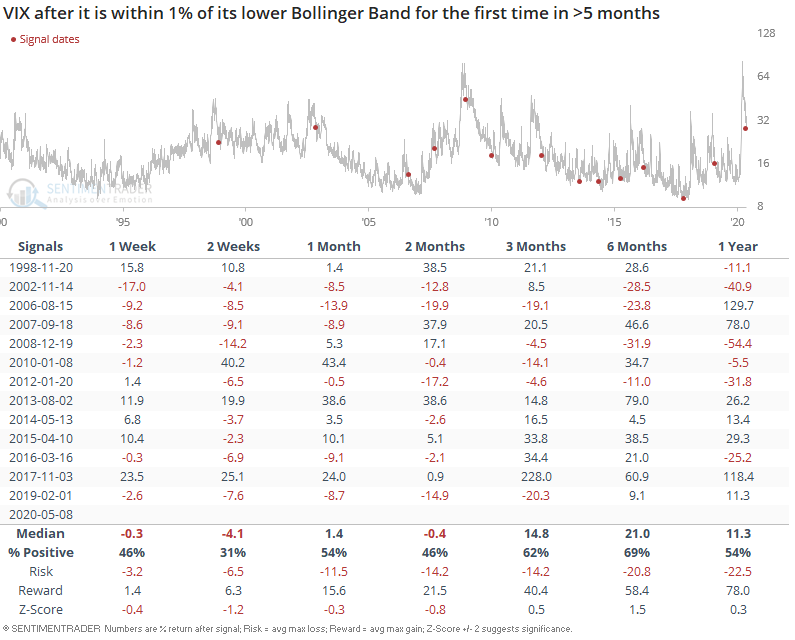
As for VIX itself, it wasn't a consistent bullish sign as one may expect.
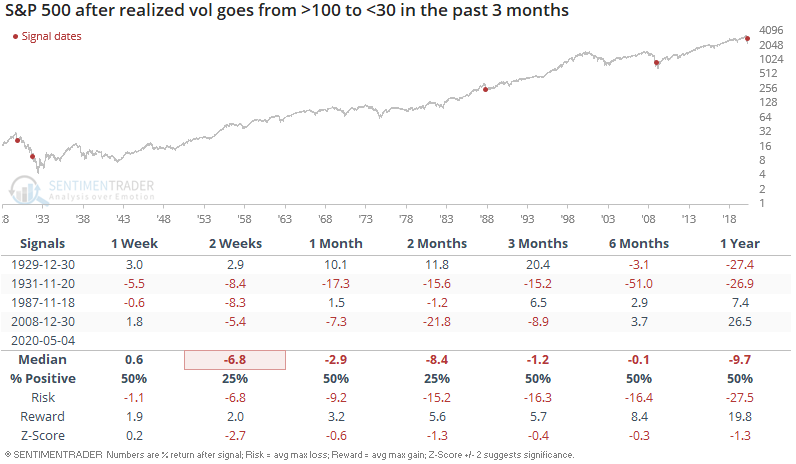
Implied volatility is mostly a reflection of recent historical volatility, and the S&P 500's 10-day realized volatility is falling after reaching the highest level in more than 3 decades.
When volatility went from > 100 to < 30 over the past 3 months, stocks did struggle initially but the last two were as stocks formed major lows.
Volatility is falling in bonds and gold, too. The drop in gold volatility has caused a jump in optimism there, especially among the miners. Lately, gold has been holding up and gold mining stocks have been rocketing higher. At the same time, financials have been barely holding water.
Relative to the S&P 500 index, the NYSE Arca Gold Miners index has made consistent new highs, while the S&P 500 Financials index has been mired near its lows.
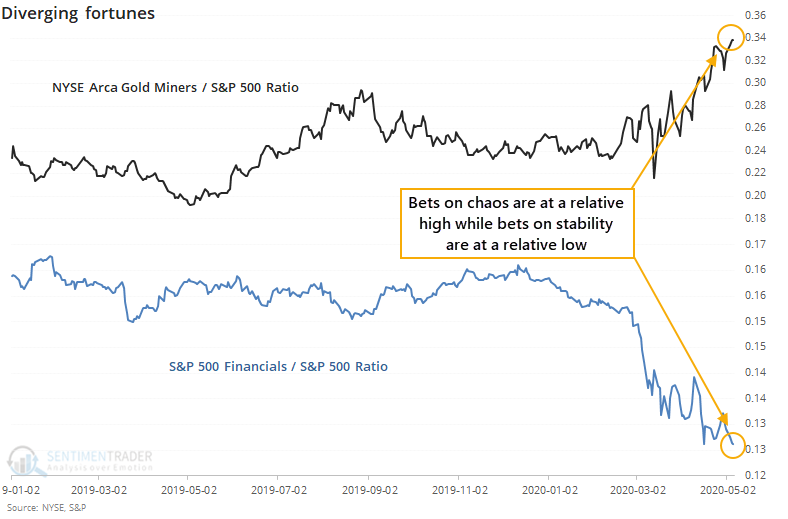
This does not seem like an auspicious setup for the broader market but like a lot of things market-related that sound good in theory, there is maybe a shred of truth in it but overall it's not a consistent factor. It was a major warning in late 2007 - early 2008, but after that, not so much. For financials, there was that massive drop in 2008, but gains since then as it triggered near a few medium-term lows. For gold miners, it was inconsistent. The overall trend over the past decade has been down, so longer-term returns were negative. Shorter time frames showed mixed results.
Especially tech
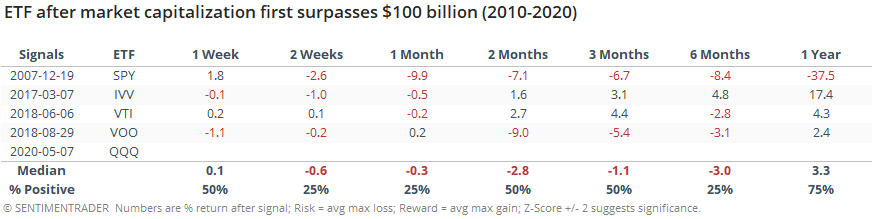
The Nasdaq Composite made it back to positive year-to-date, thanks in large part to the big tech stocks which also drove the QQQ fund to a $100 billion market cap, joining an exclusive club.
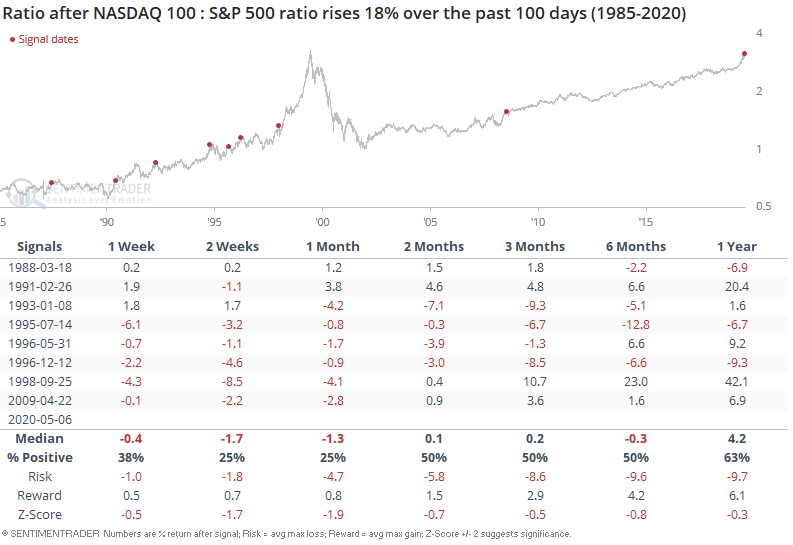
As plenty of market watchers include those at the WSJ have noted, the value factor continues to lag growth significantly. This is one of the longest periods of underperformance ever, as the ratio of the Nasdaq 100 to S&P 500 has soared over the past 100 days.
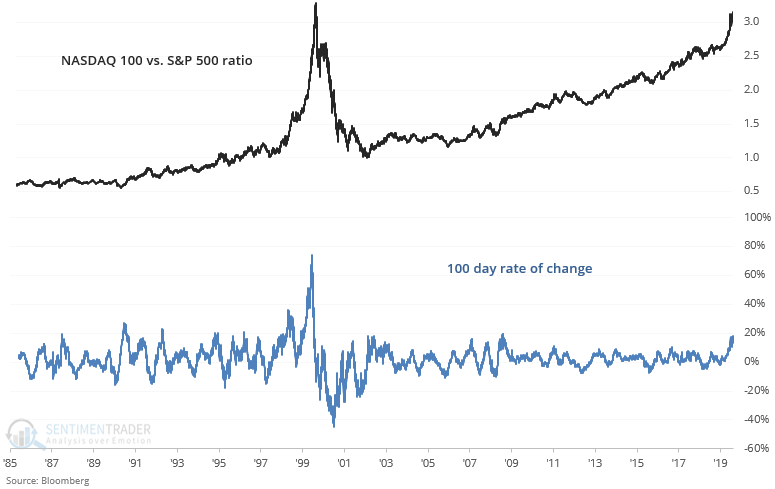
Which is why the NASDAQ vs. S&P 500 typically pulled back in the short term:
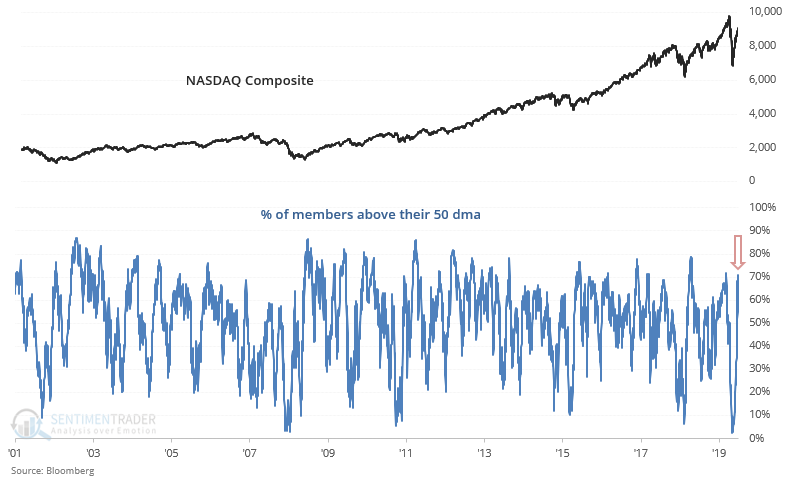
[NEW] Troy notes that 70% of NASDAQ Composite members are above their 50 dma, which is the highest figure since January. While this could be construed as a bearish sign for tech stocks, it wasn't always so.
"The last time this happened" was followed by a crash (March 2020), but it wasn't consistently bearish before that: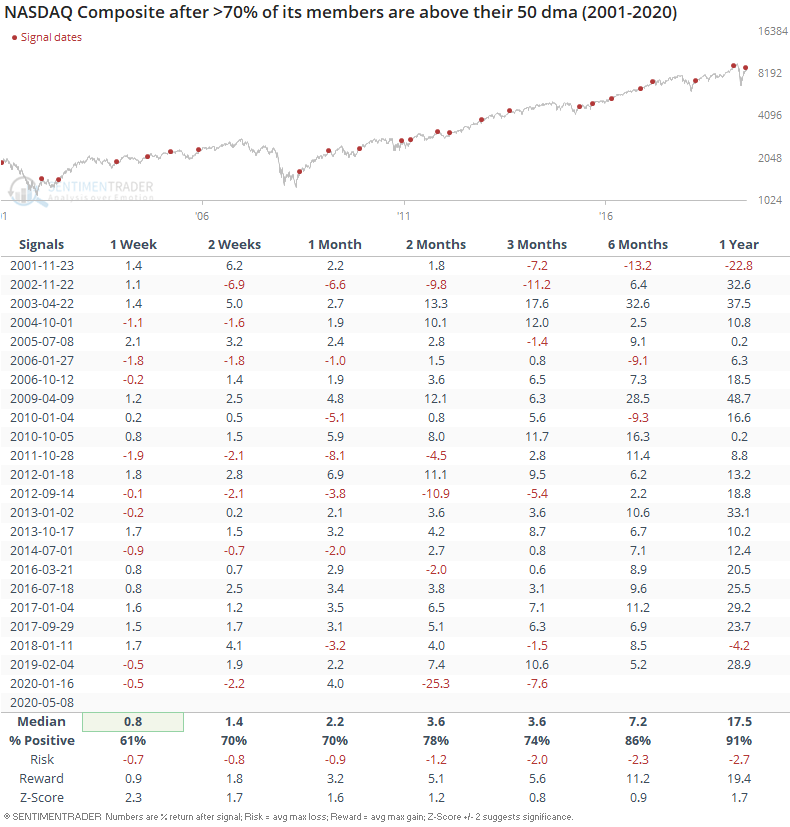
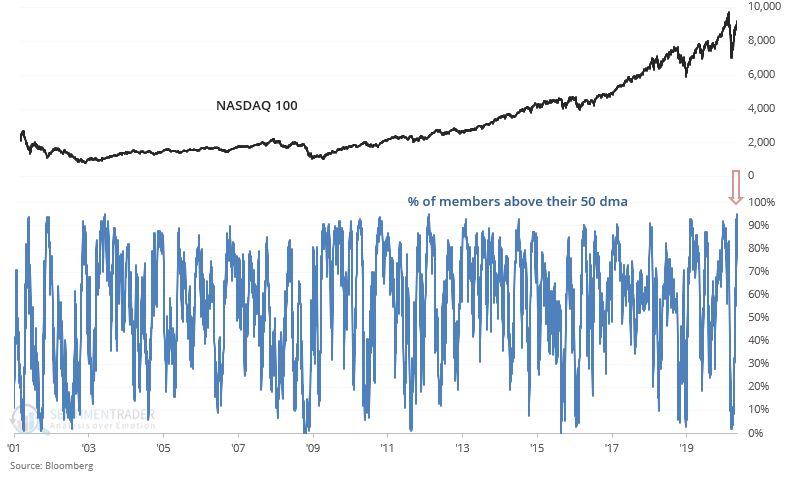
Similarly, a record-breaking 95% of NASDAQ 100 members are above their 50 dma:
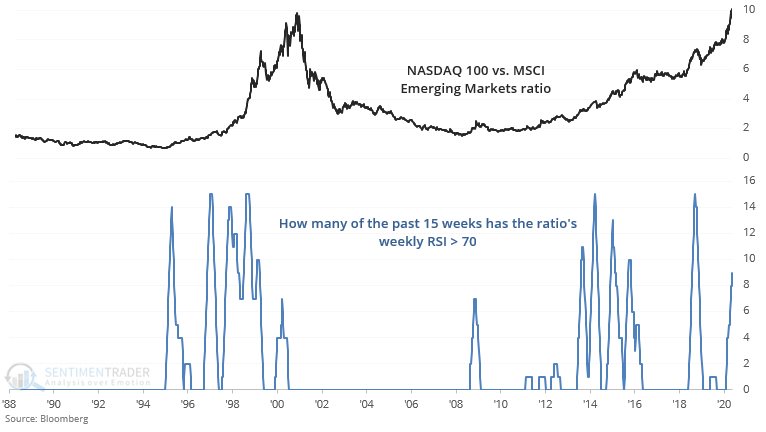
Equity markets outside of the U.S. have languished as U.S. markets push higher. This has caused the NASDAQ 100 vs. MSCI Emerging Markets ratio to rise to its highest level since the peak of the dot-com bubble. As a result, 9 of the past 15 weeks have seen this ratio's weekly RSI exceed 70:
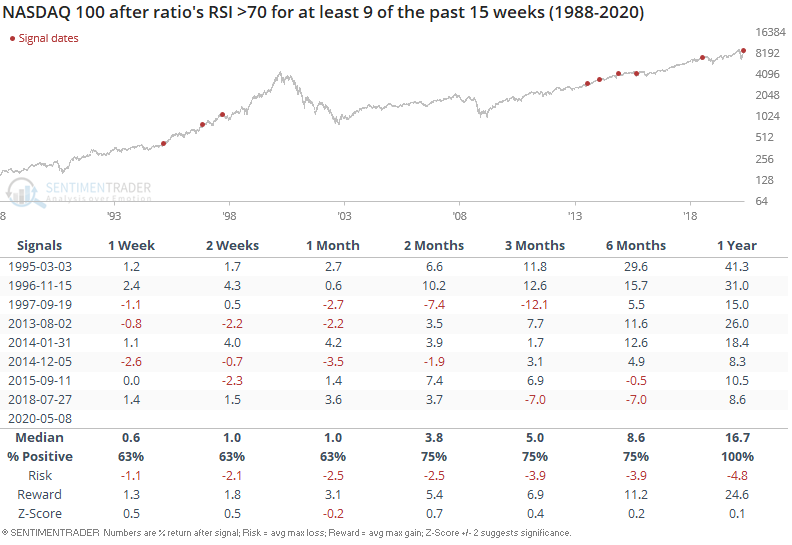
Once again, this wasn't a clear bearish sign for tech stocks on any time frame. In fact, over the next year the NASDAQ 100 always went up:
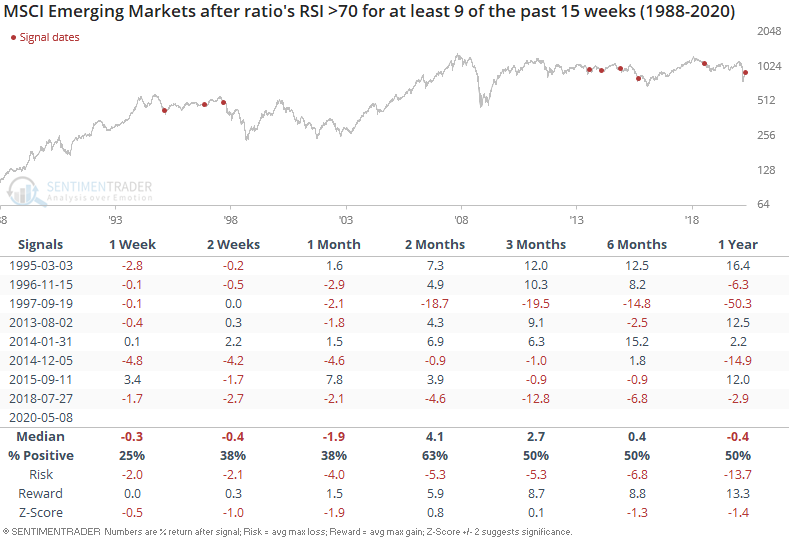
Whereas emerging markets often continued to underperform going forward:
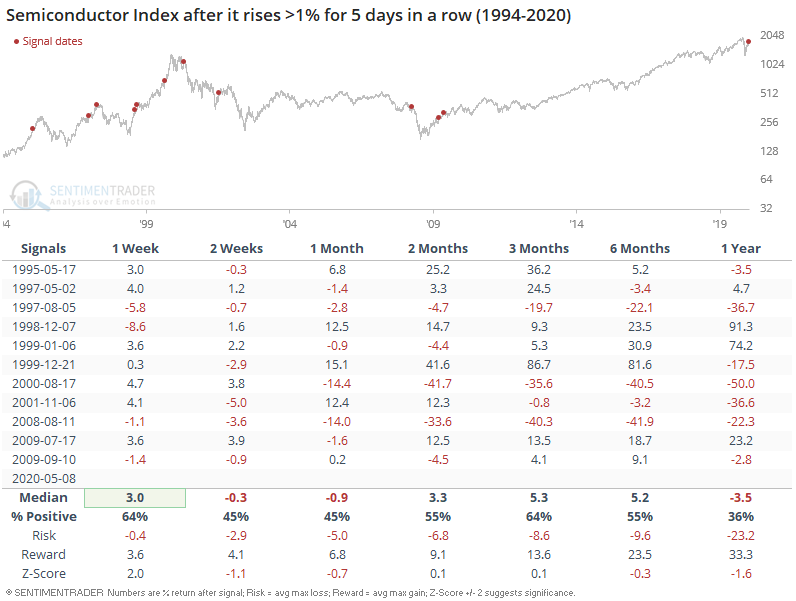
And as Bespoke noted, semiconductors have gone up more than 1% for 5 days in a row:
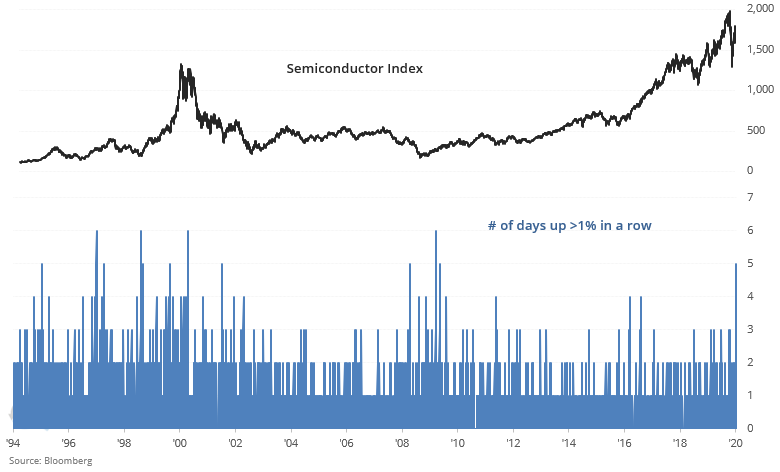
This mostly led to mixed returns going forward:
Sentiment is surprisingly mixed
Despite the gains in stocks, the latest survey of individual investors from AAII showed a big drop in optimism. We saw a couple of weeks ago that apathy was prevalent in most of the surveys, and that has continued. Which raises the question of who is buying.
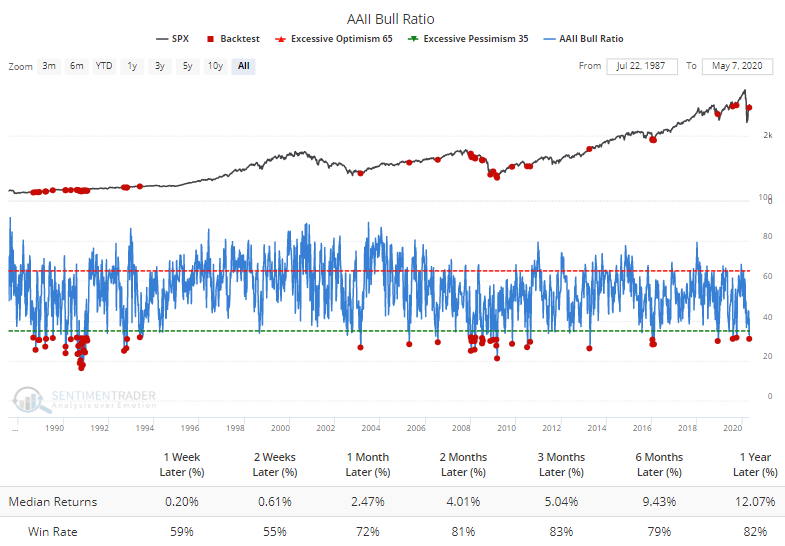
There has never been a period when optimism was so low after such a big rally. Out of the 54 times when the S&P 500 showed a gain of 10% or more over a 7-week period, not one of them (until this week) saw more than 50% of respondents consider themselves bearish.
The only times more than 40% of respondents were bearish were December 1990 and a few weeks from April - August 2009. We also saw from that note just how pessimistic the news flow has been, helping to put a damper on fund flows, hedging fund buying, and consumer attitudes.
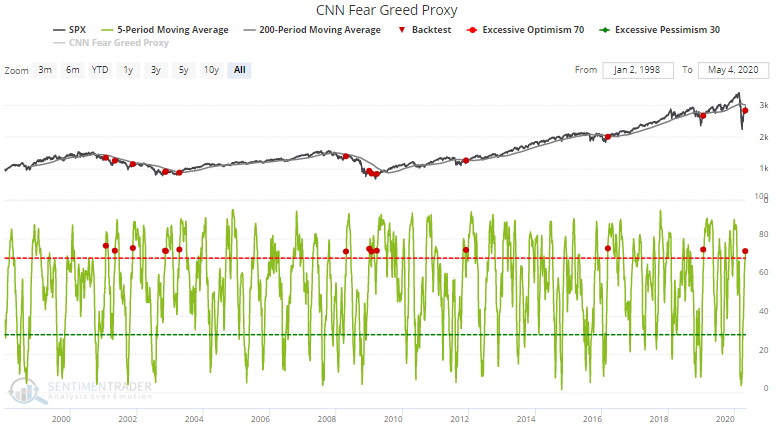
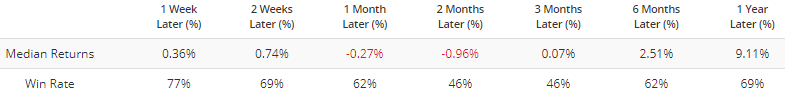
One of the relatively few indicators or models showing outright optimism is our CNN Fear Greed Proxy, where the 5-day average hit 73.
When this happened in the past while the S&P was under its 200-day average, the S&P's returns over the next 2-3 months were mixed to negative.
Also showing a bit of optimism are Wall Street analysts, who are finally turning positive after a record stretch of negativity. That has been an okay sign, as long as they don't start to raise price targets on too many stocks like they did earlier this year.
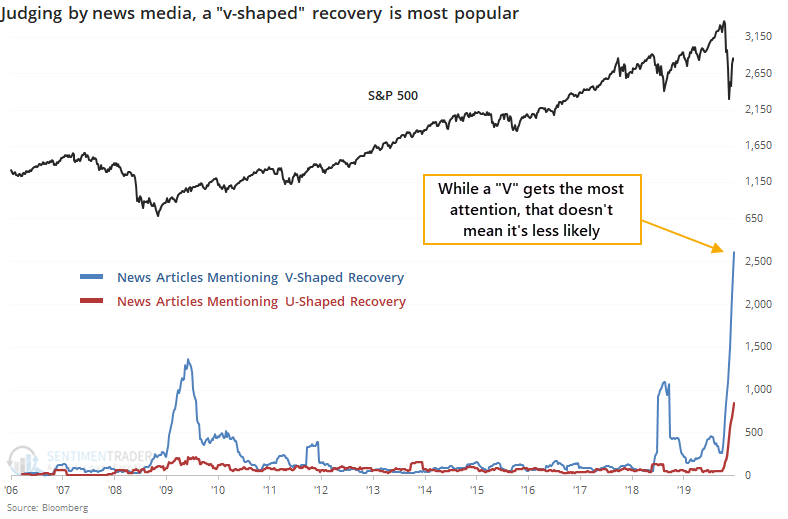
This is happening as talks of a v-shaped recovery take over the financial media. Most of those articles have been skeptical, though, and just because it's being talked about a lot doesn't mean it won't happen.
Meanwhile, other signs of sentiment are picking up but not at true extremes yet.
Sectors still stretched
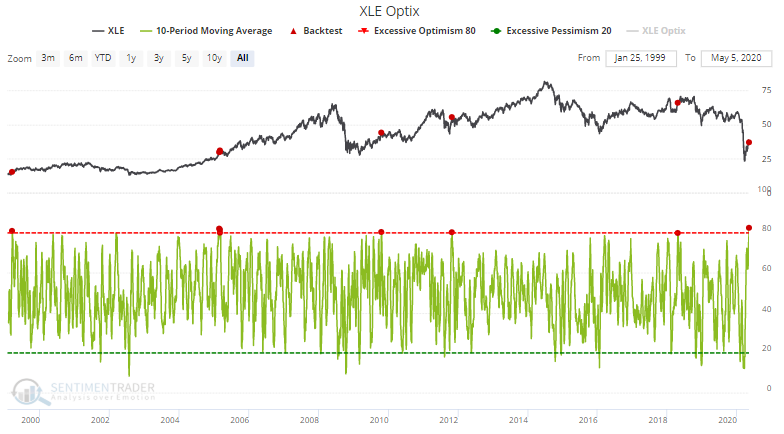
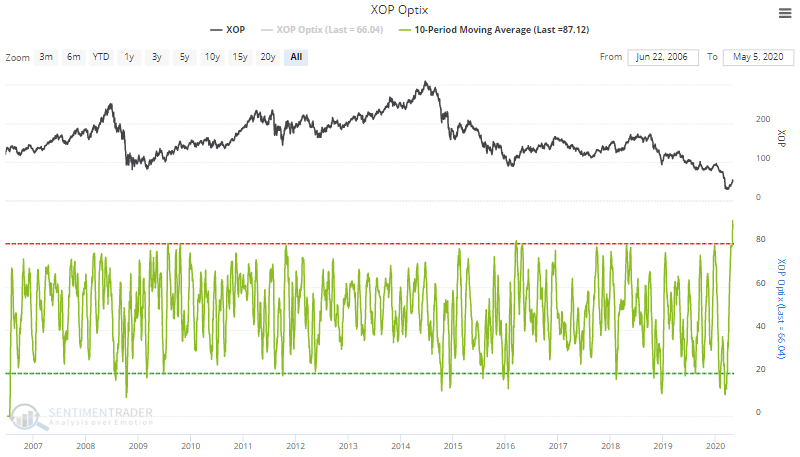
Many sectors continue to see a remarkable run of optimism.
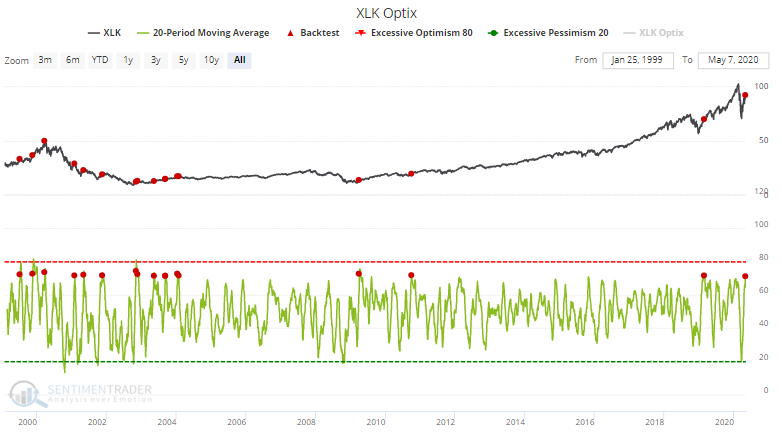
It is also being seen in tech, of course.
This is a tough stretch, with the still-lingering positives from the massive breadth thrusts and price retracements in March-early April, and scattered signs of skepticism. The negatives have been a smattering of indicators showing optimism, but those aren't at a level that are terribly concerning yet. We spend a lot of time trying to disprove whatever opinions we might have, and right now it's hard to find anything that's arguing strongly one way or the other. Same goes for the bond and gold markets.