Data &
Technology
Research
Reports
Report Solutions
Reports Library
Actionable
Strategies
Free
Resources
Simple Backtest Calculator
Simple Seasonality Calculator
The Kelly Criterion Calculator
Sentiment Geo Map
Public Research Reports
Free Webinar
Pricing
Company
About
Meet Our Team
In the News
Testimonials
Client Success Stories
Contact
Log inLoginSign up
< BACK TO ALL REPORTS

Gold miners soar while financials slide

Jason Goepfert
2020-05-06
Gold mining stocks have soared relative to the broader stock market, with the NYSE Arca Gold Miner index reaching new 52-week highs relative to the S&P 500. At the same time, the S&P 500 Financials index has slid close to a 52-week low. That kind of divergence seems like it should be an ominous sign, but its record has been mixed over the past 35 years.

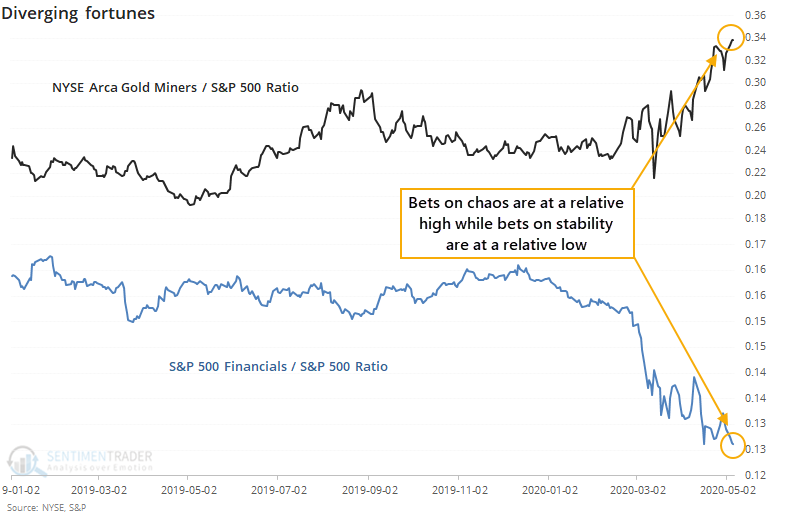
Lately, gold has been holding up and gold mining stocks have been rocketing higher. At the same time, financials have been barely holding water.

Relative to the S&P 500 index, the NYSE Arca Gold Miners index has made consistent new highs, while the S&P 500 Financials index has been mired near its lows.

This does not seem like an auspicious setup for the broader market. Bets on gold mining stocks are commonly taken as a bet on general chaos, while bets on financials are a bet on economic growth and stability. The fact that the former is at a new and the latter is at a low seems troubling.

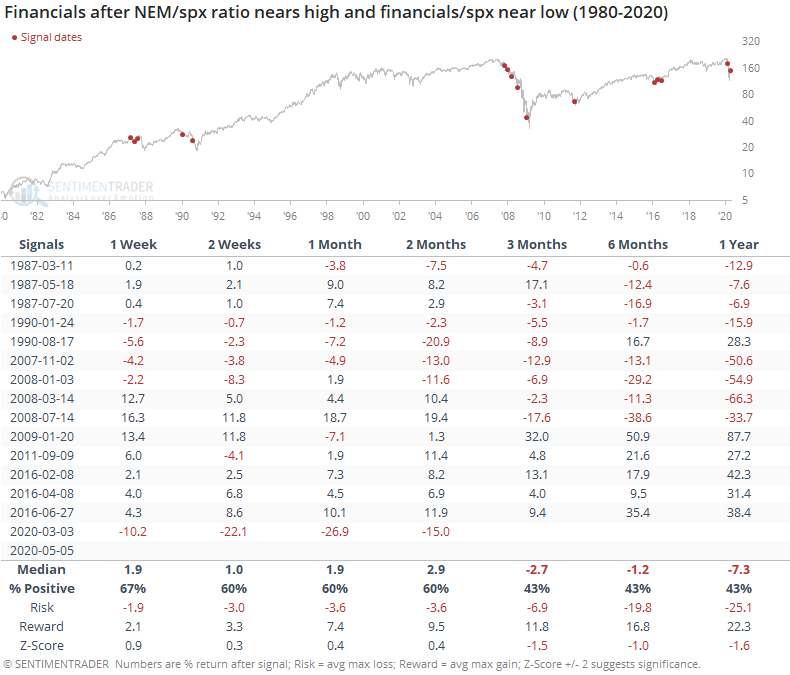
Like a lot of things market-related that sound good in theory, there is maybe a shred of truth in it but overall it's not a consistent factor. When the ratio of gold miners to the S&P was within 0.5% of a 52-week high and financials to the S&P within 0.5% of a 52-week low, it was a major warning in late 2007 - early 2008, but after that, not so much.

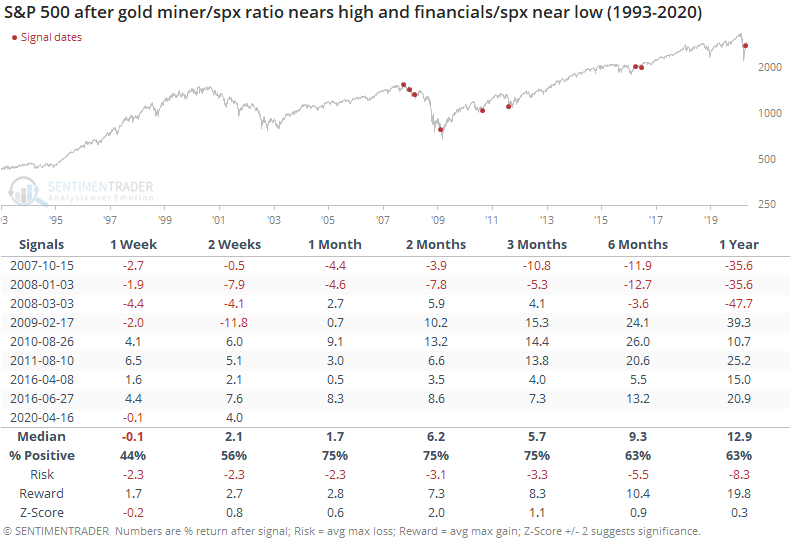
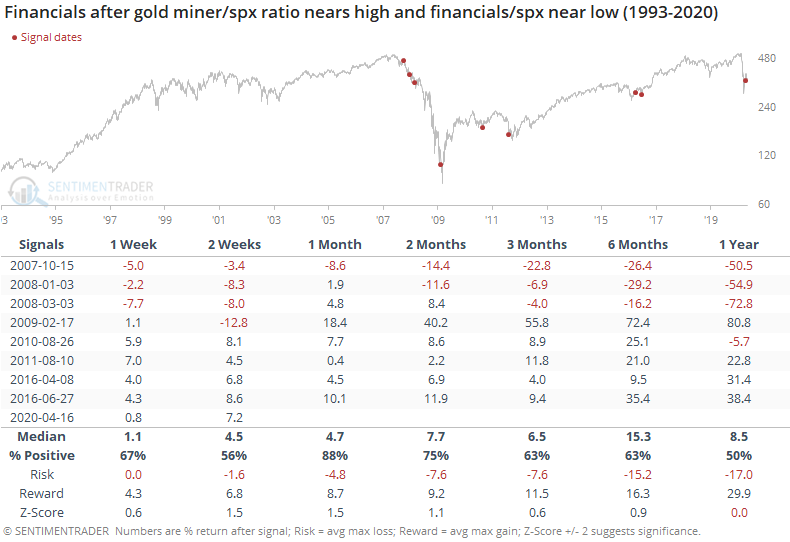
For financials, there was that massive drop in 2008, but gains since then as it triggered near a few medium-term lows.

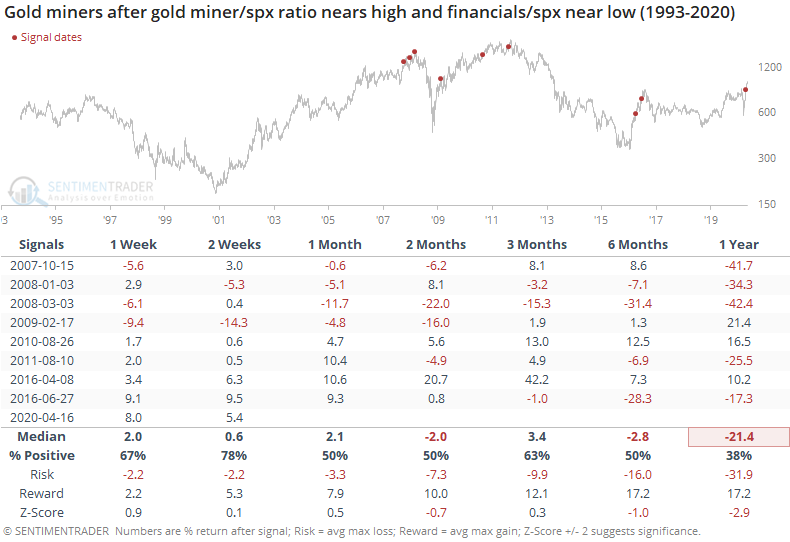
For gold miners, it was inconsistent. The overall trend over the past decade has been down, so longer-term returns were negative. Shorter time frames showed mixed results.

That gold mining index only goes back to 1993, so if we use the largest mining stock with the most history, Newmont Mining, we can get another 13 years of history. That stock has a 0.88 correlation to the NYSE Arca Gold Miner index, so it's a relatively good proxy.

Prior to the last decade or so, the only time period that saw a divergence between the two sectors like this was in 1987 and 1990. Neither one was much of a good sign for stocks, or for financials in particular.

Newmont soared in 1987 but then fell back after the 1990 signals.

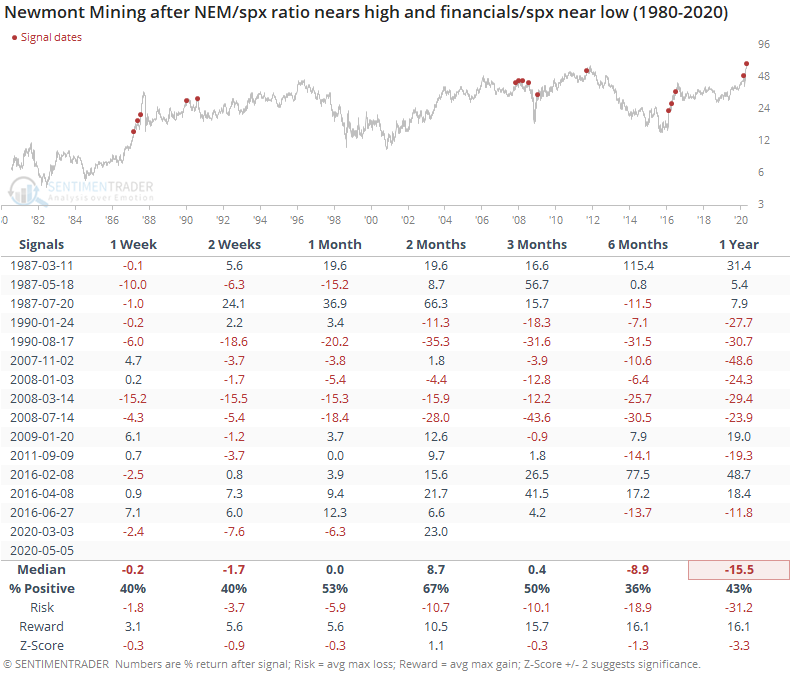
Overall, the divergence in fortunes between gold miners and financials seems like a major warning for the broader market going forward. Historically, though, the evidence is mixed. It was an effective yellow flag up to the past decade but has triggered several times since then with no ill effects.

Sorry, you don't have access to this report

Upgrade your subscription plan to get access
Go to Dasboard
DATA &
TECHnologies
IndicatorEdge
‍
BackTestEdge
‍
Other Tools
‍
DataEdge API
RESEARCH
reports
Research Solution
‍
Reports Library
‍
actionable
Strategies
Trading Strategies
‍
Smart Stock Scanner
‍
FREE
RESOUrCES
Simple Backtest
Calculator
Simple Seasonality
Calculator
The Kelly Criterion
Calculator
Sentiment Geo Map
‍
Public Research Reports
‍
Free Webinar
COMPANY
‍
About
‍
Meet our Team
‍
In the News
‍
Testimonials
‍
Client Success Stories
Pricing
Bundle pricing
‍
Announcements
‍
FAQ
© 2024 Sundial Capital Research Inc. All rights reserved.
Setsail Marketing
TermsPrivacyAffiliate Program
Risk Disclosure: Futures and forex trading contains substantial risk and is not for every investor. An investor could potentially lose all or more than the initial investment. Risk capital is money that can be lost without jeopardizing ones’ financial security or life style. Only risk capital should be used for trading and only those with sufficient risk capital should consider trading. Past performance is not necessarily indicative of future results.

Hypothetical Performance Disclosure: Hypothetical performance results have many inherent limitations, some of which are described below. No representation is being made that any account will or is likely to achieve profits or losses similar to those shown; in fact, there are frequently sharp differences between hypothetical performance results and the actual results subsequently achieved by any particular trading program. One of the limitations of hypothetical performance results is that they are generally prepared with the benefit of hindsight. In addition, hypothetical trading does not involve financial risk, and no hypothetical trading record can completely account for the impact of financial risk of actual trading. for example, the ability to withstand losses or to adhere to a particular trading program in spite of trading losses are material points which can also adversely affect actual trading results. There are numerous other factors related to the markets in general or to the implementation of any specific trading program which cannot be fully accounted for in the preparation of hypothetical performance results and all which can adversely affect trading results.

Testimonial Disclosure: Testimonials appearing on this website may not be representative of other clients or customers and is not a guarantee of future performance or success.