Data &
Technology
Research
Reports
Report Solutions
Reports Library
Actionable
Strategies
Free
Resources
Simple Backtest Calculator
Simple Seasonality Calculator
The Kelly Criterion Calculator
Sentiment Geo Map
Public Research Reports
Free Webinar
Pricing
Company
About
Meet Our Team
In the News
Testimonials
Client Success Stories
Contact
Log inLoginSign up
< BACK TO ALL REPORTS

The tech and growth story

Troy Bombardia
2020-05-07
Value continues to lag growth significantly.

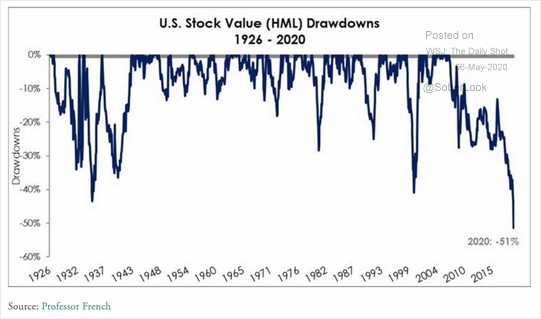
As plenty of market watchers include those at the WSJ have noted, the value factor continues to lag growth significantly. This is one of the longest periods of underperformance ever:

Value investors have repeatedly called for their favorite factor to outperform over the years, but so far this has failed to materialize. Perhaps now is finally the time?

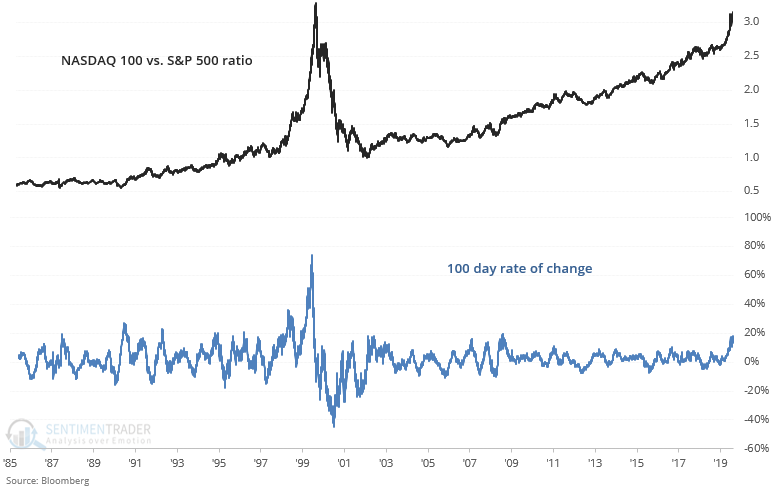
The following chart is the NASDAQ 100 vs. the S&P 500 ratio, which is *at its highest since 2000*:

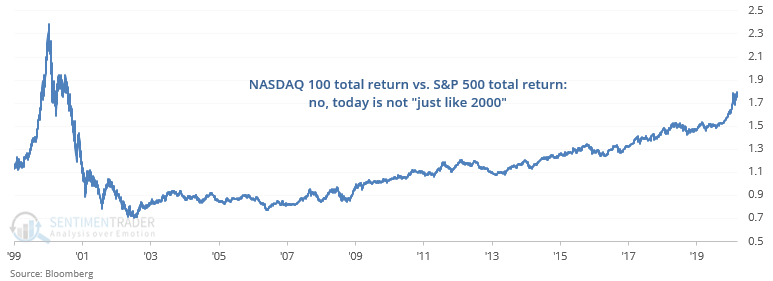
While these charts are extremely popular, they highlight one of the biggest problems with charts - they can be made to tell any narrative you want. For example, this chart doesn't take into account the fact that the S&P 500's dividend yield is higher than the NASDAQ 100's dividend yield. Comparing total return indices demonstrates that today is not "just like 2000".

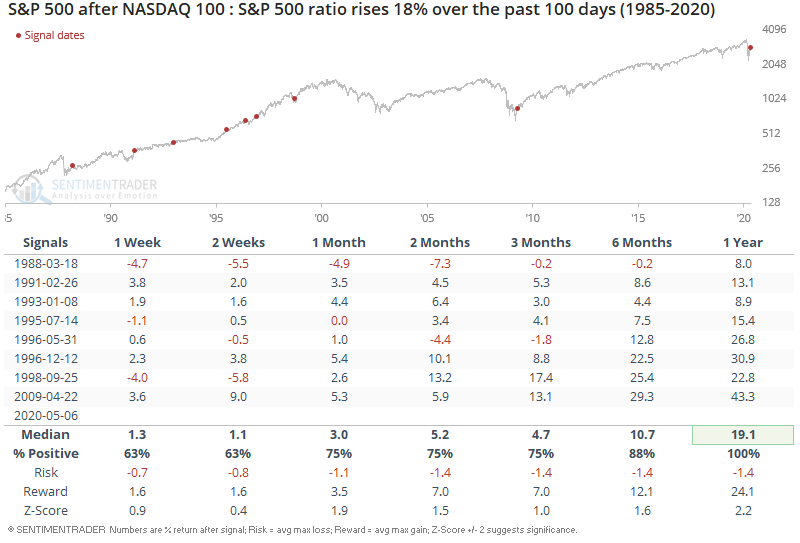
Regardless of absolute values, the NASDAQ 100 vs. S&P 500 ratio's 100 day rate of change is extremely high. When this happened in the past, it wasn't a guaranteed bearish sign for the S&P 500 on any time frame. In fact, 1 year later this was consistently bullish for stocks:

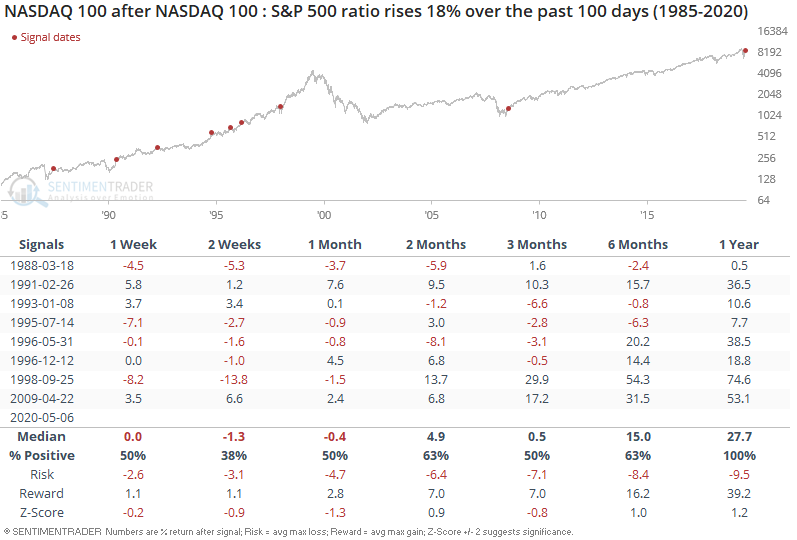
As for the NASDAQ 100, this could lead to short term weakness:

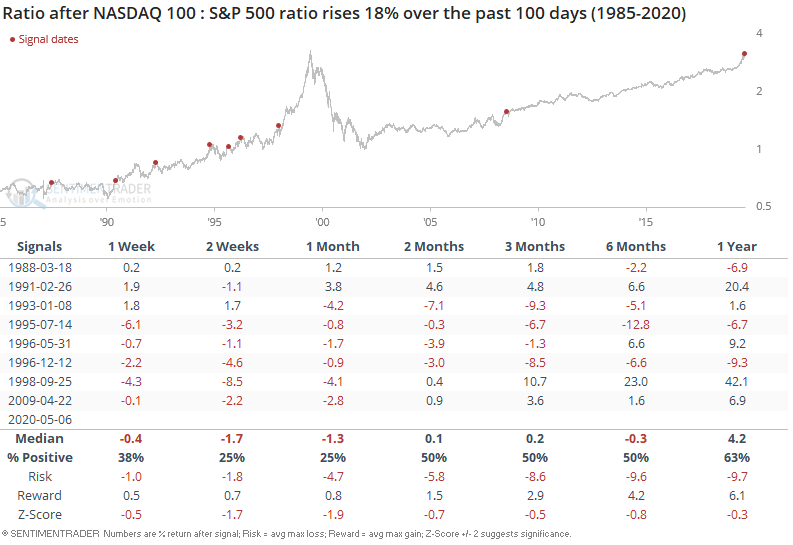
Which is why the NASDAQ vs. S&P 500 typically pulled back in the short term:

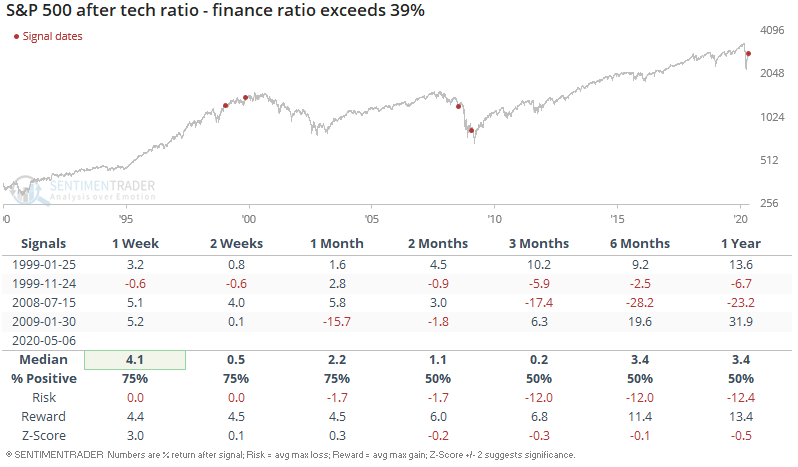
Tech stocks remain strong while the financial sector is one of the weakest sectors. This has caused the "NASDAQ vs. S&P ratio" to significantly outperform the "Finance vs. S&P ratio":

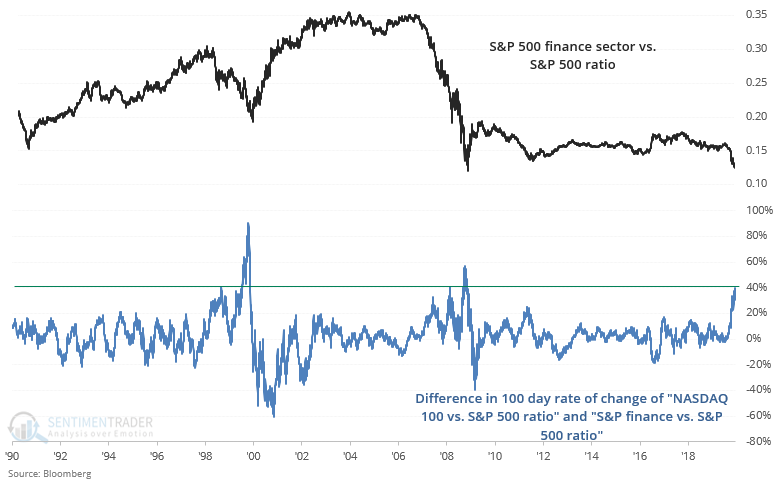
While this is quite an extreme situation, it hasn't been consistently bullish or bearish for stocks.

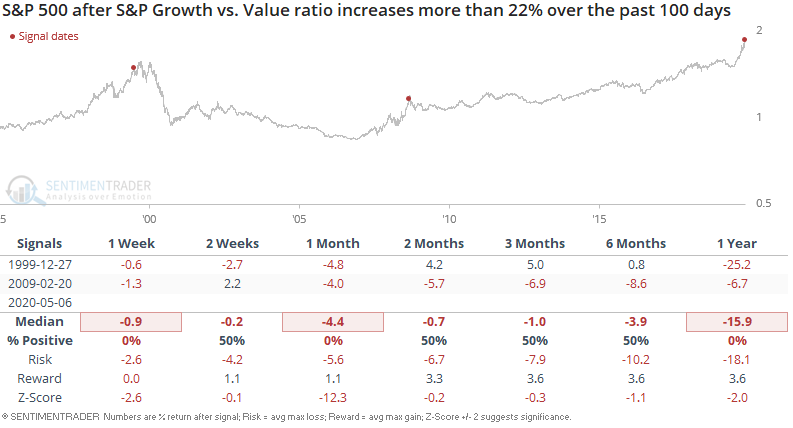
And lastly, the S&P 500 Growth Index has significantly outperformed the S&P 500 Value Index

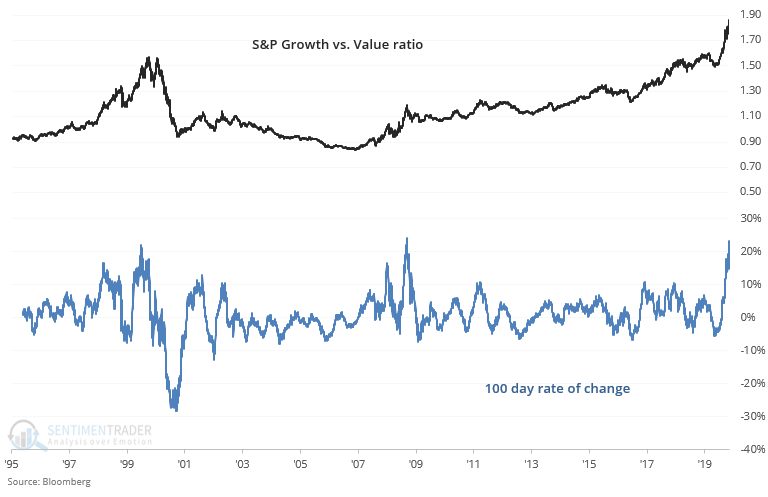
This happened near the stock market's top in late-1999 and also near the stock market's bottom in early-2009. So while this isn't consistently bullish or bearish for stocks, in both cases in led to value stocks outperforming growth stocks over the next year:

Sorry, you don't have access to this report

Upgrade your subscription plan to get access
Go to Dasboard
DATA &
TECHnologies
IndicatorEdge
‍
BackTestEdge
‍
Other Tools
‍
DataEdge API
RESEARCH
reports
Research Solution
‍
Reports Library
‍
actionable
Strategies
Trading Strategies
‍
Smart Stock Scanner
‍
FREE
RESOUrCES
Simple Backtest
Calculator
Simple Seasonality
Calculator
The Kelly Criterion
Calculator
Sentiment Geo Map
‍
Public Research Reports
‍
Free Webinar
COMPANY
‍
About
‍
Meet our Team
‍
In the News
‍
Testimonials
‍
Client Success Stories
Pricing
Bundle pricing
‍
Announcements
‍
FAQ
© 2024 Sundial Capital Research Inc. All rights reserved.
Setsail Marketing
TermsPrivacyAffiliate Program
Risk Disclosure: Futures and forex trading contains substantial risk and is not for every investor. An investor could potentially lose all or more than the initial investment. Risk capital is money that can be lost without jeopardizing ones’ financial security or life style. Only risk capital should be used for trading and only those with sufficient risk capital should consider trading. Past performance is not necessarily indicative of future results.

Hypothetical Performance Disclosure: Hypothetical performance results have many inherent limitations, some of which are described below. No representation is being made that any account will or is likely to achieve profits or losses similar to those shown; in fact, there are frequently sharp differences between hypothetical performance results and the actual results subsequently achieved by any particular trading program. One of the limitations of hypothetical performance results is that they are generally prepared with the benefit of hindsight. In addition, hypothetical trading does not involve financial risk, and no hypothetical trading record can completely account for the impact of financial risk of actual trading. for example, the ability to withstand losses or to adhere to a particular trading program in spite of trading losses are material points which can also adversely affect actual trading results. There are numerous other factors related to the markets in general or to the implementation of any specific trading program which cannot be fully accounted for in the preparation of hypothetical performance results and all which can adversely affect trading results.

Testimonial Disclosure: Testimonials appearing on this website may not be representative of other clients or customers and is not a guarantee of future performance or success.