TCTM Risk Warning Model Review
The Tactical Composite Trend Model (TCTM) uses a weight-of-the-evidence approach to identify the major market trend. The composite model features seven critical, time-tested components that alert investors to money-making opportunities or threats. In today's note, I want to review the risk warning model component. The model contains ten algorithms that seek to identify instances in history when market participation has narrowed and sentiment has become overly optimistic. Weak internal trends and overly optimistic sentiment have historically provided an early warning to a potential trend change. I can resoundingly say that I have spent more time designing and refining the risk warning model than any other TCTM component. As we all know, the market has an upward drift over time. Therefore, if I'm going to reduce market exposure, I want to make sure the odds are in my favor. If you would like to read one of the individual component notes, please click on the link below.
Please click on this link to see TCTM live updates on the website.
Component Notes
New 52-Week High Low Ratio
52-Week Low with Percent above 200-Day
High Low Logic NYSE with Spike
Advance-Decline Line Divergence
New Lows Spike SPX
High Low Logic SPX with Spike
Financial Relative Strength
Financial Absolute Lows
Cyclical Group Spread
Sentiment Comp
Risk Warning Model Signal Criteria
Condition1 = Composite signal count >= 50%.
Condition2 = If condition1, then start days since true count.
Condition3 = If days since true count <= 20, and the 5-day rate of change for the S&P 500 is -1% or more, signal risk-off.
Condition4 = Composite count resets below 20%. i.e., the reset screens out duplicate signals.
Notes:
- The composite model utilizes a 63-day lookback period for the signal count.
- I want to stress the importance of utilizing a momentum condition in trading signals. I never want to catch a falling knife on down moves or prematurely reduce exposure in a market that is ripping to the upside. This is why I have the 5-day rate of change condition.
Let's take a look at some charts and the historical signal performance.
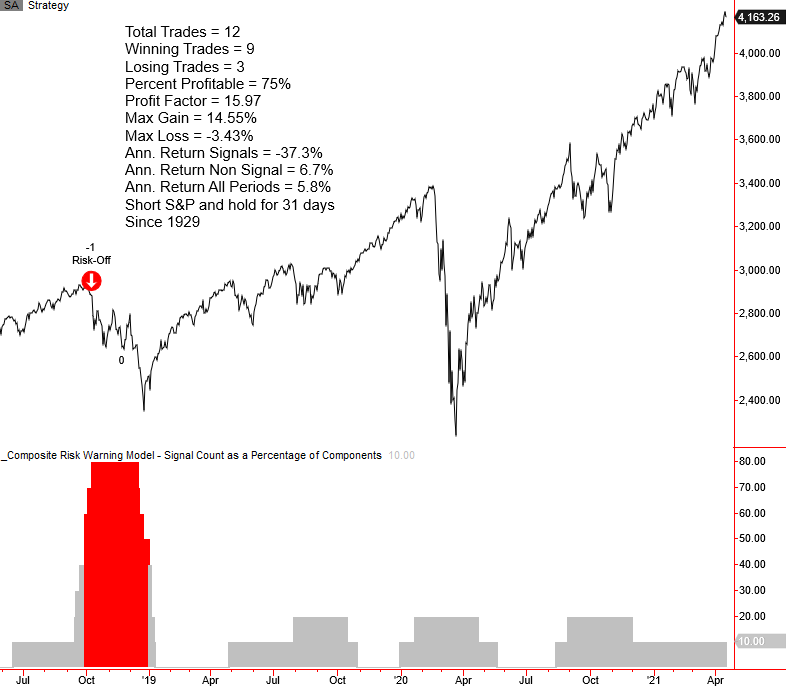
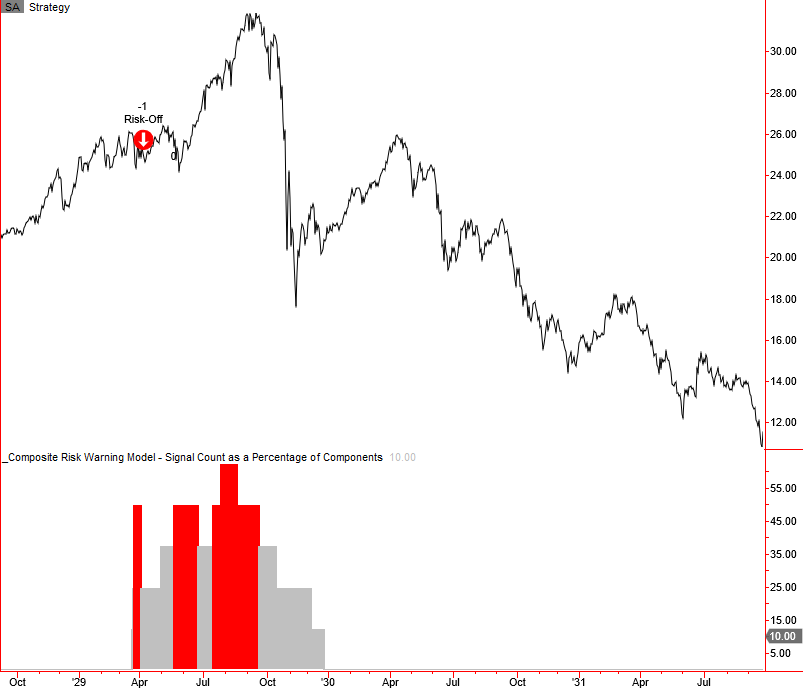
Current Day Chart
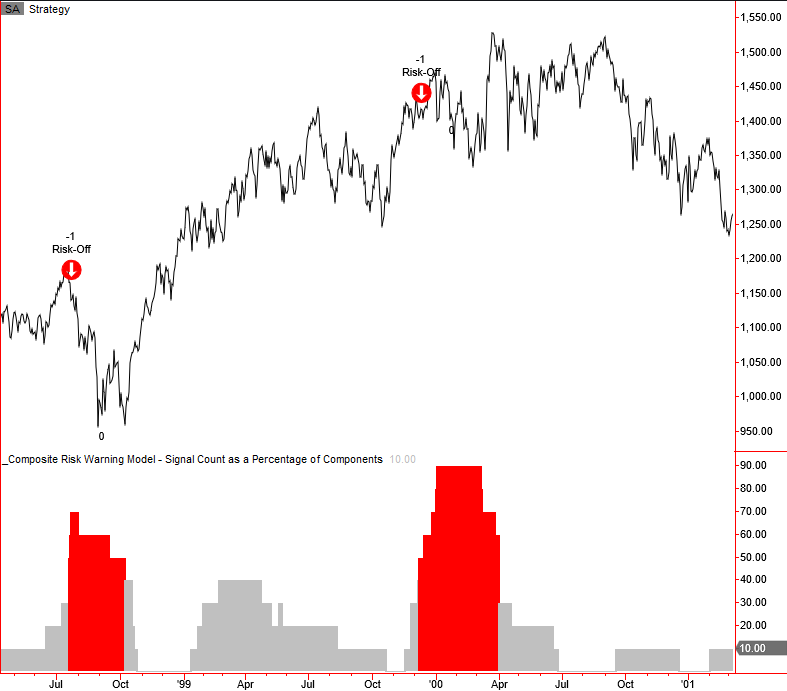
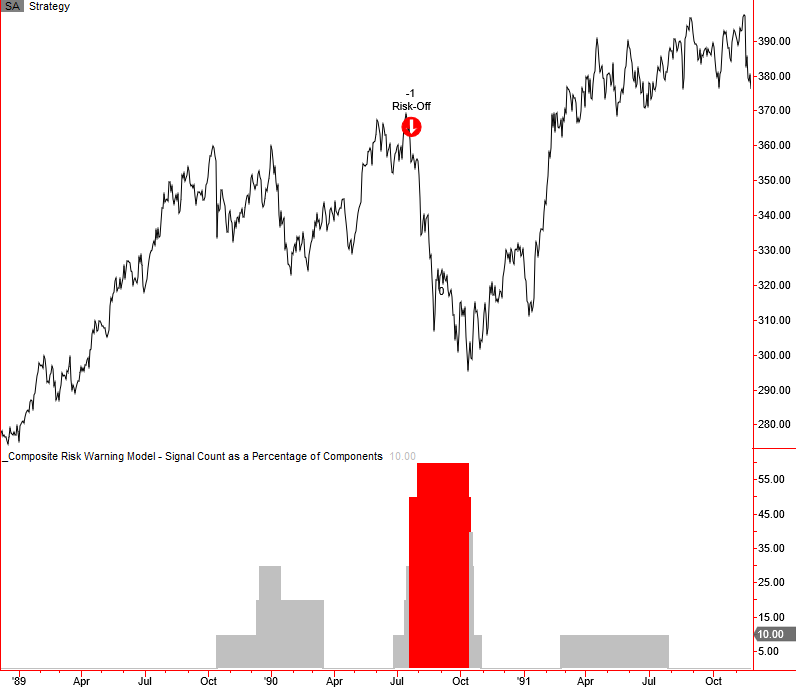
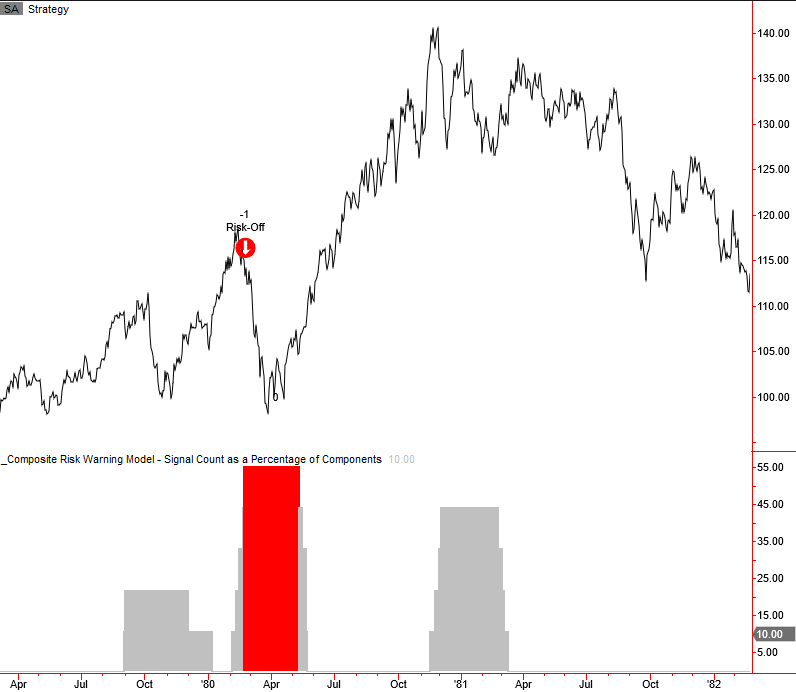
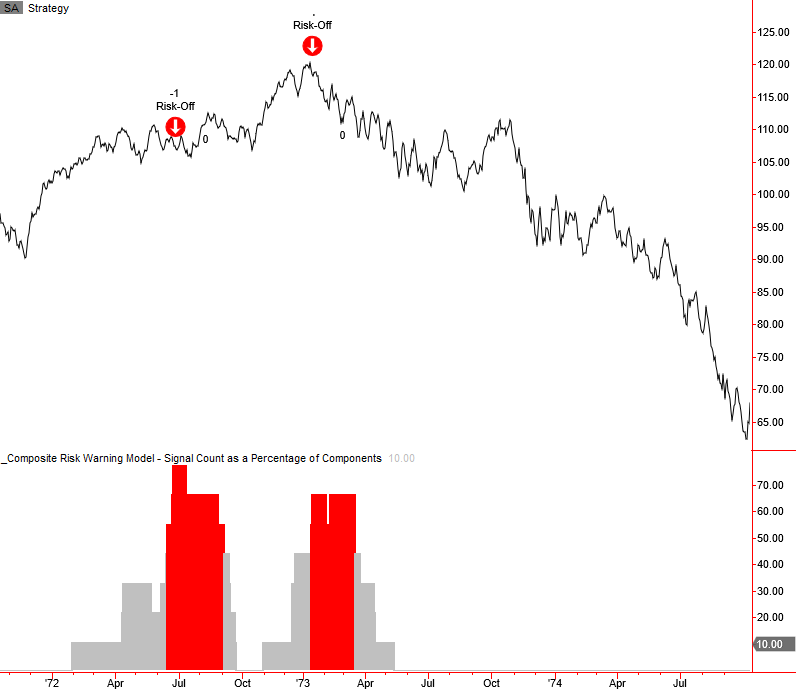
As one can, with only 12 warnings since 1929, the risk warning model contains big picture components that seek to identify significant inflection points in history. The model is unlikely to issue an alert when market breadth is strong. The 1968 market peak was an excellent example of when participation was strong, and the model failed to generate a signal. Please note, I calculate performance statistics in the chart as a short signal, whereas annualized returns result from buying the S&P 500.

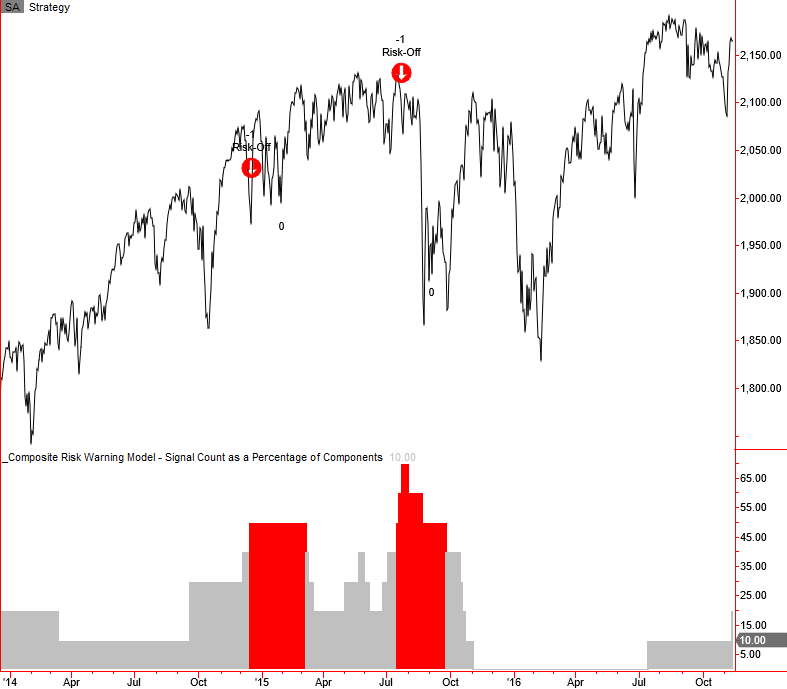
2015-16 Correction
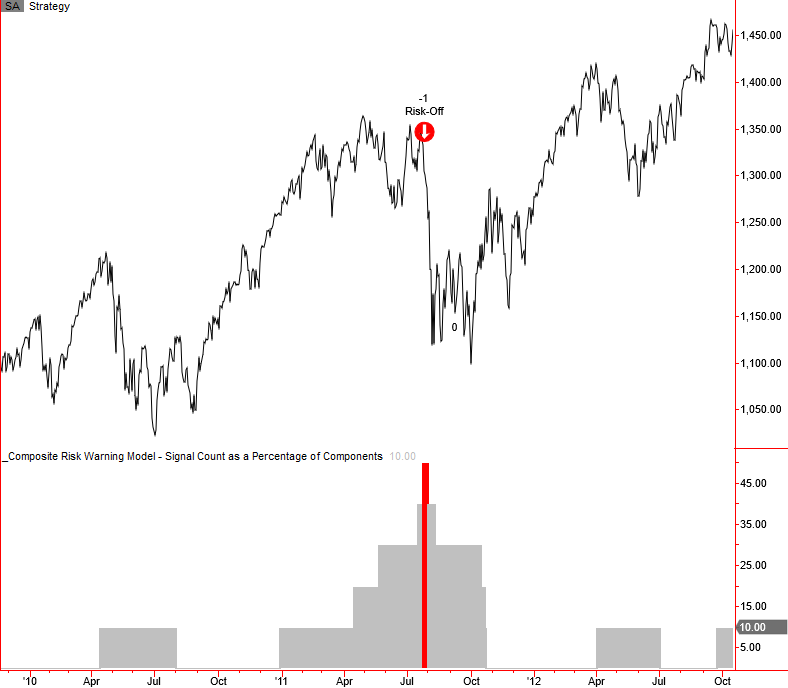
2011 Correction
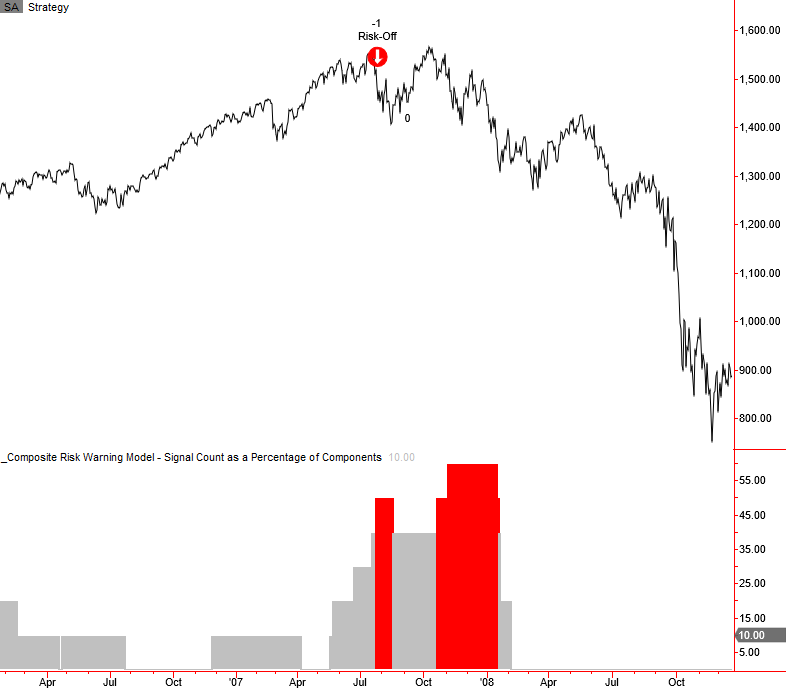
2007-08 Bear Market
1998 Correction & 2000-02 Bear
1990 Correction
1980 Correction and Bear
1973-74 Bear Market
1929-32 Bear Market
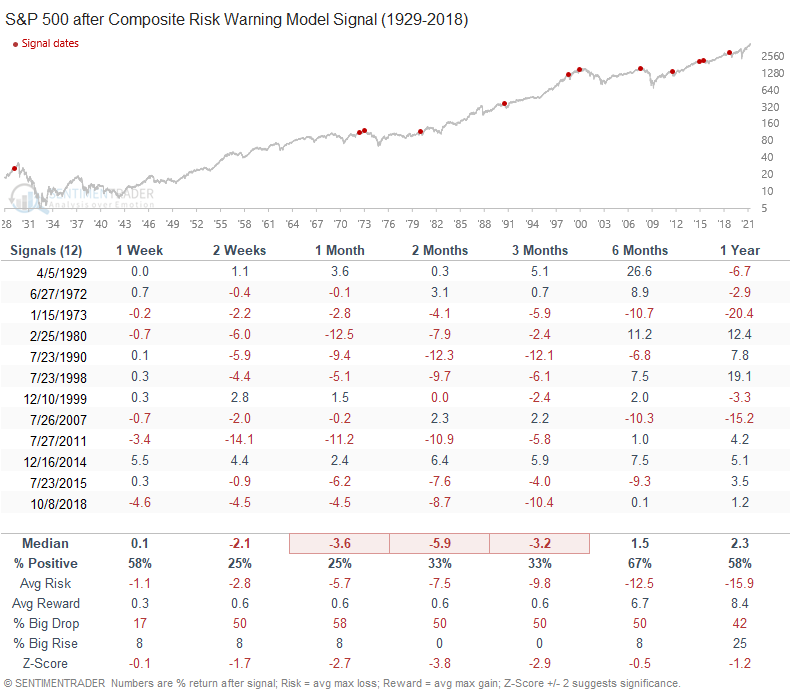
Signal Performance
As one can see, performance is weak in the 2-12 week timeframe with several notable z-scores.
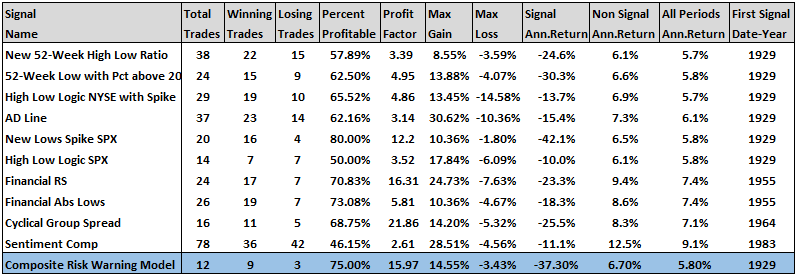
Composite Risk Warning Model Component Statistics
The following table contains trading statistics for the individual composite components. While each of the ten members is independent and robust, a weight-of-the-evidence framework enhances the model's predictive nature. As the Japanese proverb states, "A single arrow is easily broken, but not ten in a bundle."
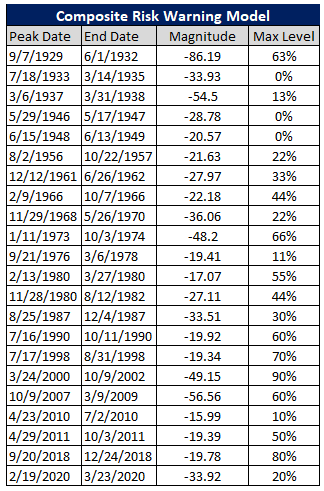
Max Signal Count as a Percentage of Components for Bear Markets and Corrections > 15%
The following table contains the composite signal count max level for bear markets and greater than 15% corrections. I would note that several of the bear market peaks that did not trigger a signal did show a signal count in the 20-40% range.
Historical TCTM Risk Warning Thoughts
As one can see from reviewing the historical charts, it's not uncommon to see the risk warning model trigger an alert well before a market peak. Some of the more notable instances occurred in 1929, 1973, and 2000. I would also call attention to the potential for the model to remain at a high level as some signals will continue to trigger and extend the count. Because the composite utilizes several long-duration measures, it's rare to see alerts in the first year and a half of a new bull market. The April 2010 correction is an excellent example as the signal count reached 10%.
Conclusion: It's unlikely that a risk warning model signal triggers in the near term, given the long-term nature of the composite members. The sentiment component continues to influence the signal count. If the model issues an alert one day, I will reduce exposure as the risk warning model overrides the long-term trend condition for a window period. As always, one should view the TCTM as a complementary component to your research process.

