
Important Cyclical Groups Divergence Model

In notes on Tuesday and Wednesday, I shared two TCTM Composite Risk Warning Model components that seek to identify a potential risk-off environment based upon unhealthy conditions within the financial sector. Today, I want to share another TCTM Risk Warning Model that utilizes the financials in conjunction with several other economically sensitive groups. While the technology sector continues to grow as a percentage of our economy and dominates market-cap-based indexes, I believe one should not ignore the message from an indicator that I like to call "Important Cyclical Groups." The premise behind the indicator is that a healthy economy and bullish stock market should see favorable trends within the important cyclical group composite. It doesn't mean that the components have to lead the market, but one does not want to see them diverge from the broad market uptrend in a meaningful way.
Components
- Automobiles & Auto Components Industry Group
- Transports Industry Group
- Homebuilding Sub-Industry
- Consumer Discretionary Sector Equal-Weight
- Financials Sector Equal-Weight
- Industrials Sector Equal-Weight
- Small Cap Index
Indicator Construction
The important cyclical group's indicator is a simple one to construct. I measure the percentage below a rolling 252-day high for each group and then calculate the average for all groups. The groups are equal-weighted.
Important Cyclical Groups Divergence Model
The important cyclical groups model seeks to identify instances in history when the composite indicator of economically sensitive groups diverges significantly from the S&P 500. The model will issue an alert based upon the following conditions.
Signal Criteria # 1
Condition1 = Composite indicator crosses above -3%. i.e., a reset
Condition2 = 1-Month linear regression trend for the composite indicator is negative. i.e., the indicator is declining.
Condition3 = 4-Month linear regression trend for the composite indicator is negative. i.e., the indicator is declining.
Condition4 = S&P 500 Index <= 3.0% from 252-Day High
Condition5 = The composite indicator crosses below -7.75%.
If Condition 1-5, signal risk-off.
Signal Criteria # 2
Condition1 = S&P 500 Index closes at a 252-Day High
Condition2 = 2-Month linear regression trend for the composite indicator is negative. i.e., the indicator is declining.
Condition3 = Composite Indicator is down >= -12.5%.
If Condition 1-3, signal risk-off.
Please note, I created signal #2 to identify extreme situations like 2000.
Let's take a look at some charts and the historical signal performance.
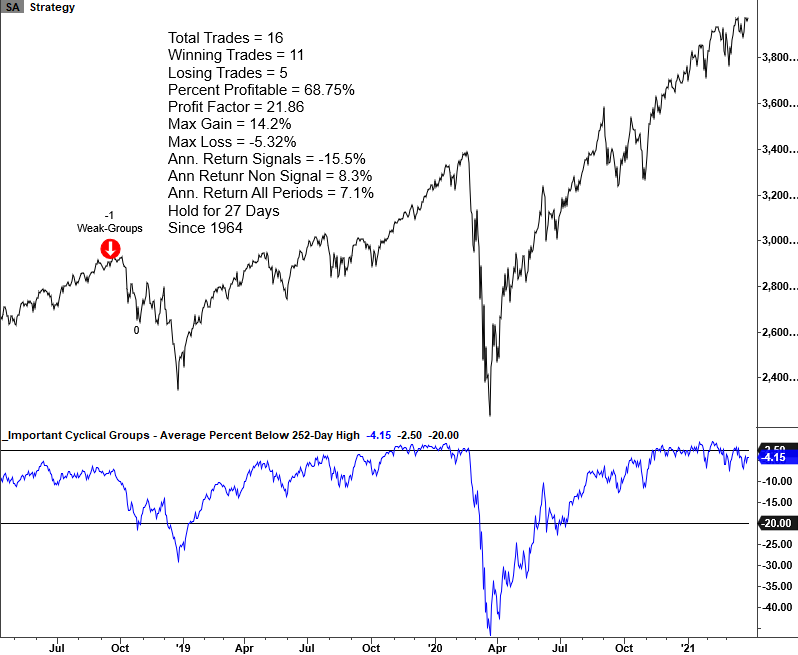
Current Day Chart
Please note, I calculate performance statistics in the chart as a short signal, whereas annualized returns result from buying the S&P 500.
2015/16 Oil/Commodity Bear
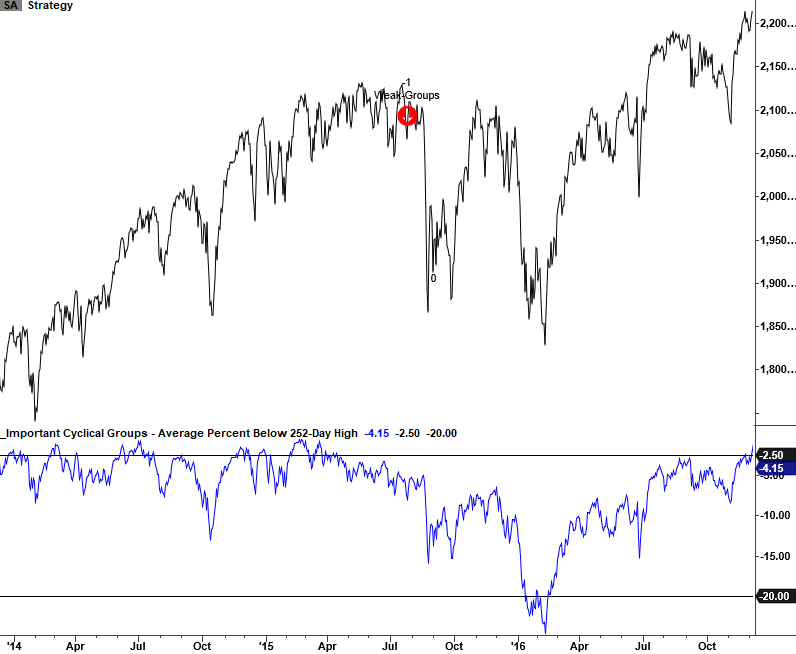
2011 Eurozone Debt Crisis

2007-08 Financial Crisis
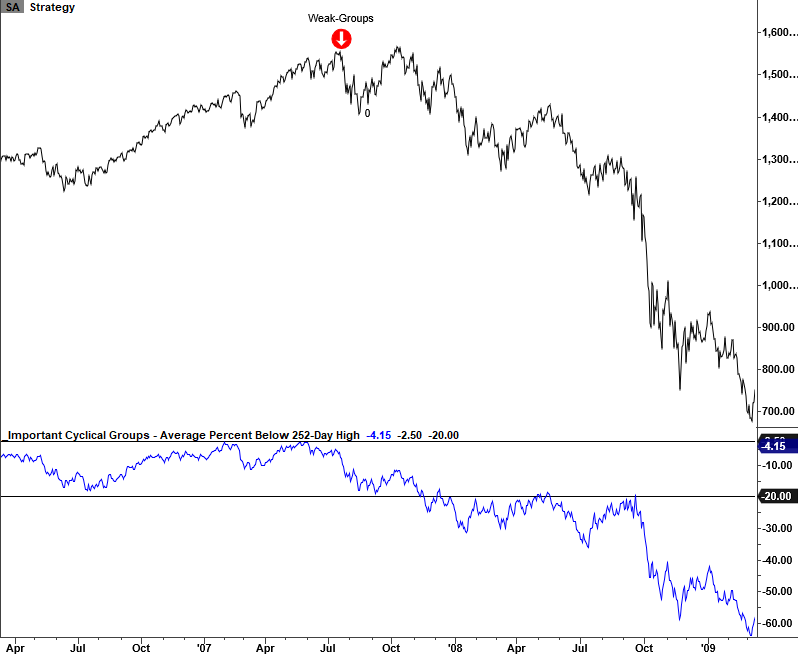
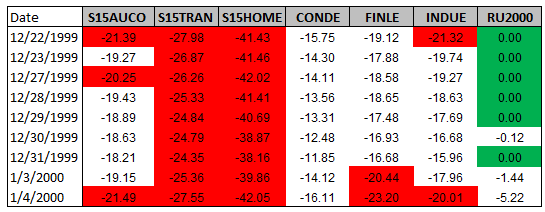
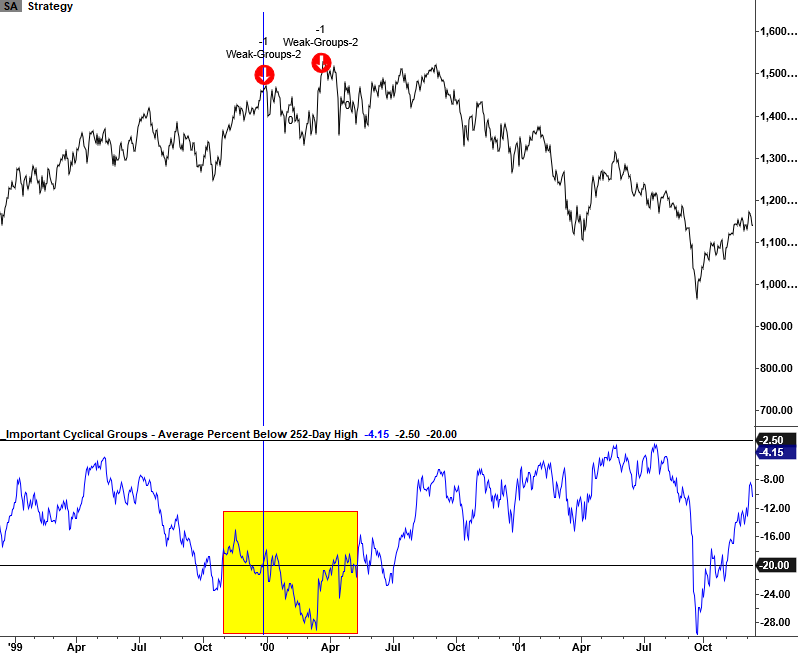
2000 Internet Bubble
The 2000 internet bubble represented the largest divergence in history for the important cyclical groups indicator. When the first signal triggered on 12/29/1999, the group average was 18.99% below the rolling 252-day high as the S&P 500 registered a new all-time closing high.
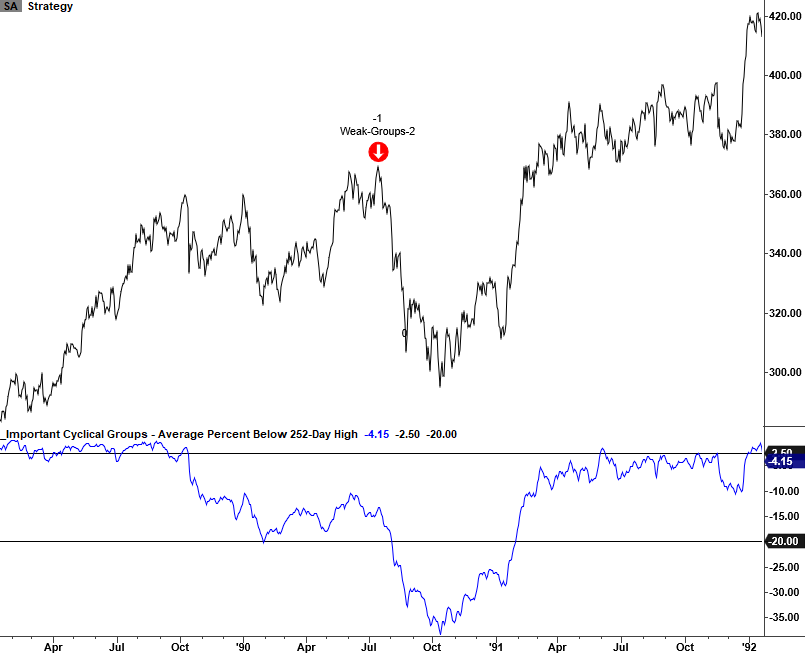
1990 Savings & Loan & Iraq Oil Spike
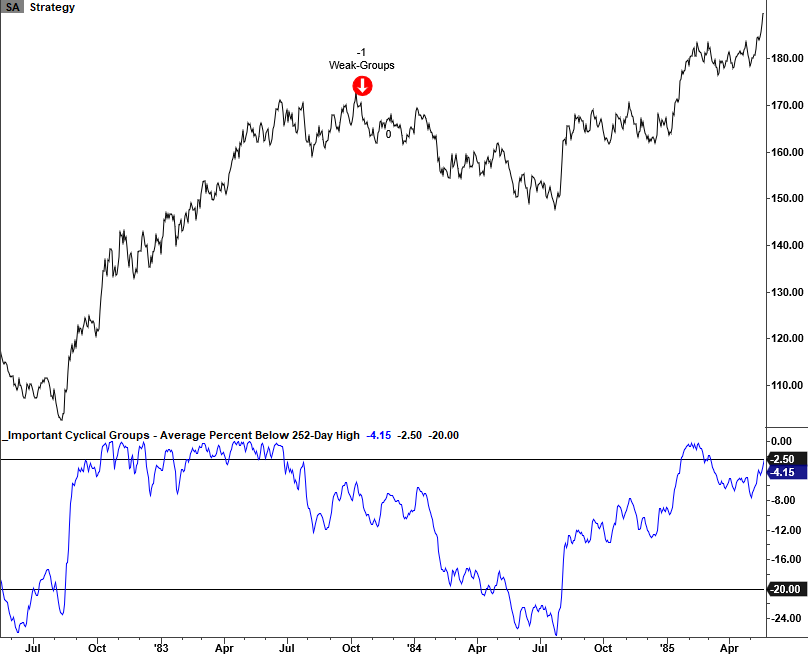
1983-84 Correction
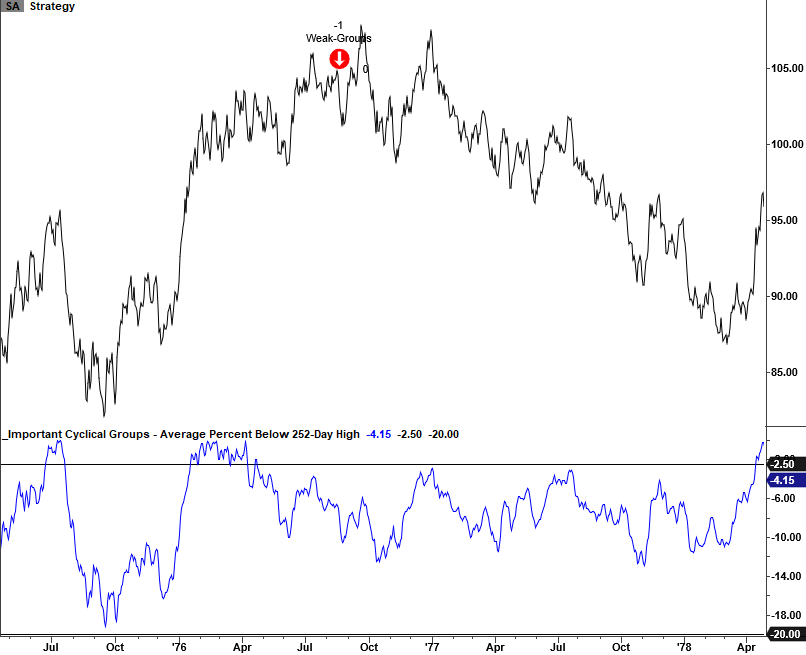
1976-78 Correction
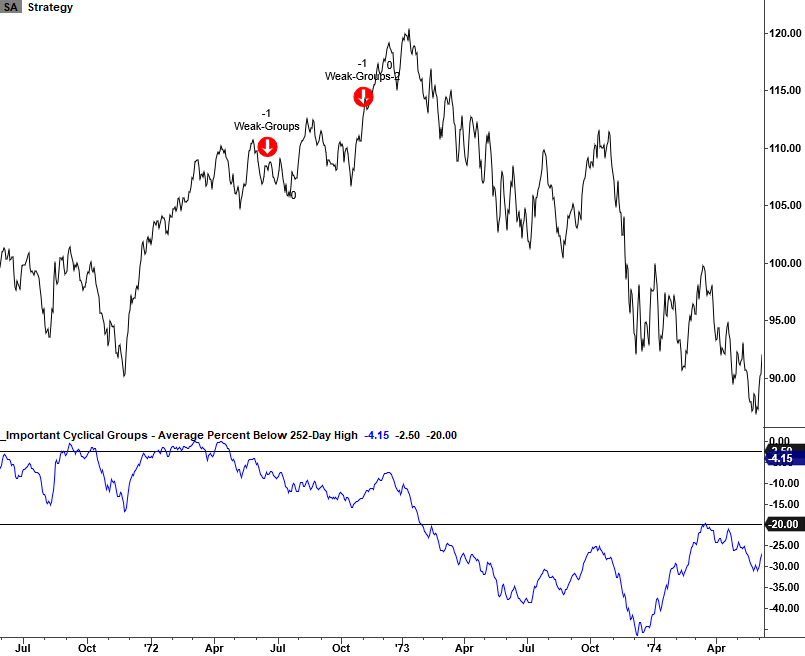
1973-74 Bretton Woods/Nixon Shock/Oil Crisis
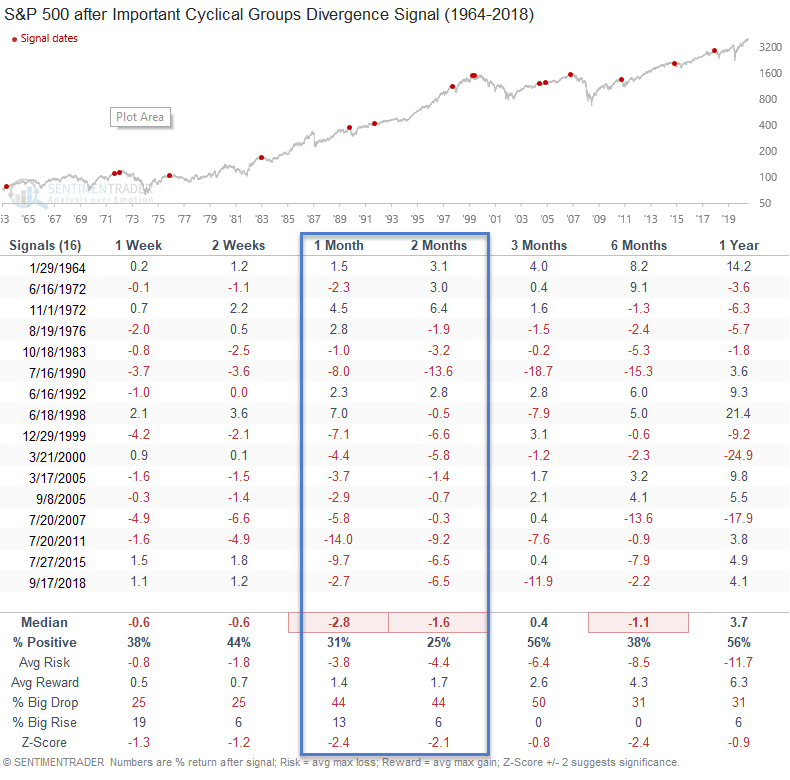
Signal Performance
As shown in the table below, performance is weak across all timeframes with several unfavorable risk/reward profiles.
Conclusion: While growth-oriented technology groups get all the glory, one should always respect the economically sensitive groups' market message. For now, the market message remains constructive.