S&P 500 High Low Logic Risk-Off Model

In my note on Thursday, I shared my modified version of the NYSE High Low Logic Index. As a reminder, the indicator created by Norman Fosback seeks to identify market environments with inconsistent participation as measured by a high number of 52-week highs and lows. The S&P 500 version is also a component of the TCTM Risk Warning Model. I use two versions of the High Low Logic Index in the RWM to isolate two vastly different high-quality groups. Like the NYSE version, I utilize a spike in the percentage of new lows as a trigger once the indicator is above the warning level. However, the S&P 500 version uses the original concept exponential moving average length of 50 days versus the 40 day moving average for the NYSE version.
Please note, we continue to work on the TCTM programming for the website. For now, I will continue to update subscribers on any new developments.
Components
1.) Percentage of S&P 500 252-Day Highs
2.) Percentage of S&P 500 252-Day Lows
NYSE High Low Logic Index Risk-Off Model
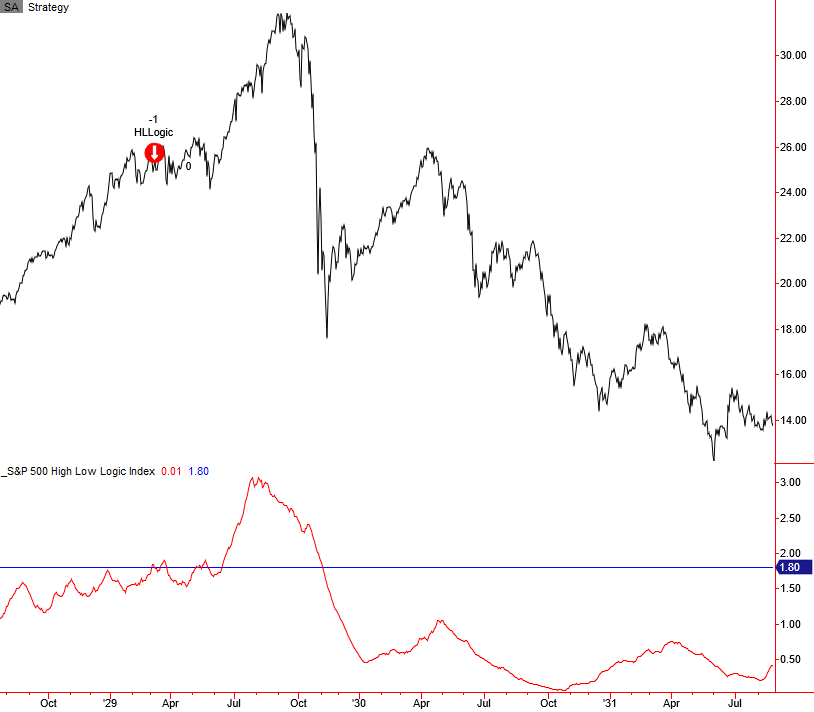
The S&P 500 High Low Logic Index Model seeks to identify instances in history when the High Low Logic Index exceeds a user-defined threshold, and new lows start to expand. The model will issue an alert based upon the following conditions.
Signal Criteria
Condition1 = High Low Logic Index >= 1.8%.
Condition2 = Percentage of S&P 500 252-Day Lows >=4.5%.
Condition3 = S&P 500 Index <= 5.0% from 252-Day High
Condition4 = High Low Logic Index resets below 1.4%. i.e., the reset screens out duplicate signals.
If Condition 1-4, signal risk-off.
Let's take a look at some charts and the historical signal performance.
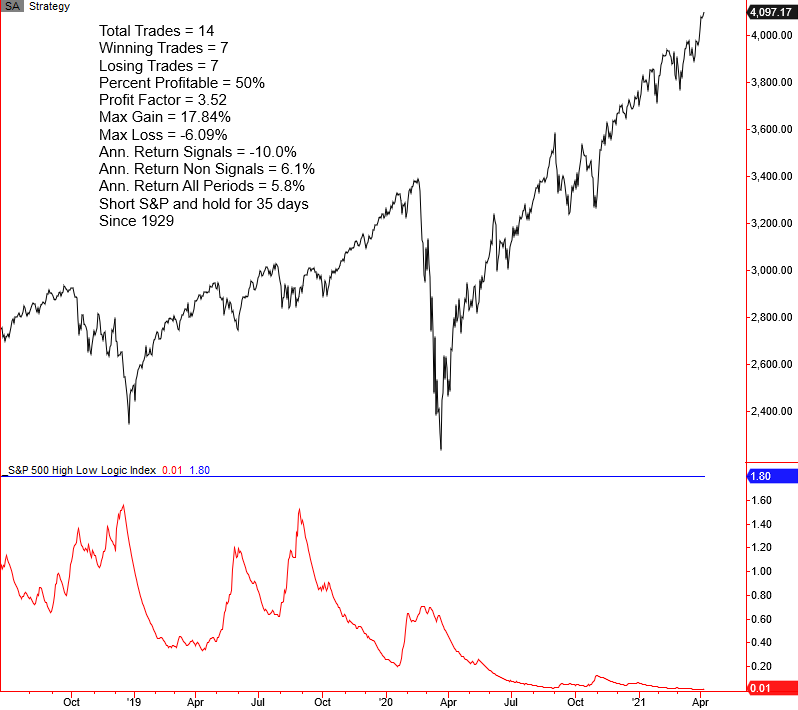
Current Day Chart
Please note, I calculate performance statistics in the chart as a short signal, whereas annualized returns result from buying the S&P 500.
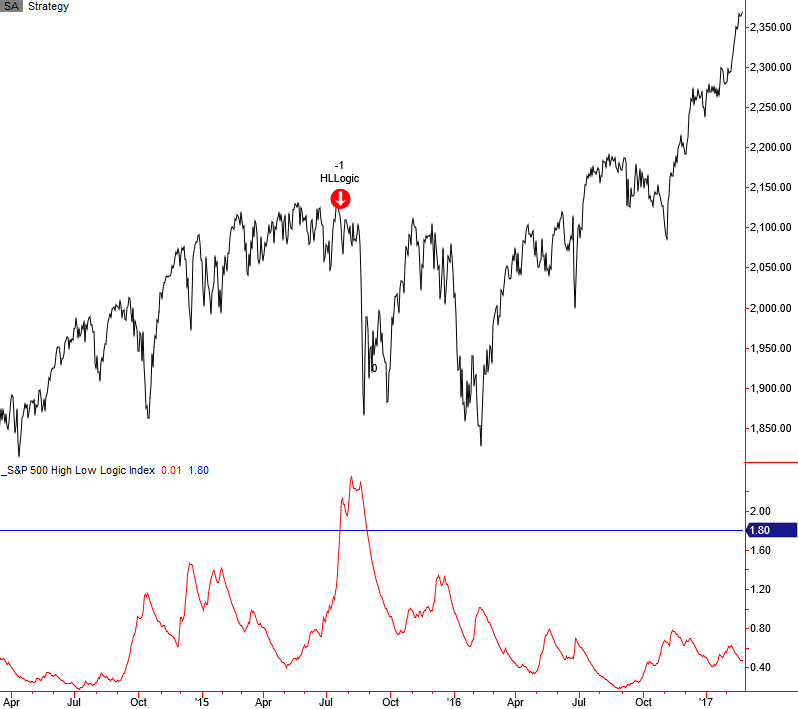
2015-16 Oil/Commodity Crash
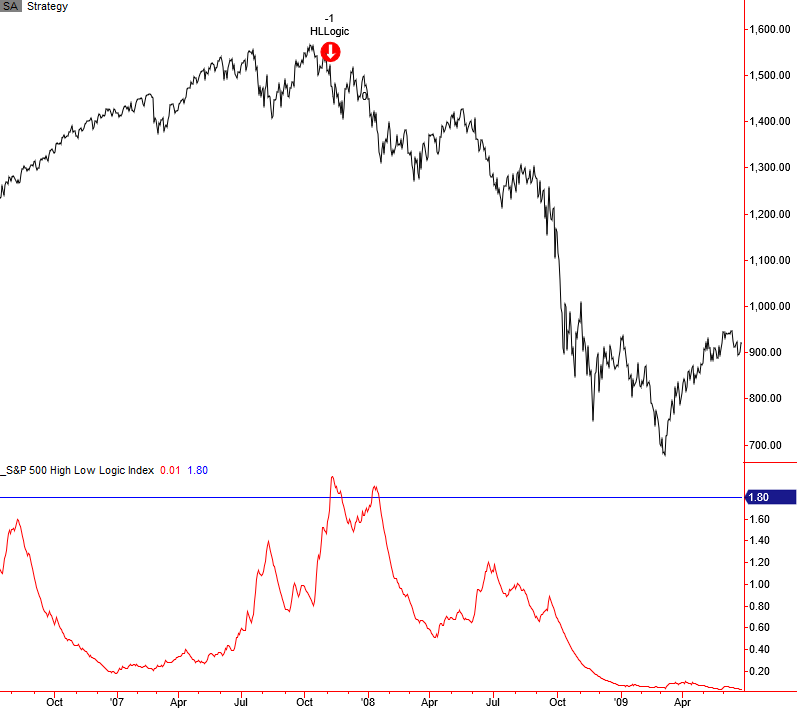
2007-08 Financial Crisis
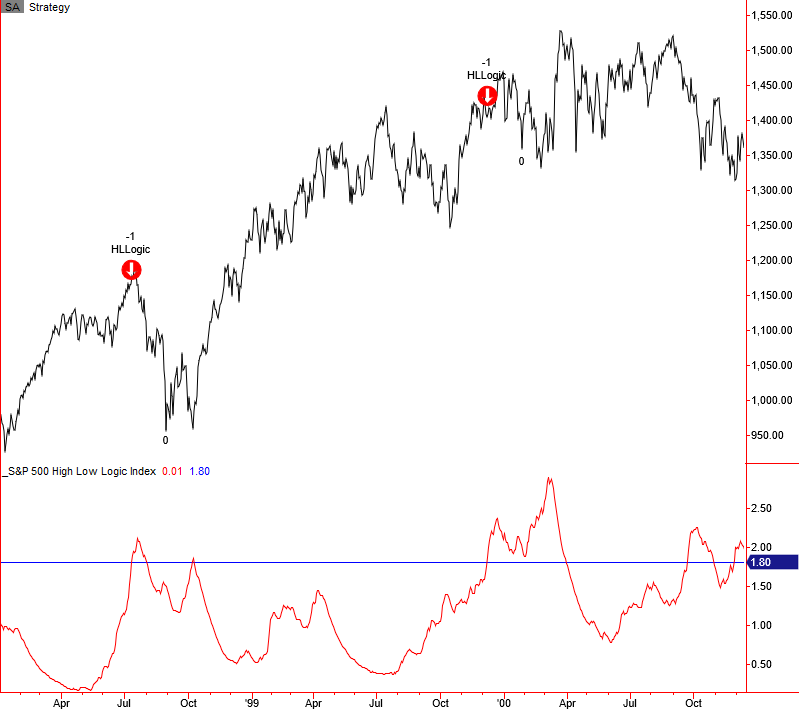
1998 LTCM and Internet Bubble
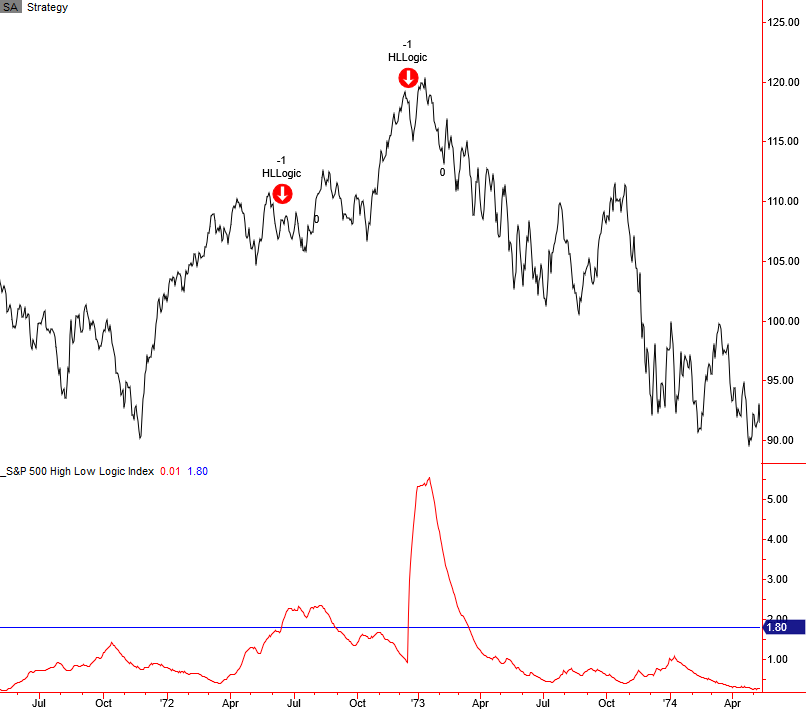
1973-74 Bretton Woods/Nixon Shock/Oil Shock
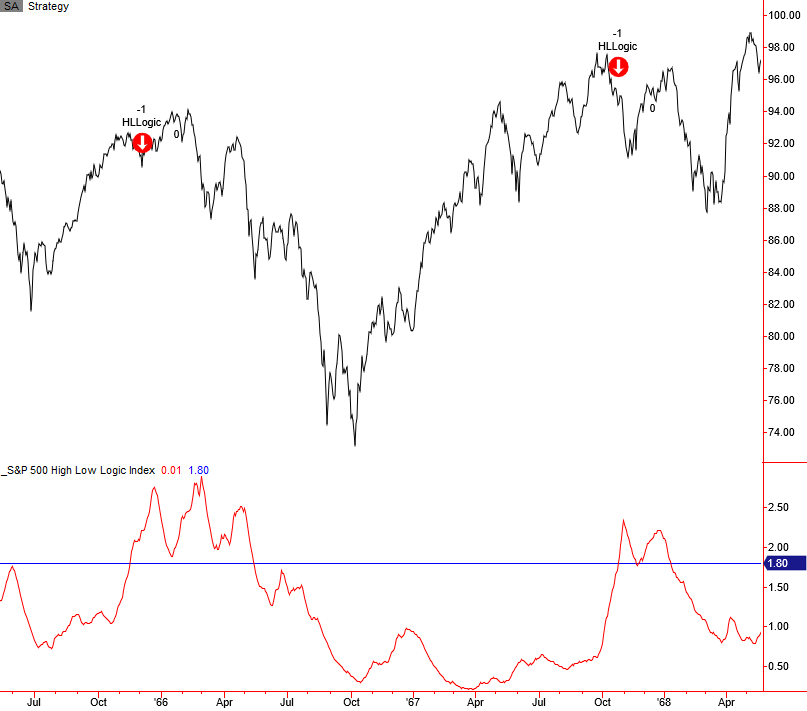
1966 Bear Market
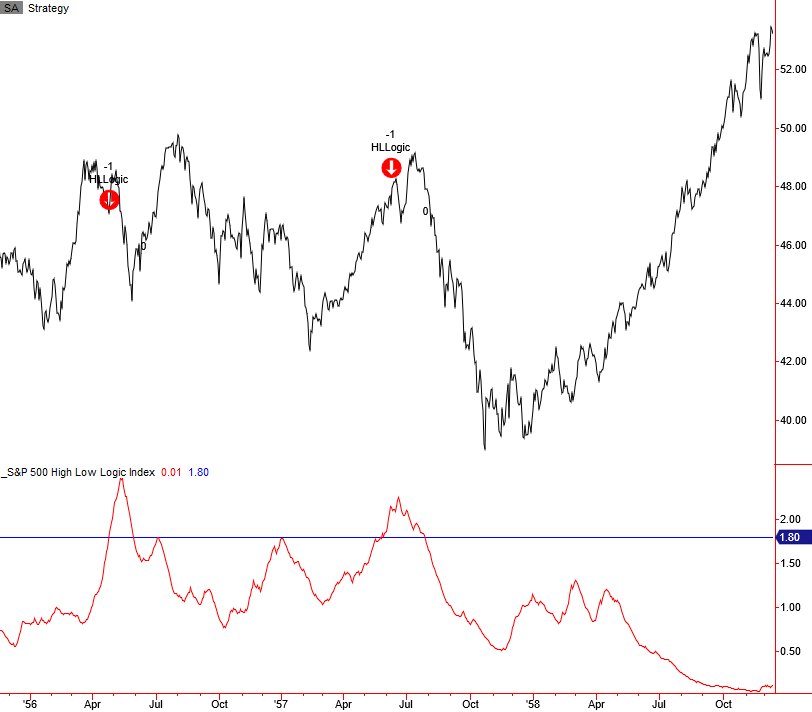
1957-58 Bear Market
1929-32 Bear Market
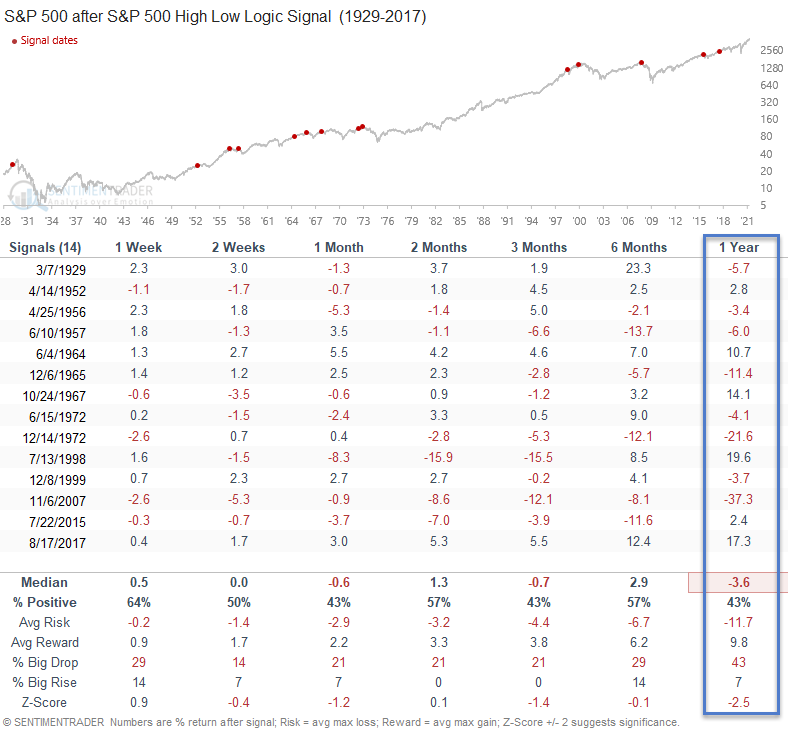
Signal Performance
Historical TCTM Risk Warning Model Table
The following table provides a historical signal perspective for components within the TCTM Risk Warning Model. A "yes" in a model column indicates that a signal triggered either before or after a significant correction or bear market peak.
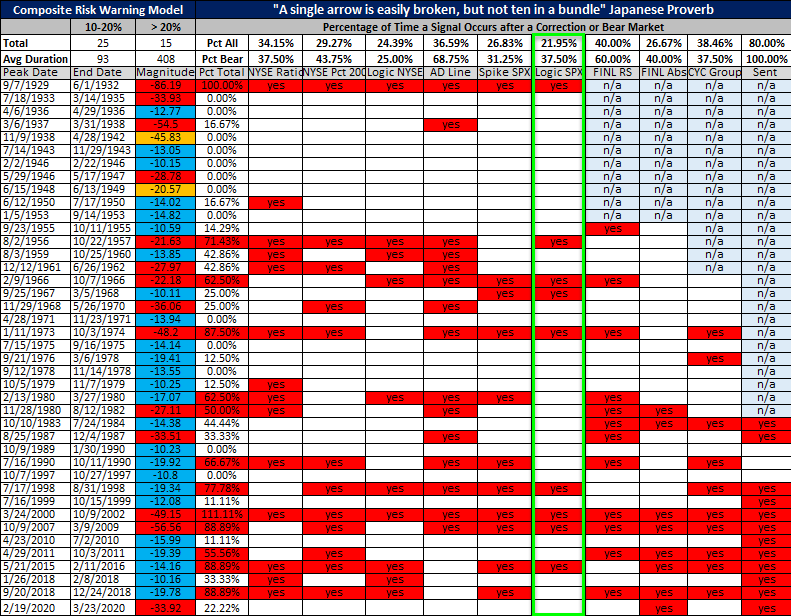
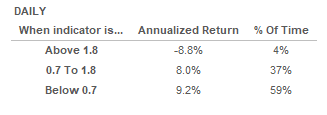
Conclusion: The S&P 500 High Low Logic Index remains low as the lesser of highs and lows drags along the bottom. As the table below shows, annualized returns for instances below the long-term average of 0.7% look solid compared to the returns when the indicator is above the warning level of 1.8%.
Returns since 1928