
Sentiment Composite Risk-Off Model

In today's note, I plan to conclude my review of the TCTM Risk Warning Model by sharing the sentiment component I use to identify a potential risk-off environment. Bullish market sentiment is more often than not synonymous with rising prices as investors believe the market will head higher in the future. Therefore, in most cases, bullish sentiment is a pre-condition to a potential trend change that will trigger an alert before most other indicators. When sentiment reverses from an extreme, take note.
Let's take a look at the composite components, construction, and signal criteria.
Source/Components
1.) Investors Intelligence
2.) National Association of Active Investment Managers
3.) Consensus Inc.
4.) Hulbert Financial Digest Nasdaq
5.) CBOE Equity Put/Call Ratio (10-Day Average)
Calculations
I rank each component versus the entire history from highest to lowest and average the group on an equal-weighted basis. Please note, I reverse the ranking for the put/call ratio to align it with the other sentiment measures.
Sentiment Composite Risk-Off Model
The sentiment composite model seeks to identify instances in history when the composite falls by a user-defined amount from an optimistic level. The model will issue an alert based upon the following conditions.
Signal Criteria
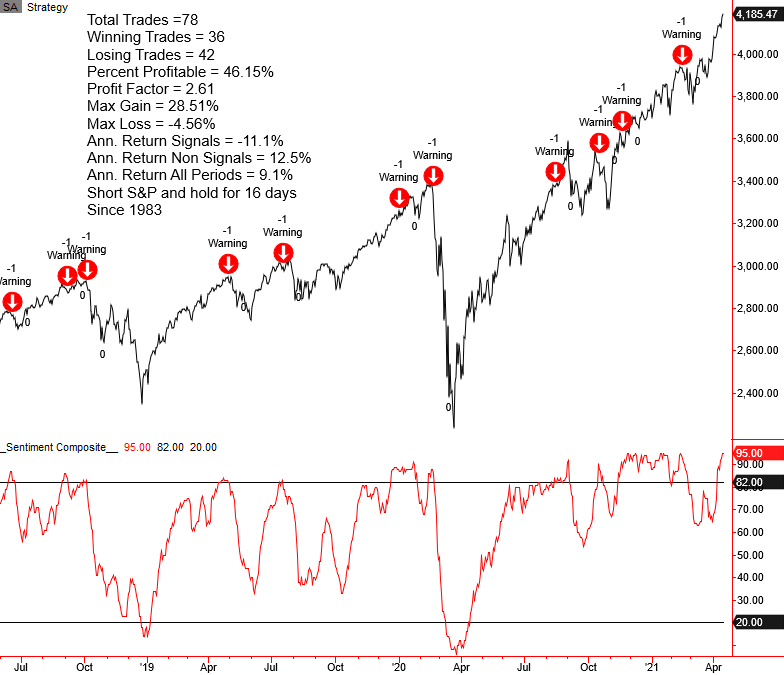
Condition1 = Composite increases above 82%.
Condition2 = Composite falls by 1.75% from subsequent high above 82%.
If Condition1 and Condition2 then signal risk-off.
Let's take a look at some charts and the historical signal performance.
Current Day Chart
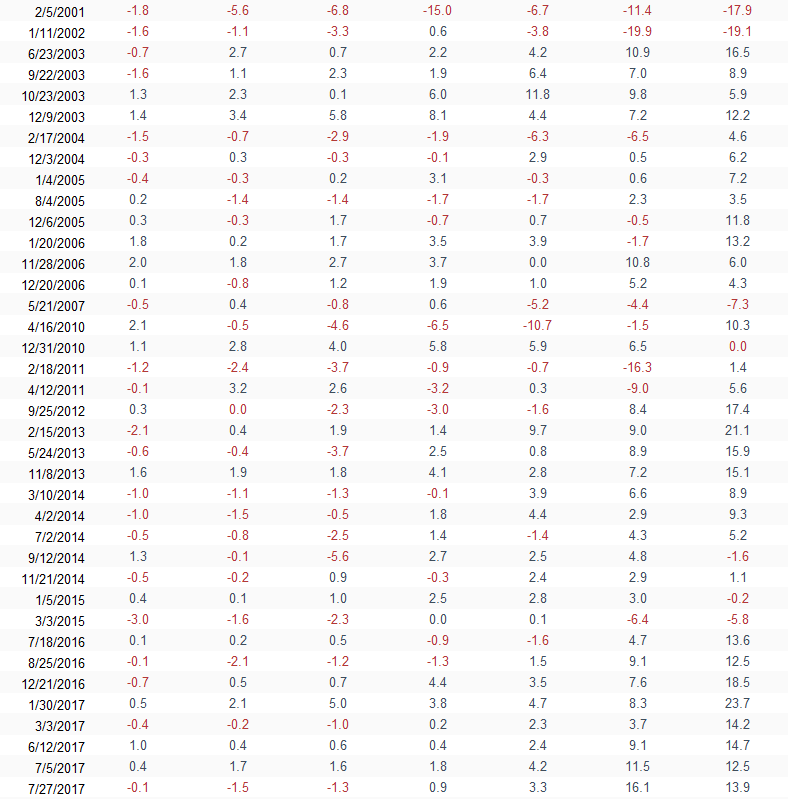
Please note, I calculate performance statistics in the chart as a short signal, whereas annualized returns result from buying the S&P 500.
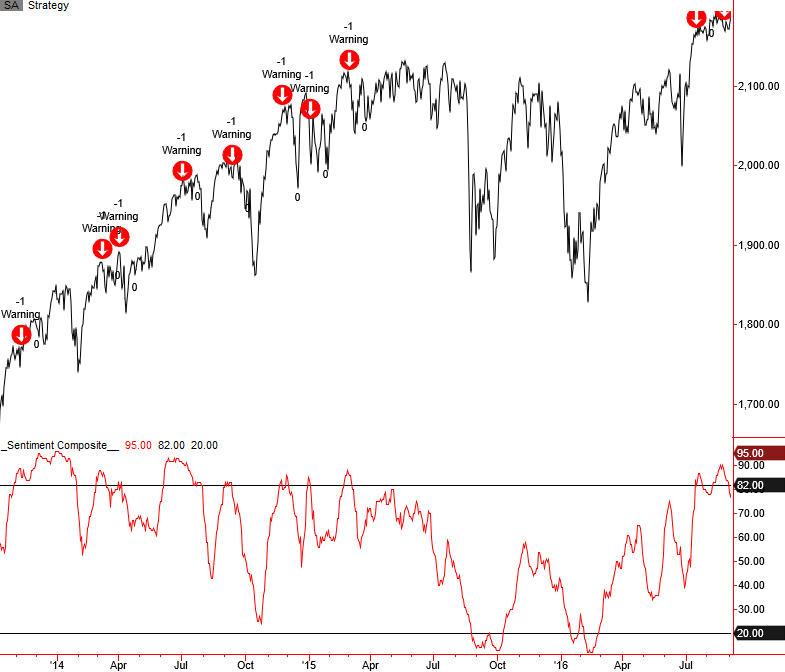
2015-16 Oil/Commodity Bear
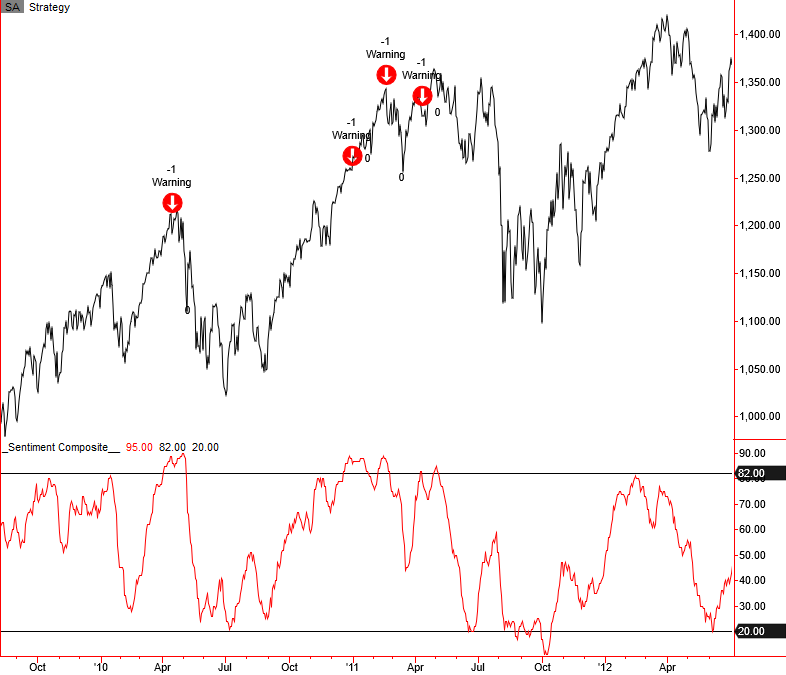
2011 Eurozone Debt Crisis
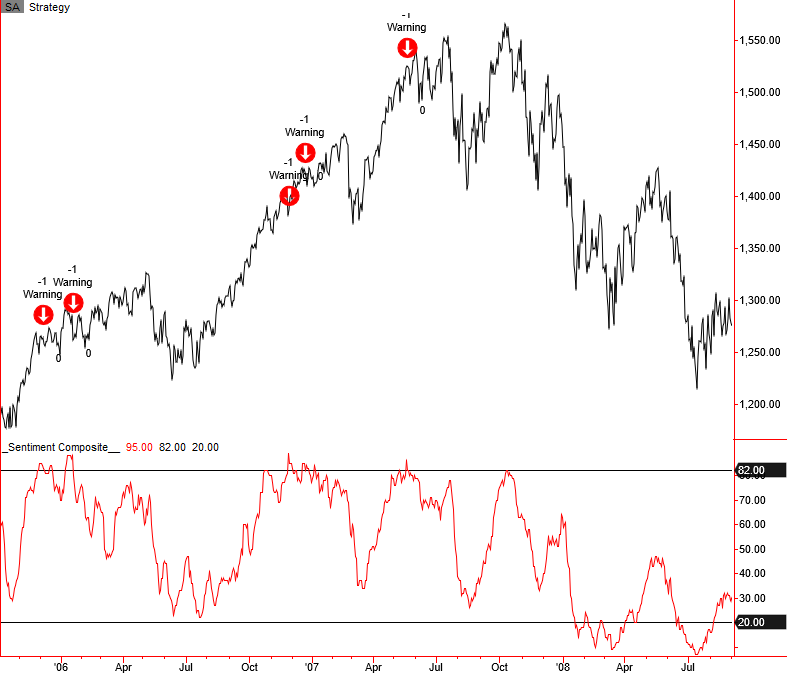
2007-08 Financial Crisis
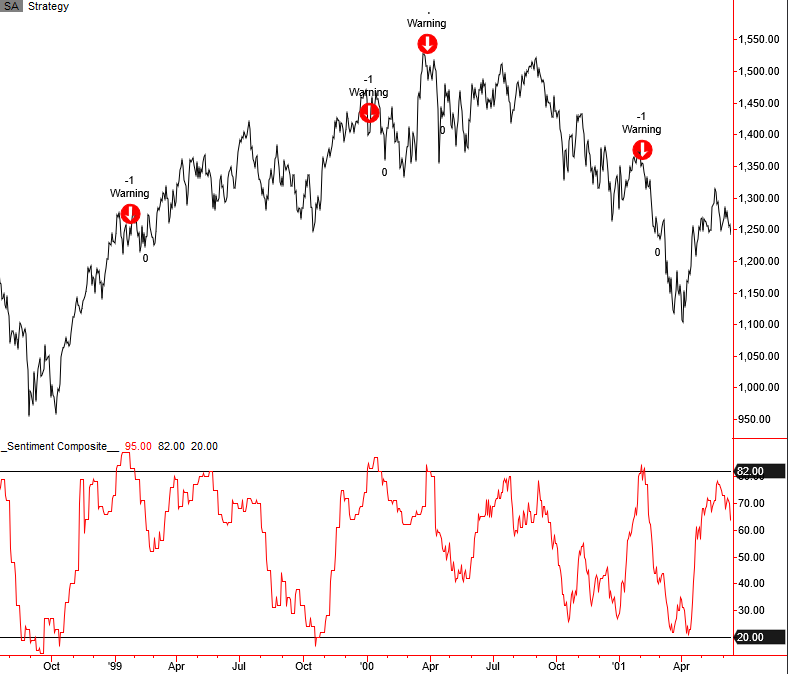
2000 Internet Bubble
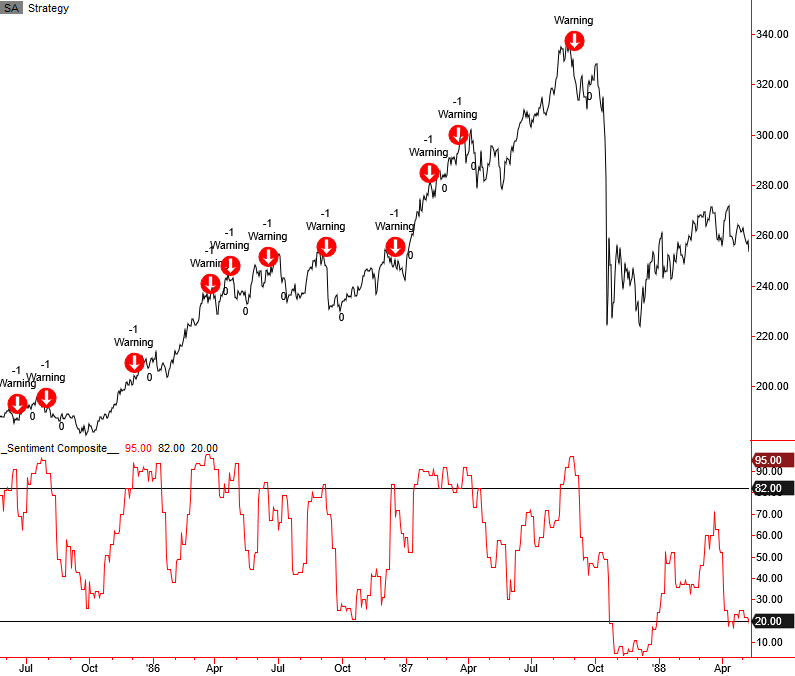
 1987 Crash
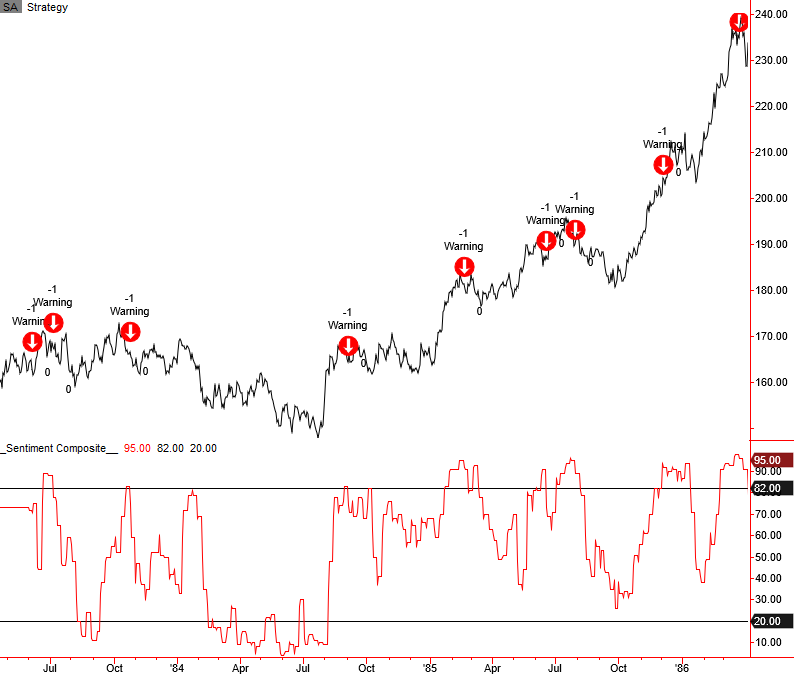
 1983-84 Correction
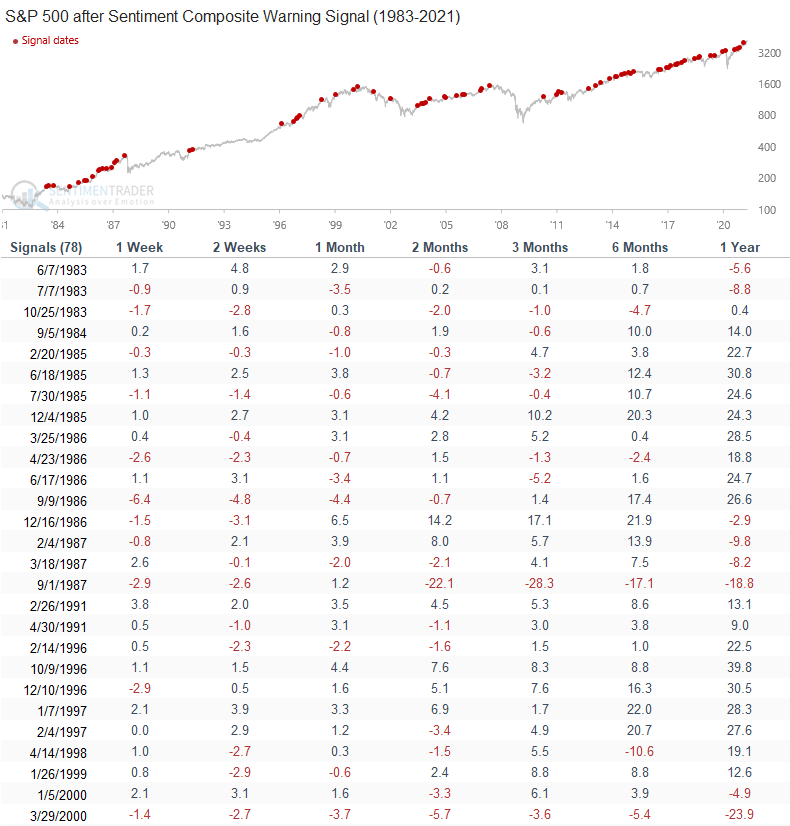
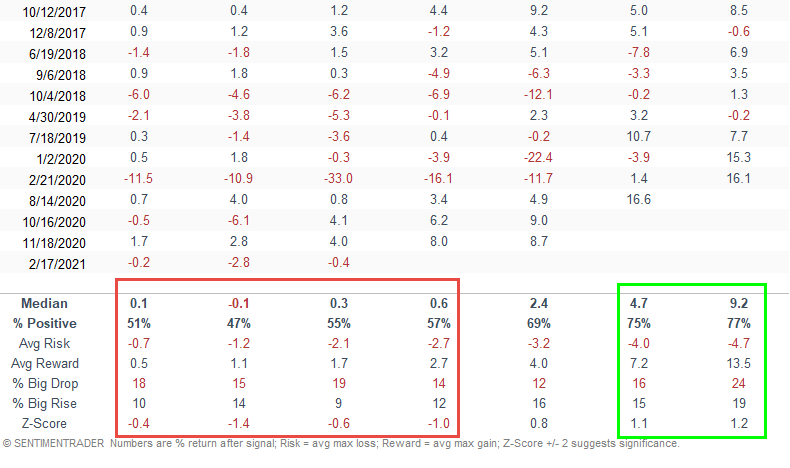
 Signal Performance
Signal performance is weak in the 1-8-week timeframe. Because optimistic sentiment is synonymous with rising prices in bull markets, it's not surprising to see good results in the 6-12-month window.
Historical TCTM Risk Warning Model Table
The following table provides a historical signal perspective for components within the TCTM Risk Warning Model. A "yes" in a model column indicates that a signal triggered either before or just after a significant correction or bear market peak.
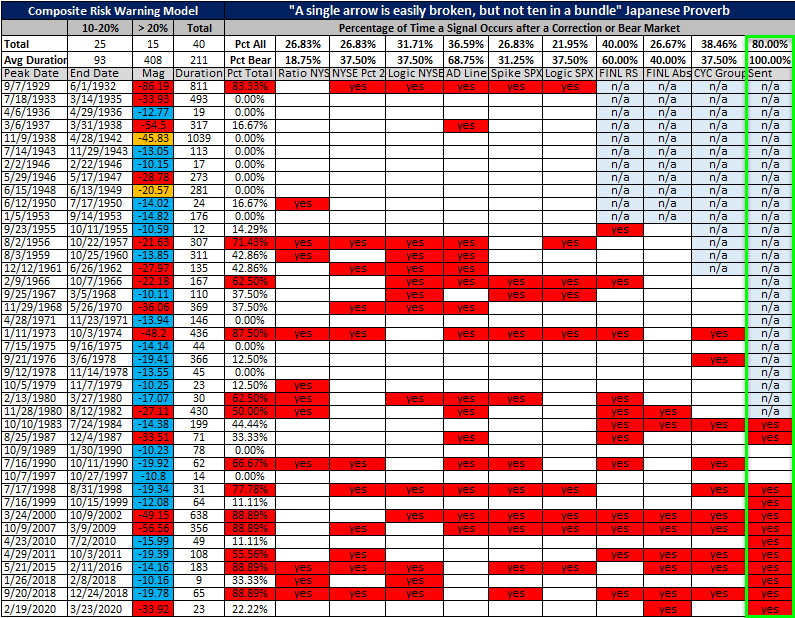
Conclusion: The sentiment composite is currently above the risk warning threshold level. Therefore, once the composite turns down, another signal will trigger. Because the TCTM Risk Warning Model is presently on a sentiment warning signal, the signal count for sentiment will extend further into the future.