
NYSE Advance-Decline Line Divergence Risk-Off Model

The cumulative advance-decline line is a classic market breadth indicator that maintains one of the best records for identifying a potential warning ahead of significant market peaks. As the famed investment strategist Bob Farrell once said, "Markets are strongest when they are broad and weakest when they narrow to a handful of issues." Given its propensity to identify meaningful market peaks, it should be no surprise that I created a divergence model that is a component in the TCTM Risk Warning Model. The model utilizes NYSE issues rather than Nasdaq issues for the following reasons. First, the NYSE exchange provides a higher-quality securities basket to measure when compared to the Nasdaq exchange. If you look at a long-term chart of the Nasdaq cumulative advance-decline line, you will understand why I prefer NYSE issues. The second reason for favoring the NYSE over the Nasdaq is the non-common stock issues traded on the NYSE. The so-called bond proxies can influence the AD line's direction in a manner that is worth noting. While the model is pretty straightforward, I would like to point out one critical condition. The model requires the AD line to be below its rolling 252-day high for 30 days or more before a signal can occur. I implemented this condition to identify a more significant divergence versus short-term noise that might resolve a week later.
Please note, we continue to work on the TCTM programming for the website. For now, I will continue to update subscribers on any new developments.
Components
1.) NYSE Advancing Issues
2.) NYSE Declining Issues
Calculations
1.) Apply a % range rank to the NYSE cumulative advance-decline line over a rolling 252-day period. 100% = highest 0% = Lowest.
2.) Count the number of days below a 252-day high for the cumulative advance-decline line.
NYSE Advance-Decline Line Divergence Risk-Off Model
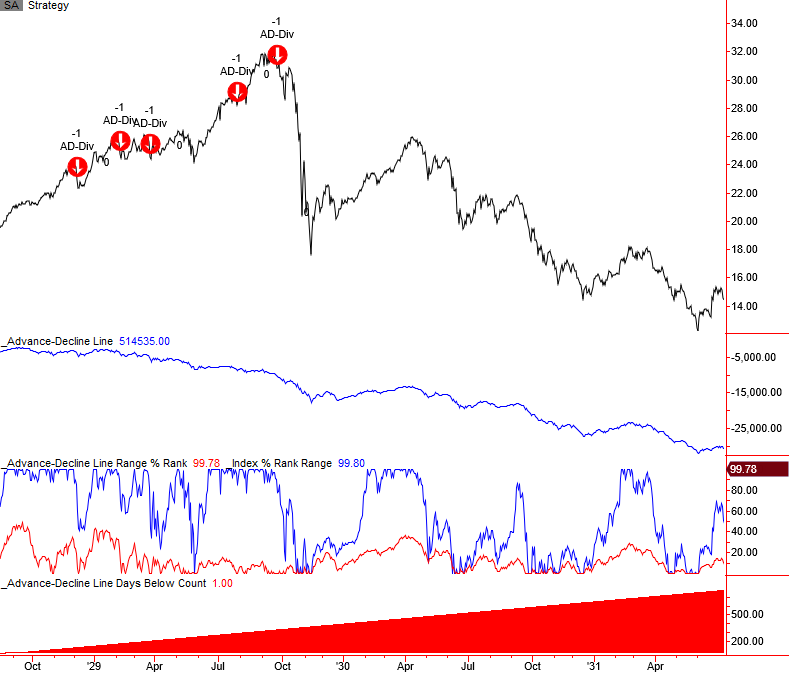
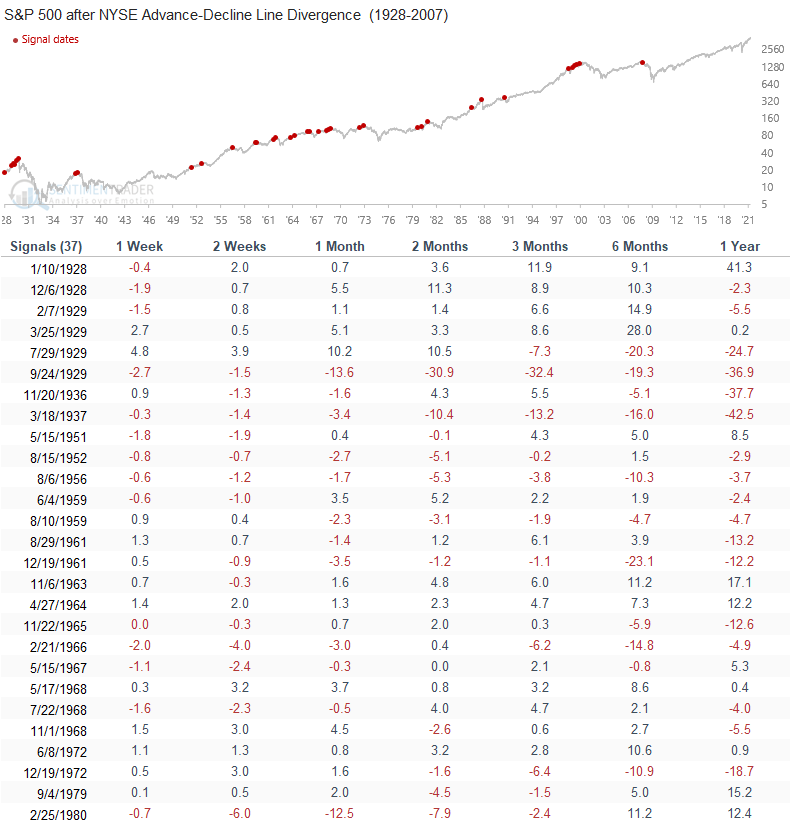
The NYSE Advance-Decline Line Divergence Model seeks to identify instances in history when the NYSE cumulative advance-decline line falls as the S&P 500 Index closes at a multi-year high. The model will issue an alert based upon the following conditions.
Signal Criteria
Condition1 = NYSE AD line % range rank <= 89.75%.
Condition2 = S&P 500 Index = 500-day high (close).
Condition3 = Days since 252-day high in the AD Line >= 30
Condition4 = If Condition 1-3, start days since true count
Condition5 = If day since true count <= 10 and the S&P 500 index closes at a 15 day low, signal risk-off.
Let's take a look at some charts and the historical signal performance.
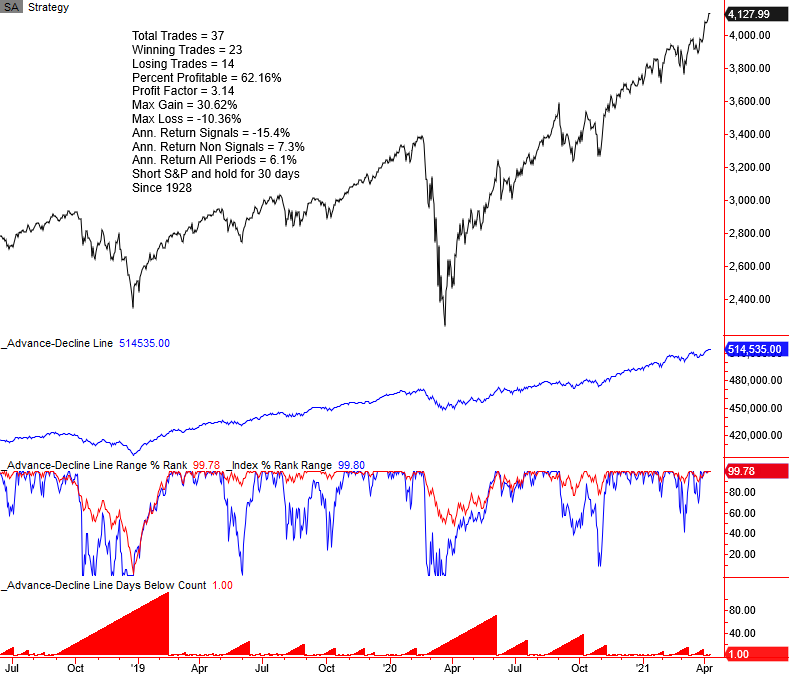
Current Day Chart
Please note, I calculate performance statistics in the chart as a short signal, whereas annualized returns result from buying the S&P 500. The AD line divergence model utilizes two exit signals. The first is a DIT exit with an optimal holding period of 30 days. The second exit signal is a failsafe stop that triggers when the AD line % range rank indicator hits 100%. i.e., a new 252-day high in the AD line. The failsafe stop exit has only triggered two times in history. I always like to see a small number of failsafe stop exits when designing a signal.
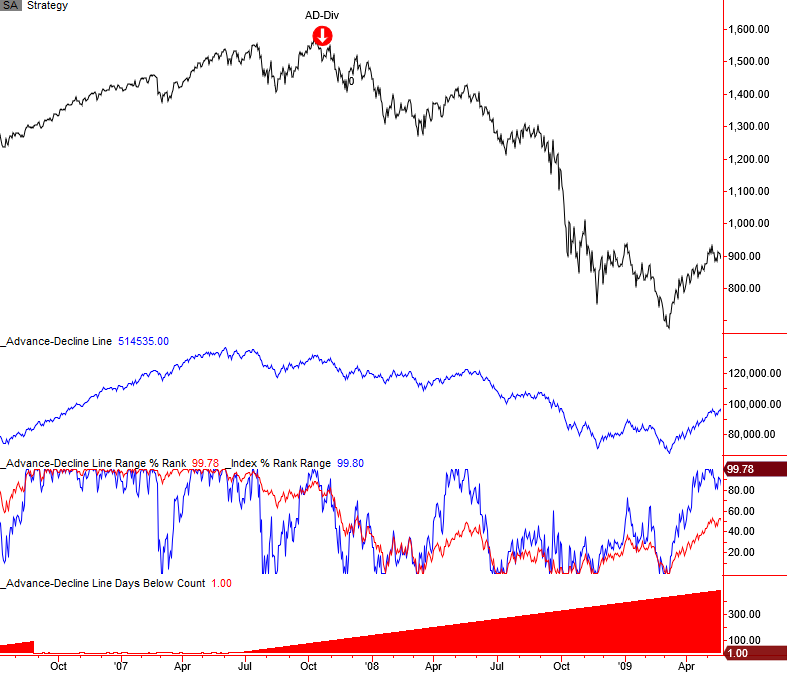
2007-08 Financial Crisis
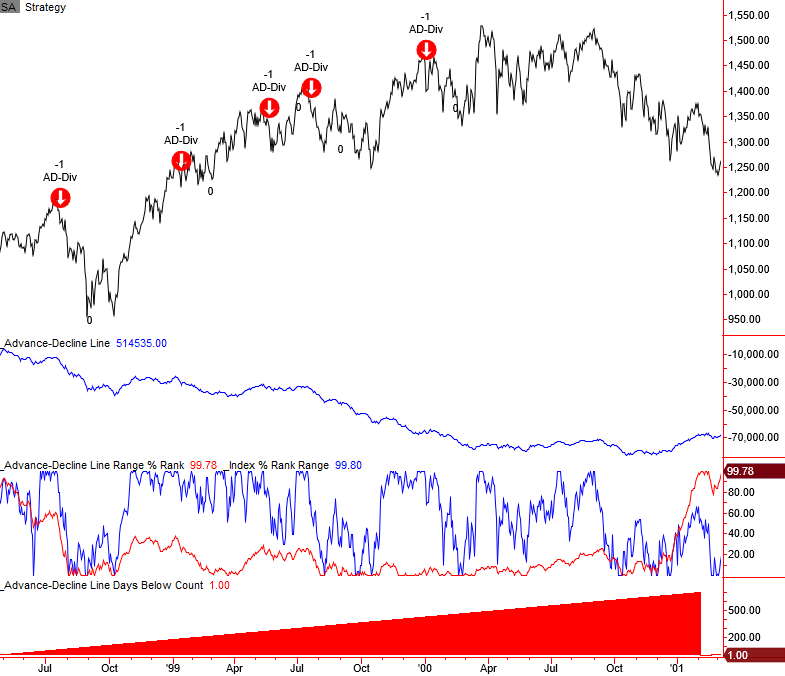
1998 LTCM and Internet Bubble
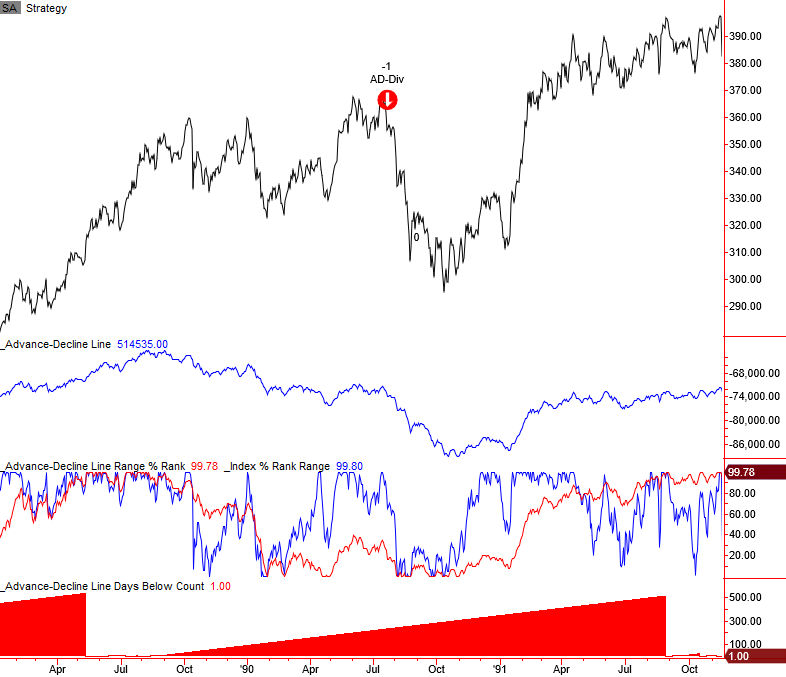
1990 Savings & Loan/Iraq Oil Spike
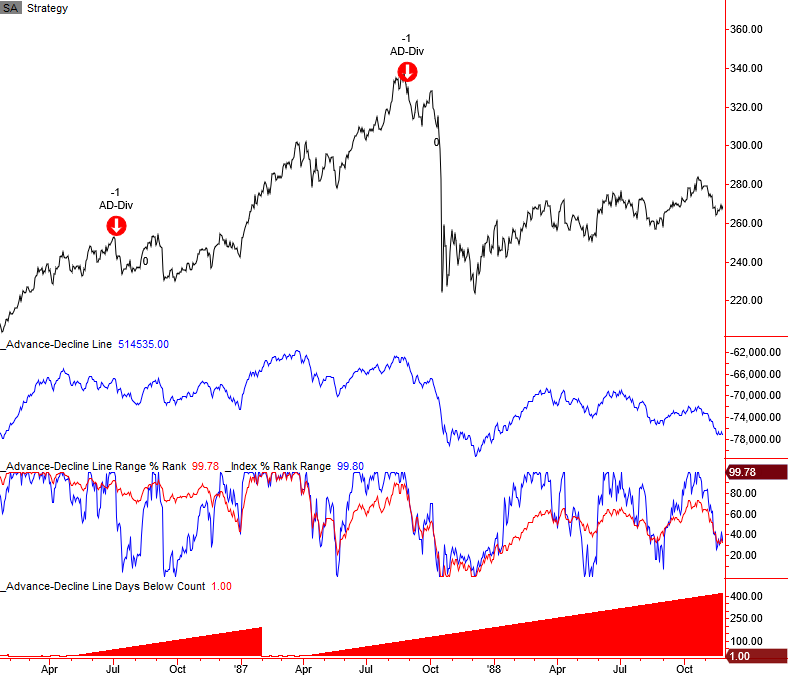
1987 Crash
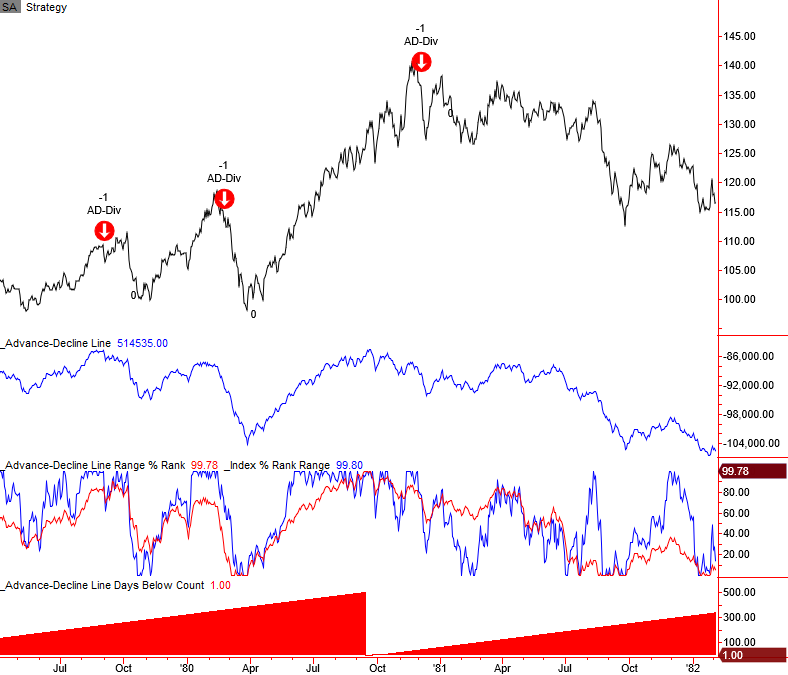
1980 Oil/Commodity Bubble
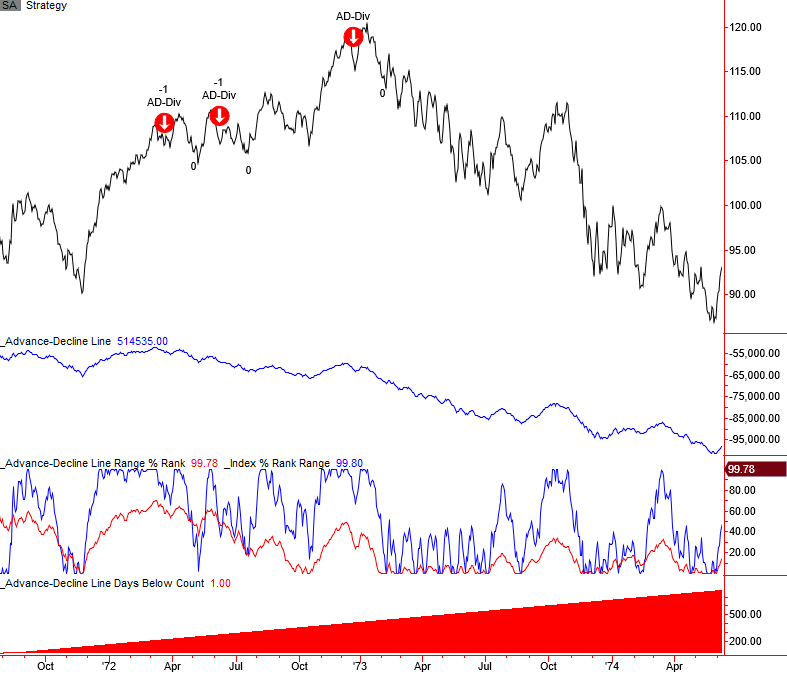
1973-74 Bretton Woods/Nixon Shock/Oil Embargo
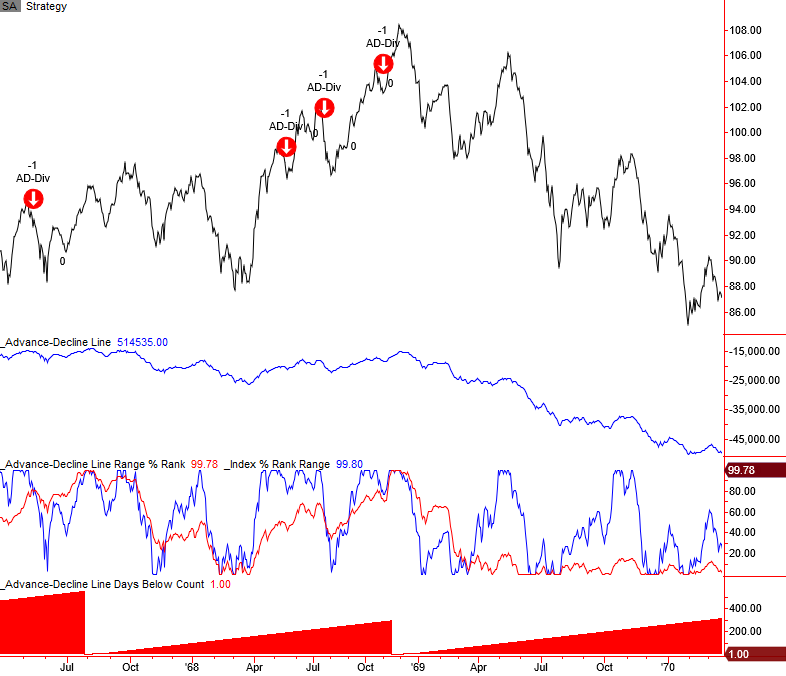
1968-70 Bear Market
1966 Bear Market
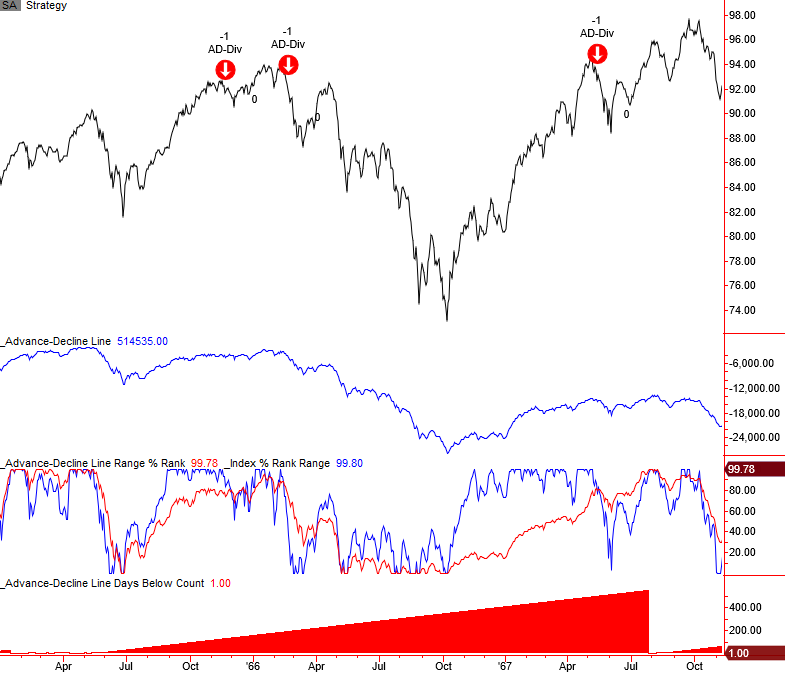
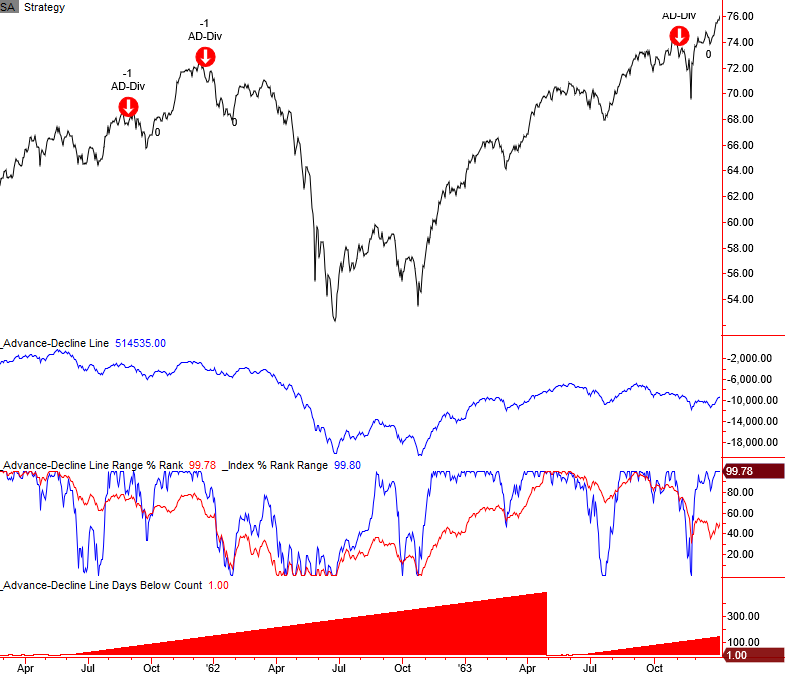
1962 Bear Market
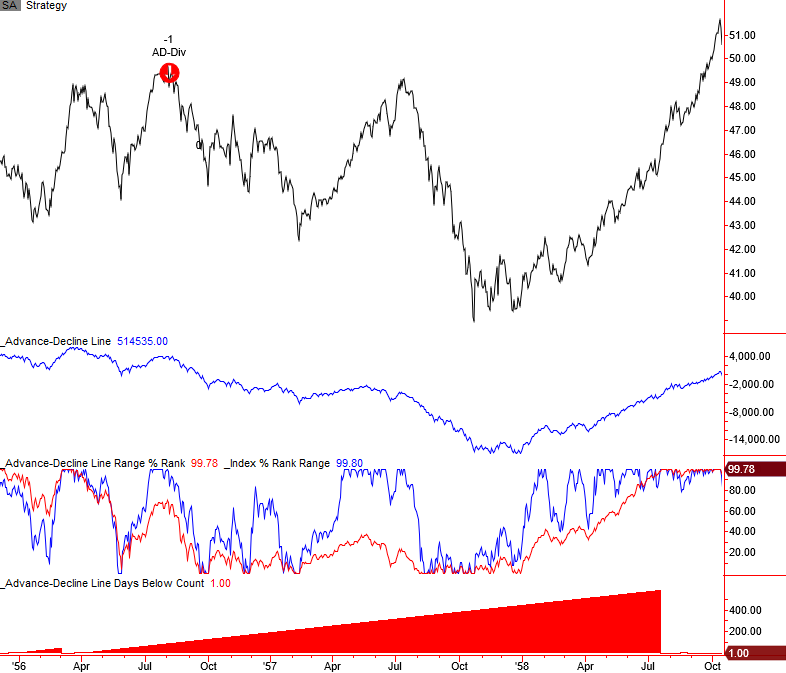
1957-58 Bear Market
1937-38 Bear Market
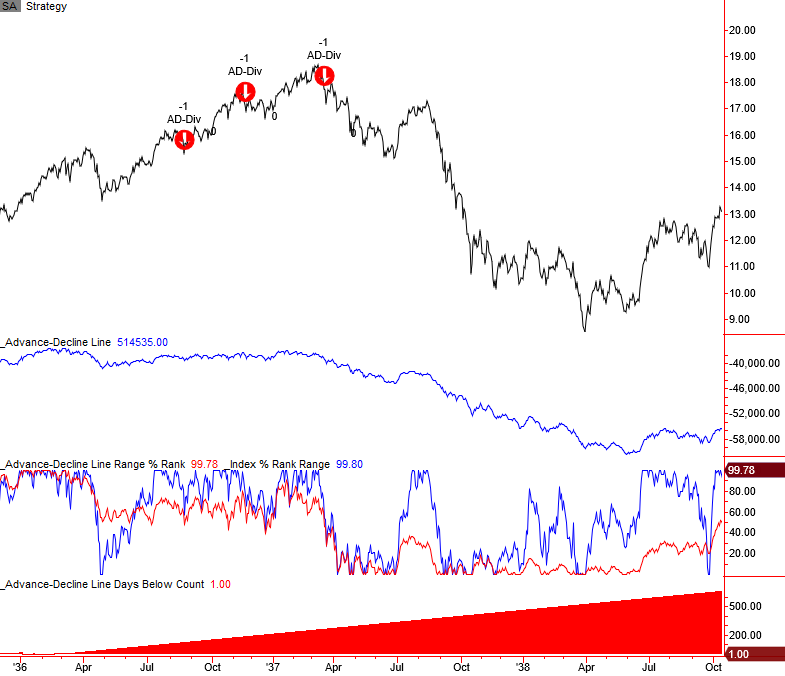
1929-32 Bear Market
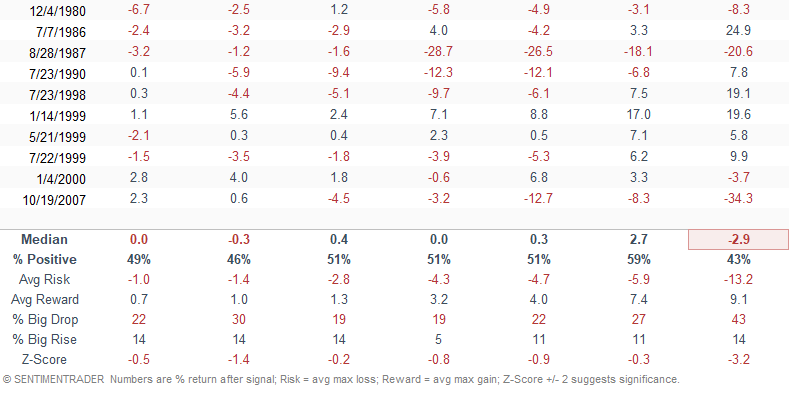
Signal Performance
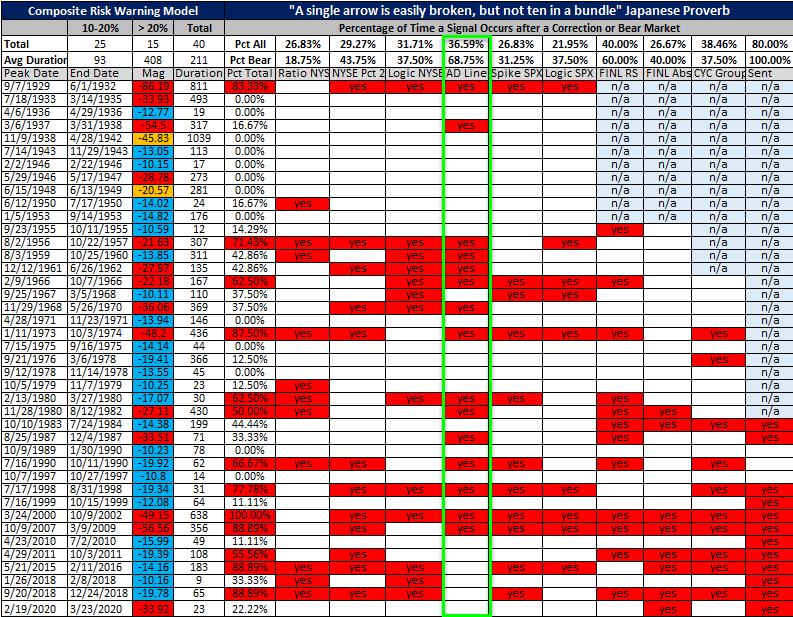
Historical TCTM Risk Warning Model Table
The following table provides a historical signal perspective for components within the TCTM Risk Warning Model. A "yes" in a model column indicates that a signal triggered either before or just after a significant correction or bear market peak. The advance-decline divergence model maintains the best record since 1928 for identifying a bear market with a hit rate of 68.75%.
Conclusion: The NYSE cumulative advance-decline line continues to register new highs as most issues participate with the broad market advance. I want to note that I monitor common-stock-only AD lines for a handful of Indexes like the S&P 500 and 1500. It will be interesting to see if the common-stock versions work in the future, as I have concerns about the potential impact of decimalization and passive vehicles on the AD line indicator.