
Monitoring the Trends in Rates and Inflation

Back in January I wrote a 3-article series titled "Rates, Bond and the Really Big Picture (see here, here and here). In the last week I wrote a 3-article series title "What You Need to Know About Inflation" (see here, here, here also here)
I do not wish to rehash all of that information here. However, it does seem like a good time to focus on a handful of highlights in order to help investors retain some sense of objectivity amongst all the "noise."
First a few "observations/assertions" regarding the long-term and current state of affairs in the bond market:
- Over time interest rates rise and fall
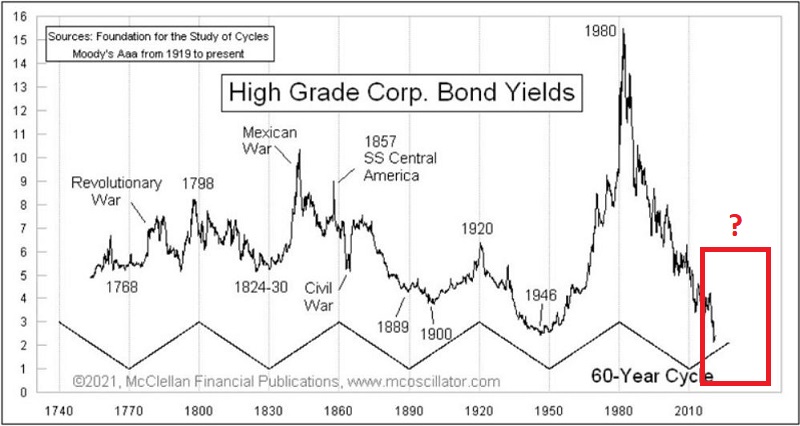
- Trends in interest rates have historically tended to move in a roughly 60-year wave (30 years up, 30 years down)
- Interest rates topped out in the early 1980's and trended lower before appearing to bottom out in March 2020
- Based on an approximate 60-year wave, rates appear to be roughly 10 years "overdue" to resume an uptrend
- Given the massive explosion in government debt and the sharp spike in interest rates since late 2020, a lot (and I mean A LOT!) of angst, worry and gloom and doom speculation regarding inflation and further rate increases has reached an almost deafening level.
The chart below displays the roughly 60-year wave nature of bond yields.
My favorite tool for objectively designating the current trend in interest rates as either "rising" or "falling" is the 120-month (yes, month) exponential moving average. The chart below displays 10-year treasury yields going back to 1899 with the 120-month EMA overlaid.
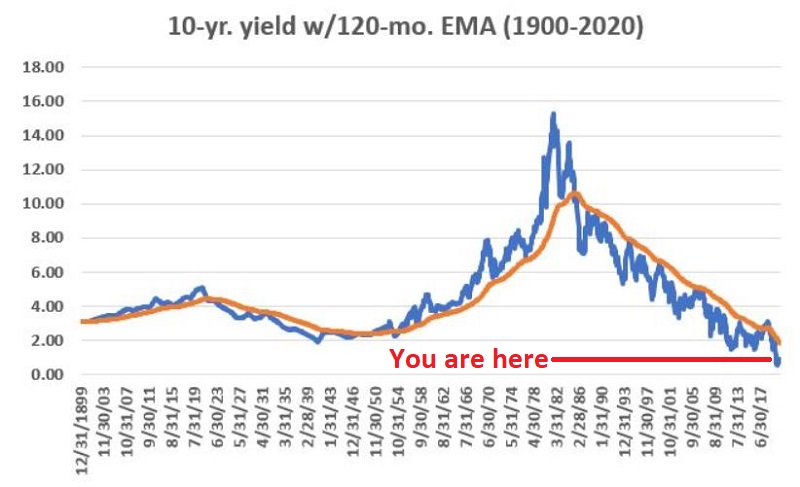
As you can see in the chart above, like any moving average approach there can and will be whipsaws. But overall the 120-month EMA does a pretty good job of keeping one on the right side of the major, long-term interest rate trends - i.e.:
- When the blue line (the actual 10-year yield) is below the orange line we can objectively designate the trend in rates as "falling"
- When the blue line (the actual 10-year yield) is above the orange line we can objectively designate the trend in rates as "rising"
By this measure objective long-term measure, the trend is still "falling." Still the chart below (which zeroes in on just the last 15-months for the 10-yr. yield) is getting a great deal of attention these days - mostly accompanied by some pretty hyperbolic "OMG rates are spiking, soaring inflation is inevitable!!!" type commentary.
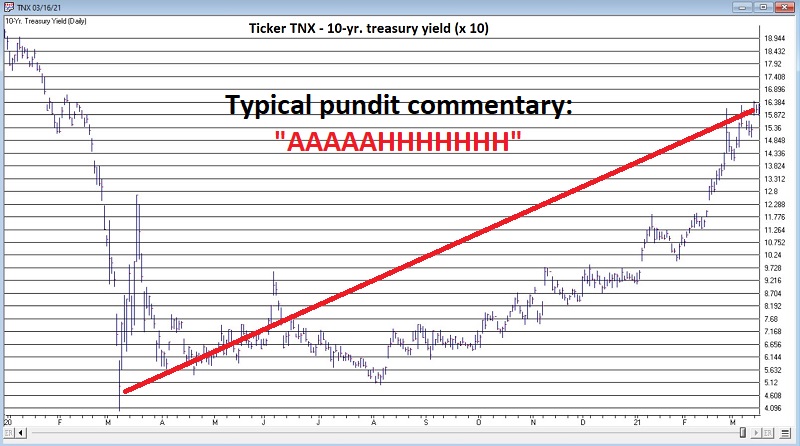
Here is what you need to know:
- Rates may in fact continue to rise from here
- Inflation may in fact heat up in the not-too-distant future
HOWEVER
- As I pointed out in the inflation articles, the time to worry about inflation is when there is some inflation to worry about (think 4% increase in CPI year-over-year)
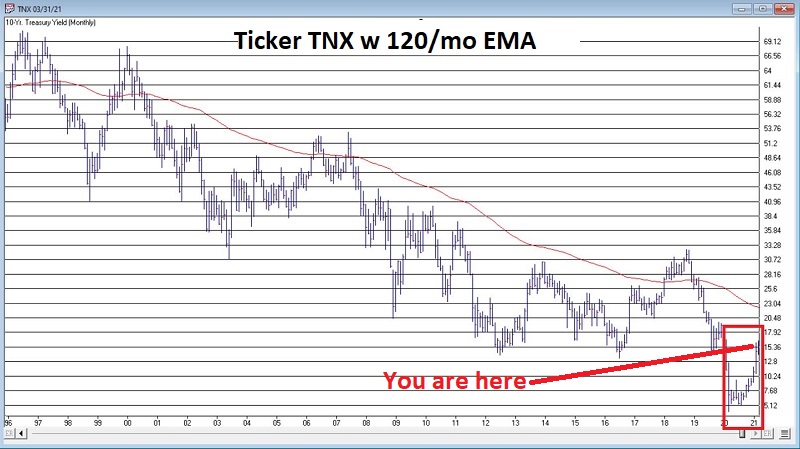
- The time to worry about a rising trend in interest rates is when a rising trend is objectively established
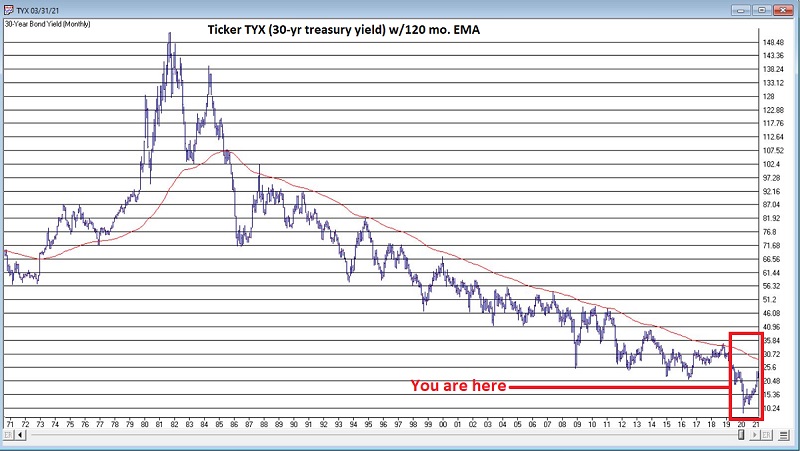
To put the chart above into perspective, the charts below display ticker TNX (10-year treasury yield x 10) and ticker TYX (30-year treasury yield x 10) with their respective 120-month exponential moving averages. The last 15 months from the chart above is contained in the red box.
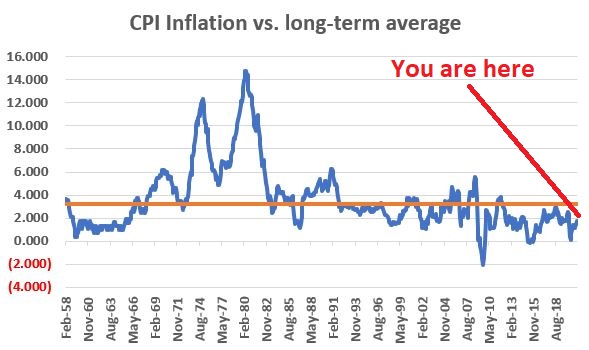
The chart below displays the 12-month change in the Consumer Price Index versus its long-term average of 3.22%.
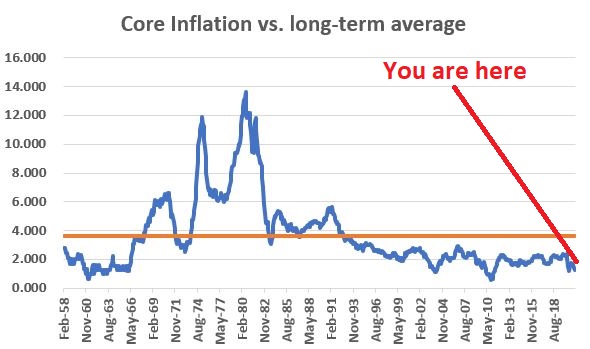
The chart below displays the 12-month change in the Consumer Price Index Less Food and Energy (i.e., core inflation: CPI minus the most volatile components) versus its long-term average of 3.02%.
Every pundit out there longs to be the first to "call the turn." Still - and despite all the hyperbole - at this moment in time the objective measures above remain in established downtrends (rates) or uptrend (inflation).
Could things change in fairly short order? It is not my place to offer "predictions" regarding what the future holds for either rates and/or inflation.
I do however, feel like part of my job is to remind investors to NOT fall into the trap of swallowing "conventional wisdom" and to stick with the facts. I also like to remind people of that oldest of adages, "the trend is your friend" and the most important attendant points:
- Don't fight the current trend as long as it remains in force
- DO NOT fall in love with the current trend (because it won't last forever)
- When the trend actually does change you MUST fight that longing for the old trend to continue - and you MUST act decisively
The time to act decisively in terms of adjusting your portfolio to deal with a rising interest rate environment and/or a rising inflation environment will eventually come. Maybe sooner, maybe later. But until rates are in an established uptrend and/or until the standard measures of inflation actually show some actual inflation, investors may do well to ignore at least some of the fear and loathing presently coming from the loudest voices.