
Rates, Bonds and The Really Big Picture (Part III)

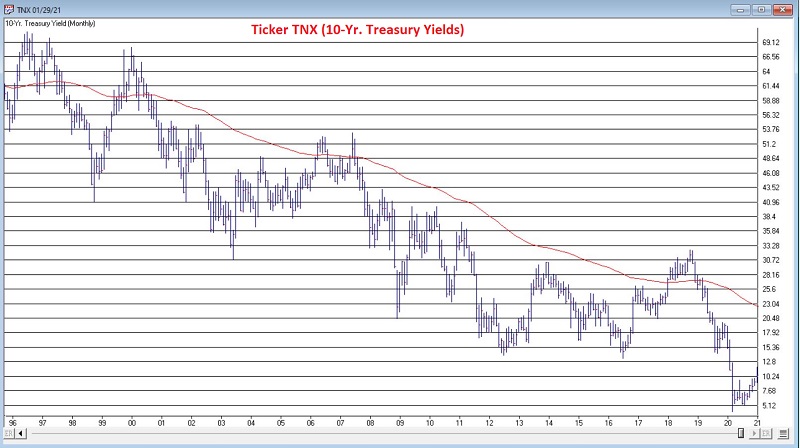
In Part I, I highlighted the (very) long-term nature (roughly 60-year cycles) of interest rate swings. In Part II, I highlighted a very simple approach to designating the current long-term interest rate trend as either "Up" or "Down". The chart below displays ticker TNX with its 120-month exponential moving average.
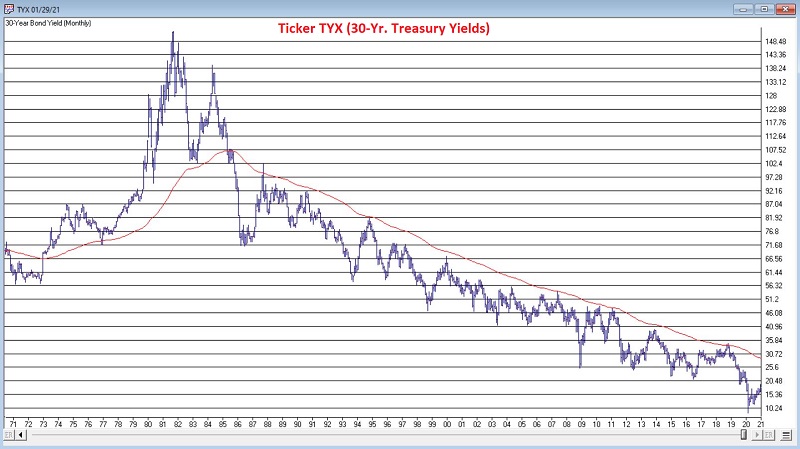
The chart below displays ticker TYX (which tracks the yield on 30-year treasuries x 10) with its 120-month exponential moving average.
Realities of the bond market:
- Rates rise and fall in very long-term waves, so being on the right side is important
- Rates make shorter-term fluctuations within the overall long-term trend
- There are many different types of bonds
- Some types of bonds perform better when rates are rising than other types of bonds
- The goal is to get a handle on which is which
A caveat:
Someday interest rates will once again embark on a rising long-term trend. Our objective in this exercise is to identify income investments that may perform reasonably well even in the face of a rising rate environment. While we have a long history of treasury bond yields, the historical data available for certain other types of bonds is much more limited. For example, high yield corporate bonds only came into existence in a major way in the 1980's. Floating rate bonds and TIPs also have only a few decades of data at best.
So, the results that follow should not be considered "definitive" but rather as "food for thought".
The candidates:
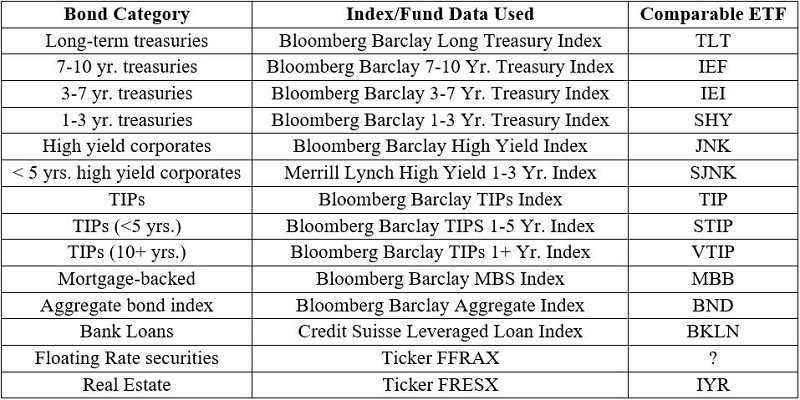
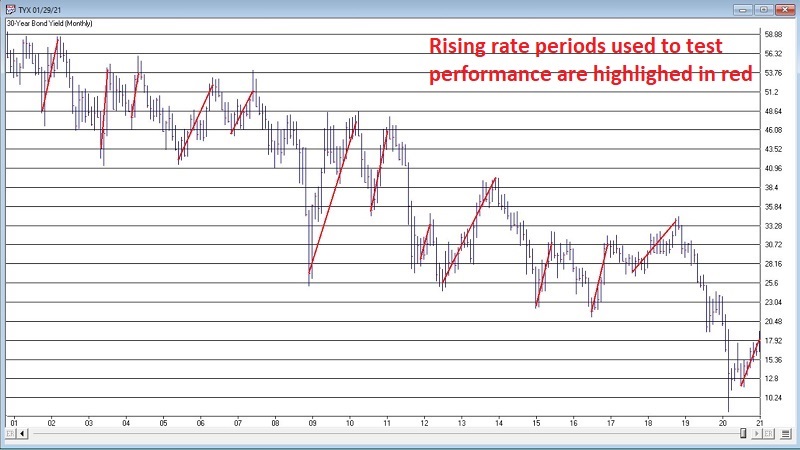
To measure performance in rising interest rate environments I used the benefit of perfect hindsight. "Rising interest rate" periods are marked with red lines in the chart below. All other periods are deemed "falling interest rate" periods. I then accumulated the return for each index/fund listed in the second column of the table above ONLY during each rising rate period marked in red in the chart below to measures results. The data used in the test is monthly total return data for each security/fund.
Testing
September of 2000 is the first month of data available for ticker FFRAX (Fidelity Floating Rate fund) so we will start the test with that month. First things first. We are using ticker TYX (the 30-yr. treasury yield) with the benefit of perfect hindsight as our guide to whether we are in a rising or fall rate environment. Therefore, we should not be surprised to find that long-term treasuries (which because they are assumed to have no credit risk and are a pure play on interest rates) turn out to be the worst performer when rates are rising.
In the table below we see the average monthly return and the cumulative total return for each bond category proxy during all of the rising rate environments in the earlier chart.
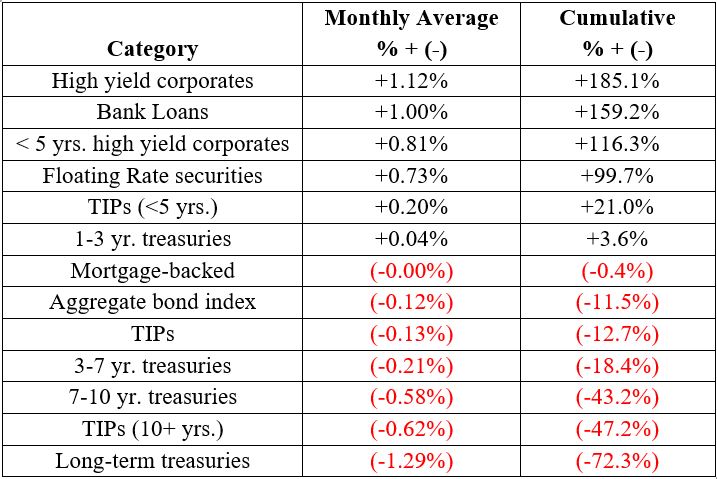
As you can see the top performers during rising rate periods from September 2000 through December 2020 were:
- High yield corporates
- Bank Loans
- < 5 yrs. high yield corporates
- Floating Rate securities
Let's take a closer look at the relative performance of these different bond categories.
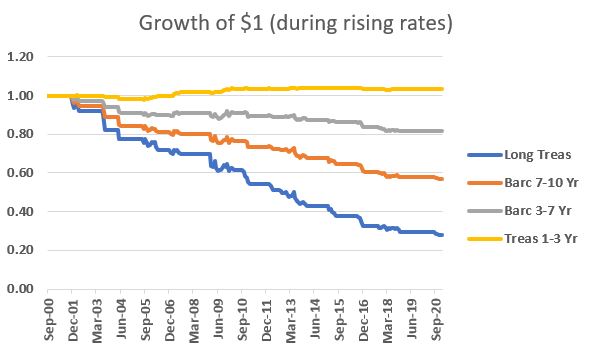
The chart below shows the growth of $1 invested in the various treasury indexes during the rising rate periods highlighted in the earlier chart. No surprise here: long-term bonds do the worst; short-term bonds do the best.
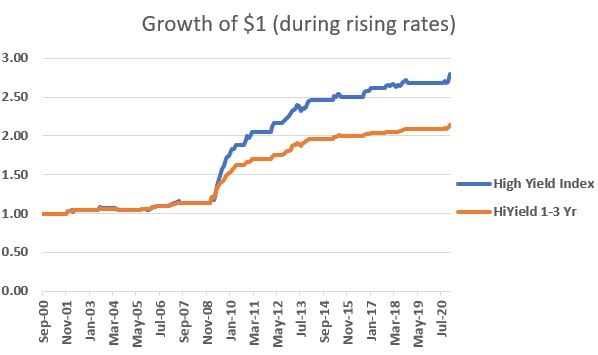
The next chart displays the two high yield corporate sectors.
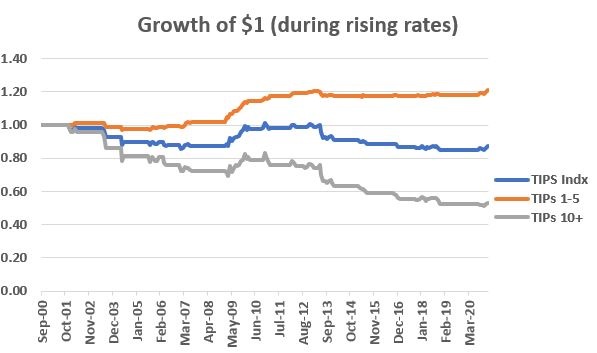
The next chart displays the TIPs related sectors.
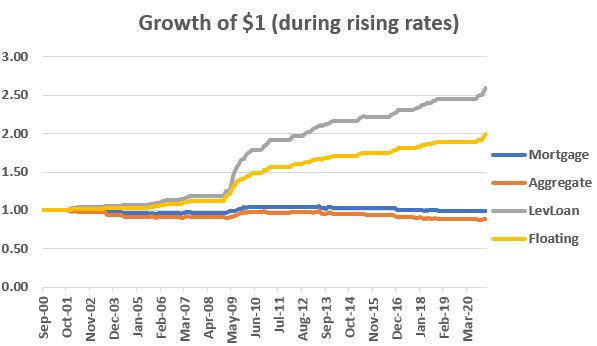
The final chart displays the "other" categories: Mortgage, Aggregate, Leveraged Loans and Floating Rate.
What explains the mostly positive performance of High yield corporates, bank loans and floating rate securities during a rise in interest rates? For one thing they have had an inverse correlation to long-term bonds (ticker TLT is used as a proxy for long-term bonds in the figure below). The figure below displays the correlation between a long-term bond ETF and the ETFs listed as a proxy for each bond category in our original table. An exact correlation would appear as a value of 1000 and a perfectly inverse correlation would appear as -1000. You can see the four ETF representing the top-performing bond sectors during a rising rate environment at the top of the list, all with slightly negative correlations to long-term bonds.
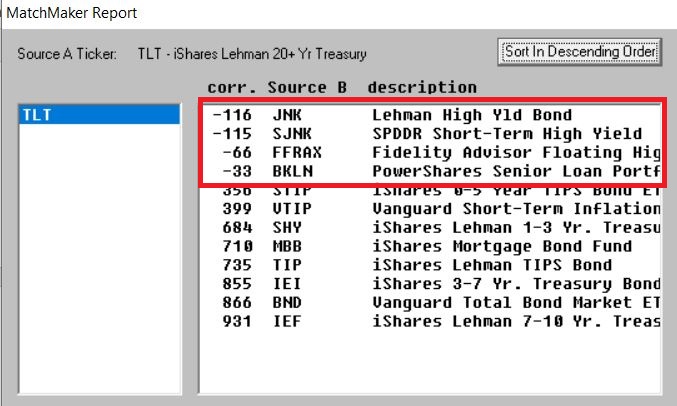
(Courtesy AIQ TradingExpert)
Likewise, the same for ETF bond category proxies have a relatively high correlation to the S&P 500 as seen in the figure below. This is likely due to the fact that these categories are tied as much to the overall fortunes of corporations than to interest rates.
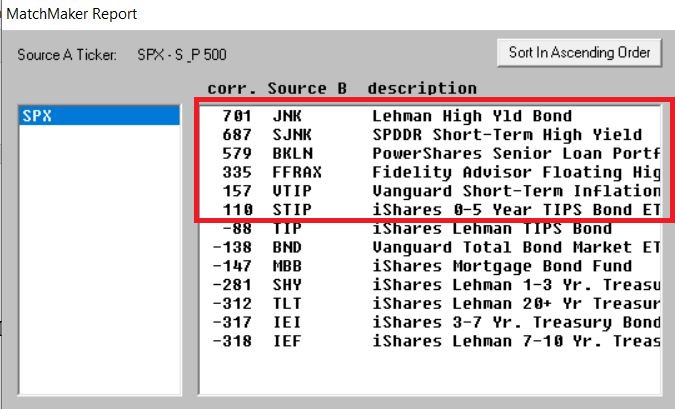
(Courtesy AIQ TradingExpert)
Other Factors to Consider
When the day comes that interest rates once again embark on a long-term uptrend, can one count on high-yield corporates, bank loans and floating rate bonds to hold up well and outperform other bond categories? As I stated at the outset, we cannot state definitively that this will be the case. But it is reasonable to assume so.
Notes:
High-yield corporates: These securities have mostly been solid performers since they first came on the scene in the 1980's. The one potential weak link is that overall performance of this sector is tied closely to overall economic health. In a major economic downturn, it is possible that defaults could rise to a level that would offset the higher yields offered by these securities.
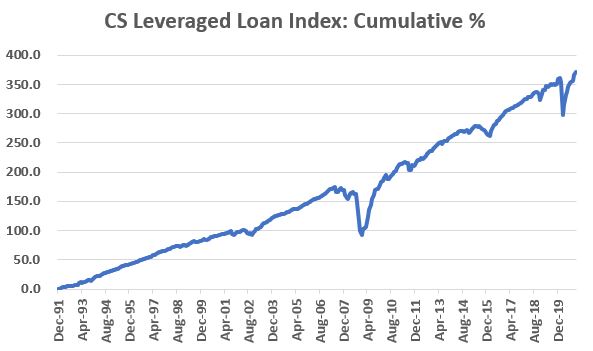
Bank-Loans: This is a very little understood segment of the bond market. The very short-term nature of these securities allows them to be "slow and steady" much of the time and an excellent choice in a rising rate environment. However, they too are tied to the overall economy and can get "whacked" once in a while. The is apparent in the chart that shows the total return for the Credit Suisse Leveraged Loan Index since inception on a buy-and-hold basis. Things go very well right up until the time that they don't.
Floating Rate securities: The analysis done here involved using ticker FFRAX (Fidelity Advisor Floating Rate High Income), an actively managed fund holding corporate floating rate bonds. The good news is that (as the name implies) these securities can pay a higher rate of interest as rates rise (a pretty handy feature in a rising rate environment). However, like some of the other categories, floating rate funds that hold corporate securities are tied to some extent to overall economic health.
It should also be noted that there are many other choices besides FFRAX. ETF ticker FLOT tracks the Bloomberg Barclays U.S. Dollar Floating Rate Note Index<5 years. Because of its limited duration it tends to be less volatile, however it also tends to generate much less return. ETF ticker TFLO tracks the Bloomberg Barclays U.S. Treasury Floating Rate Index. The good news is that this fund holds treasuries - which eliminates credit risk and much of the volatility of corporate based floating rate funds, but yields and returns have been miniscule with rates as low as they are today.
TIPs: One final factor to keep in mind - if a rise in interest rates is accompanied by a meaningful rise in inflation, TIPs may be a valuable addition to a bond portfolio as their interest payments can be adjusted upward as inflation increases. From 2000 to 2020 inflation was rather tame, so among the TIPs categories included in the test above only TIPs<5 years showed a gain. If the 12-month rate-of-change in the Consumer Price Index moves above and holds above 5%, TIPs bonds would be expected to perform significantly better than in the test above.
Summary
Some day interest rates will once again embark on a long-term rising trend. When that day comes the reality is that most of what the majority of investors think they know about the bond market (deeply ingrained in the brain from 40 years of declining rates) will go out the window. The time to prepare and plan is now. The good news is that there do appear to be opportunities for income investors and bond market speculators to perform well, even in the face of a long-term rising trend in interest rates.