Headlines
|
|
Weekly Wrap for Mar 26 - Passing the 1-year anniversary with more excesses:
This week, we passed the 1-year anniversary of the bear market bottom, with impressive gains across sectors and factors. Year 2 tends to bring less impressive results. There are more signs of speculation, even as some indexes crack their recent trends. Bonds and gold have continued to get hit.
The latest Commitments of Traders report was released, covering positions through Tuesday: The 3-Year Min/Max Screen shows that "smart money" commercial hedgers established only one new extreme this week, short exposure in Ultra 10-Year Treasuries, which are more closely aligned with an actual 10-year maturity. They also sold the traditional 10-year T-note but their exposure there is about neutral. Hedgers have begun to reverse their net long position in the U.S. dollar, and because of how these traders operate, this tends to be dollar-positive. Reversing from the recent extreme is about the most bullish it could be, so if the buck is going to see a sustained rally, it should be from a setup like this.
Bottom Line:
See the Outlook & Allocations page for more details on these summaries STOCKS: Weak sell
The extreme speculation registered in January and February is starting to get wrung out. Internal dynamics have mostly held up, so a return to neutral sentiment conditions would improve the forward risk/reward profile substantially. We're still a ways off from that. BONDS: Weak buy
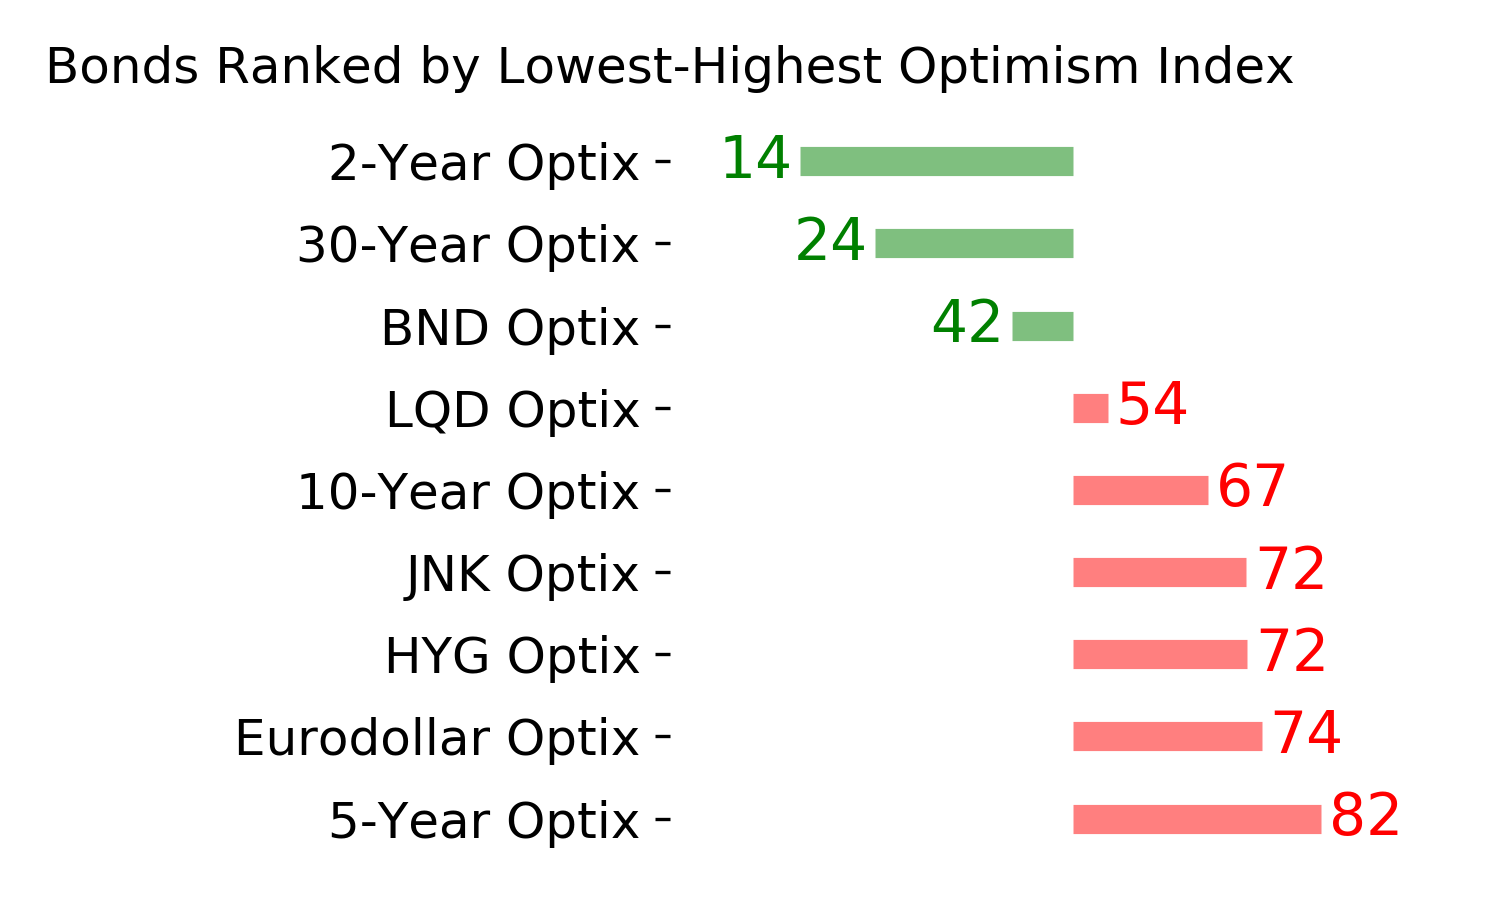
Various parts of the market have been hit in recent weeks, with mild oversold conditions. The Bond Optimism Index is now about as low as it gets during healthy bond market environments. Fixed income isn't responding well, so that needs to be monitored in case it's transitioning to a longer-term negative market environment. GOLD: Weak buy
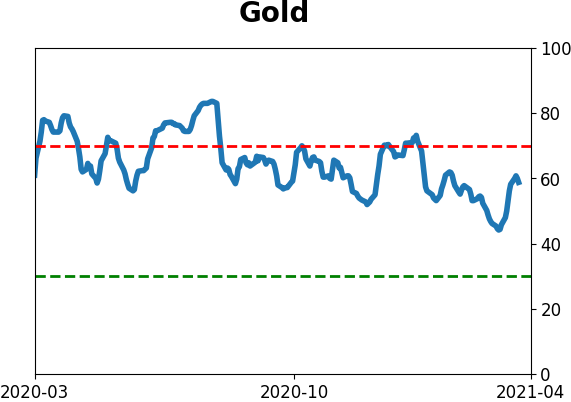
A dollar trying to rebound from a severe short position has weighed on gold and miners. The types of signals they've given in recent weeks, within the context of their recent surge, have usually resulted in higher prices over a medium- to long-term time frame. Like bonds, gold and miners aren't responding very well, and this needs to be monitored.
|
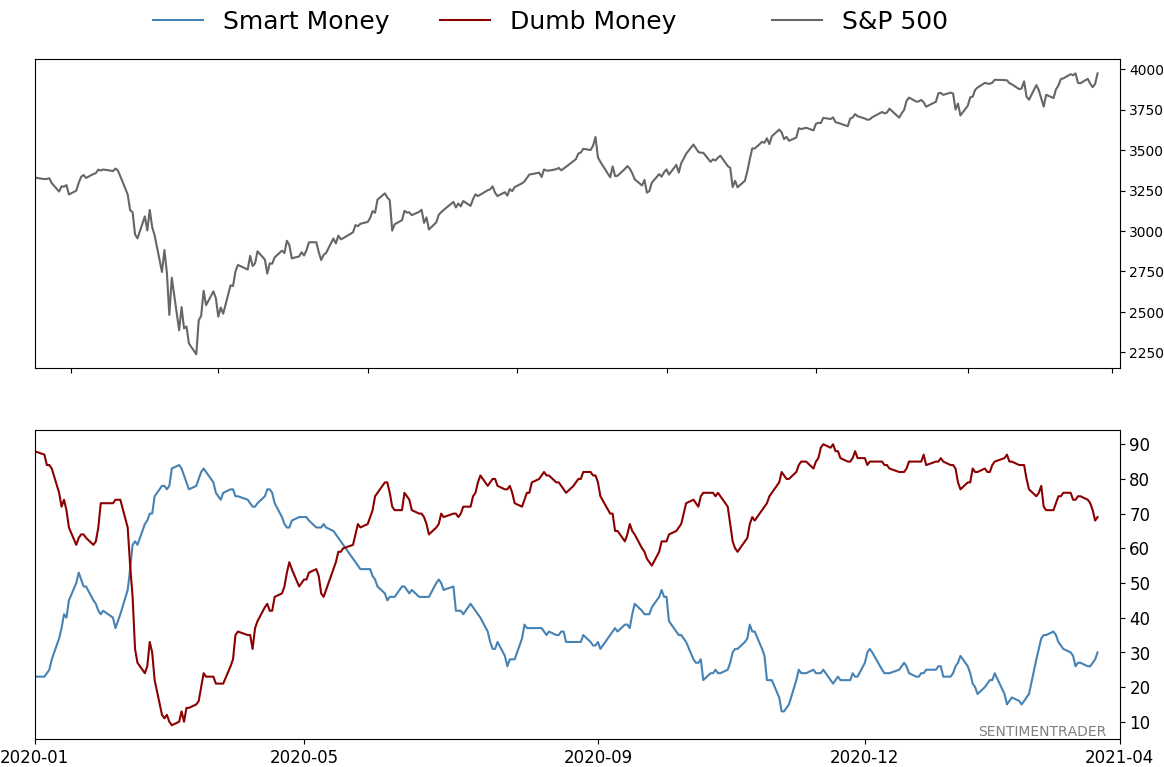
Smart / Dumb Money Confidence
|
Smart Money Confidence: 30%
Dumb Money Confidence: 69%
|
|
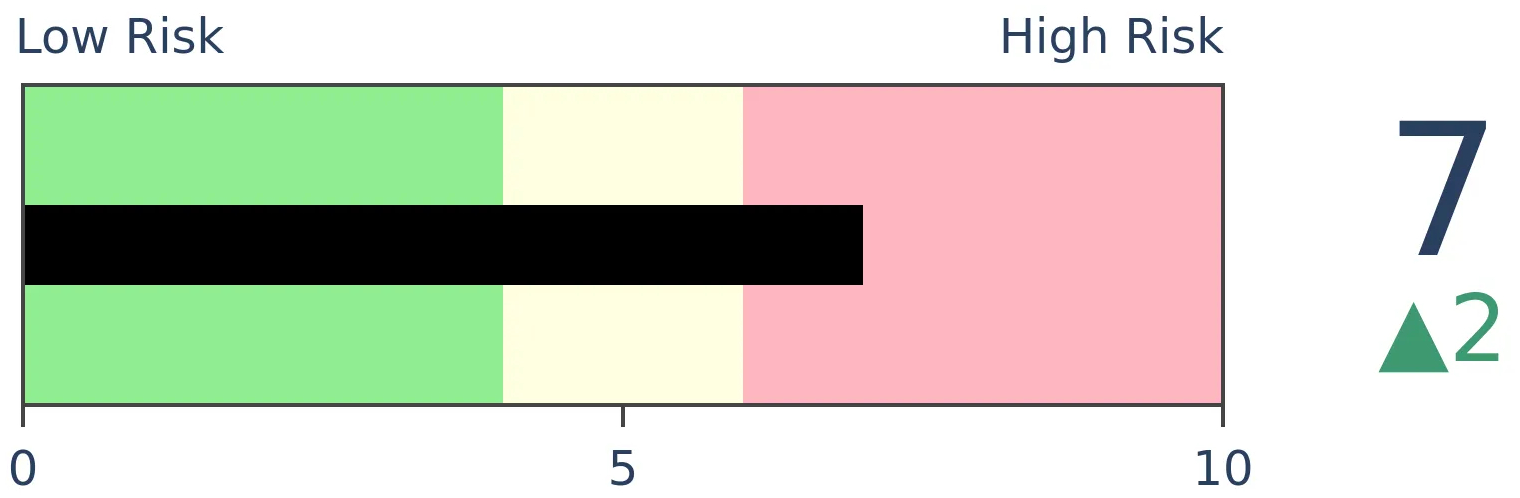
Risk Levels
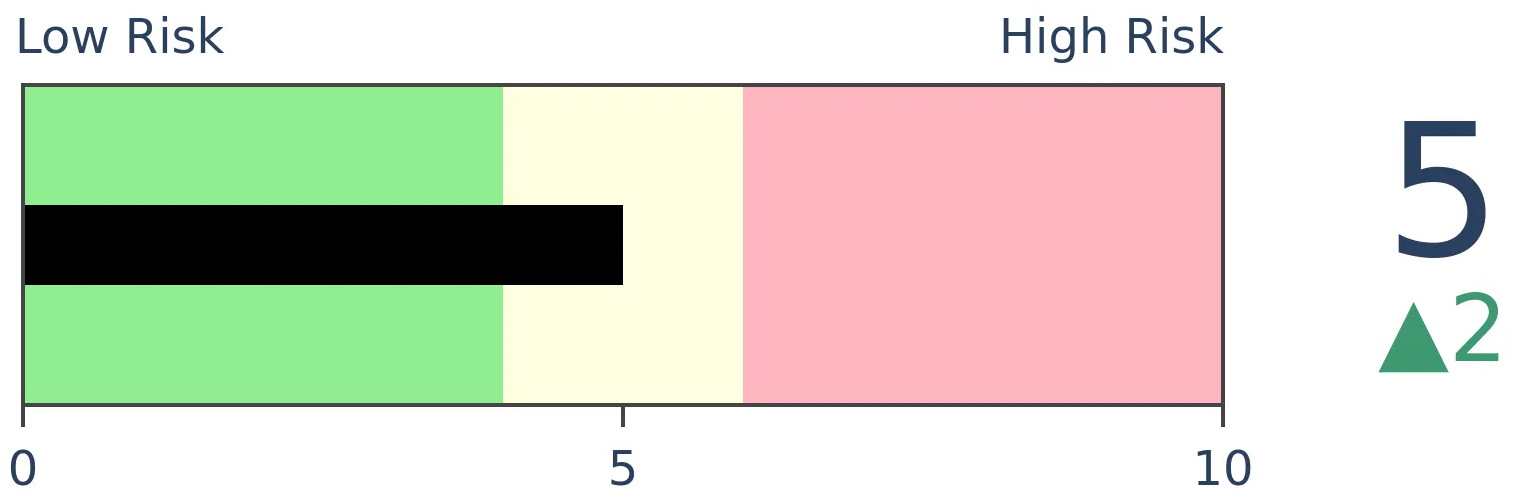
Stocks Short-Term
|
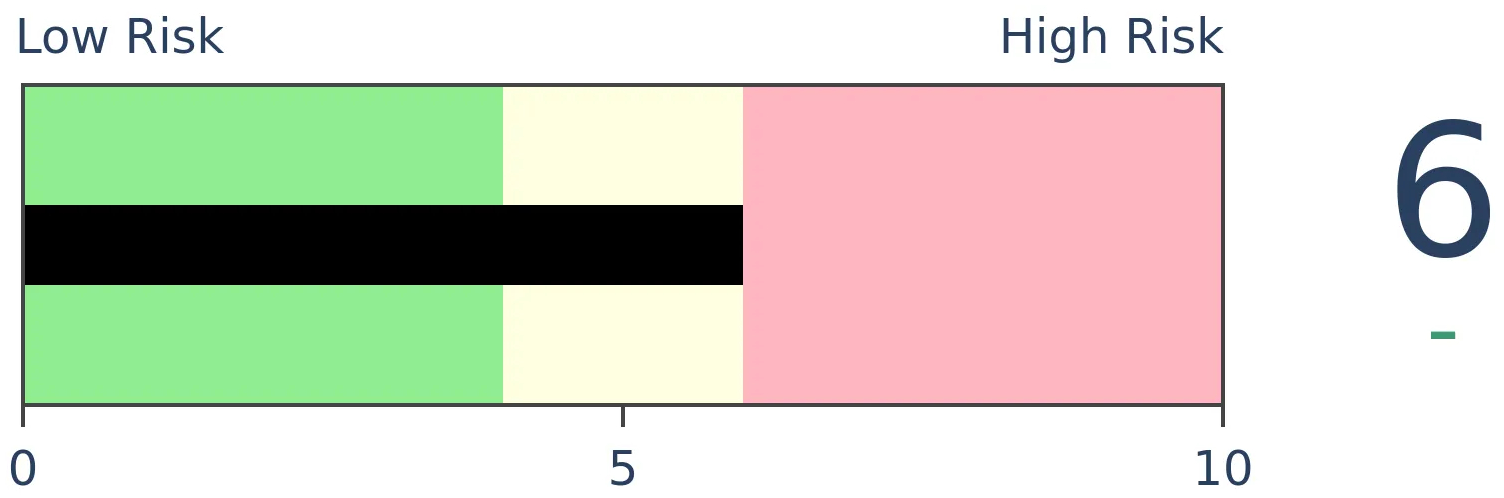
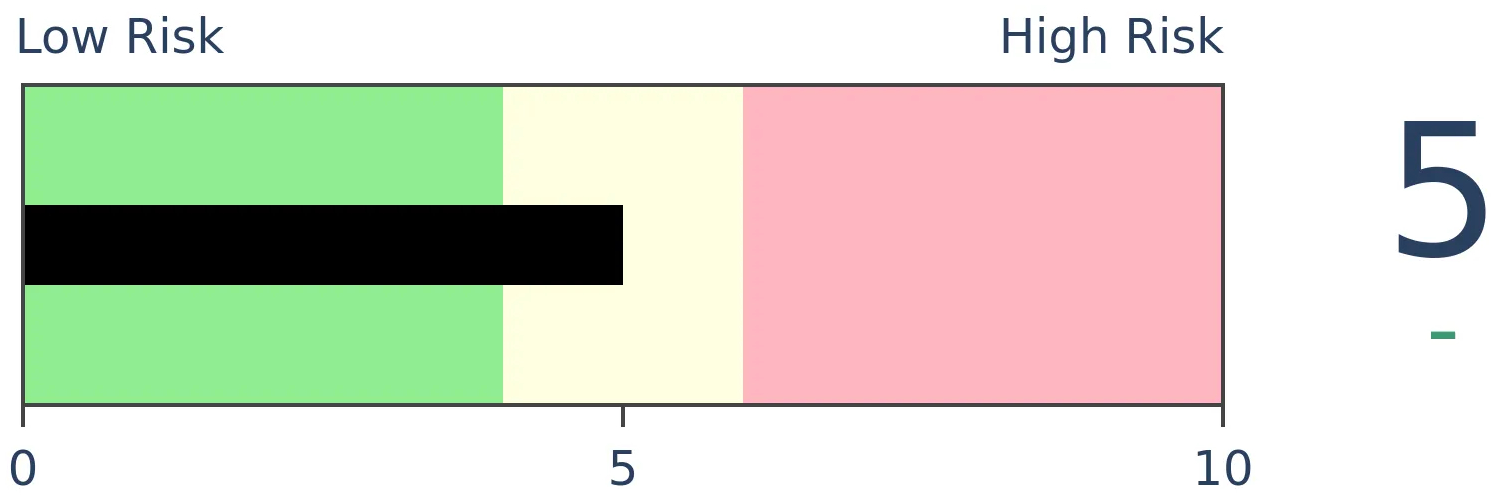
Stocks Medium-Term
|
|
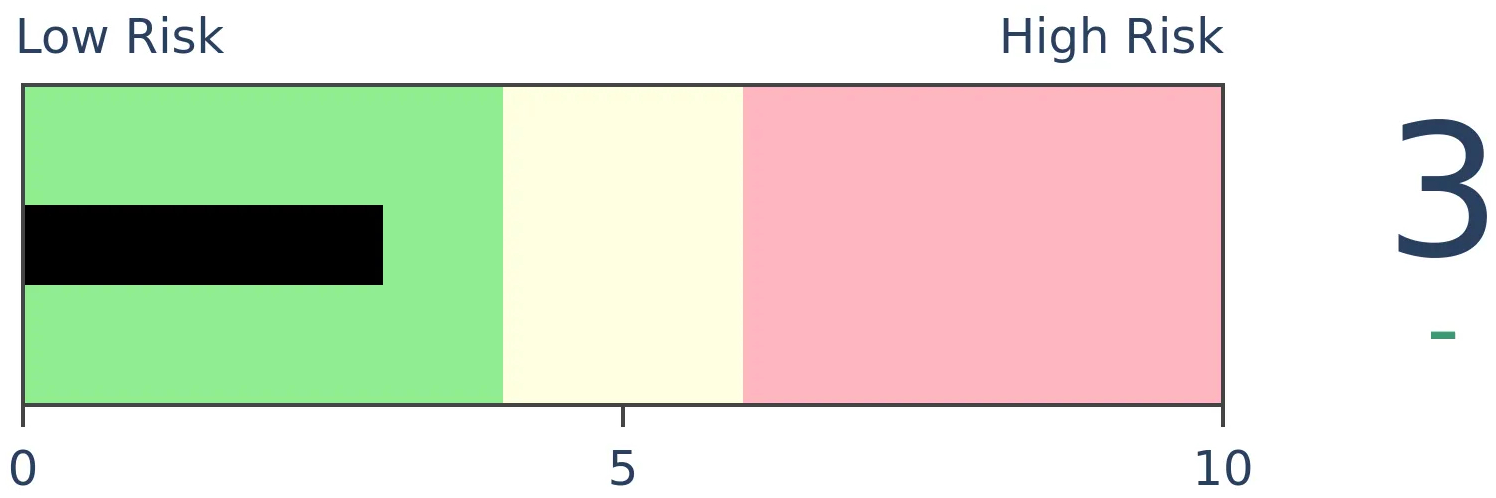
Bonds
|
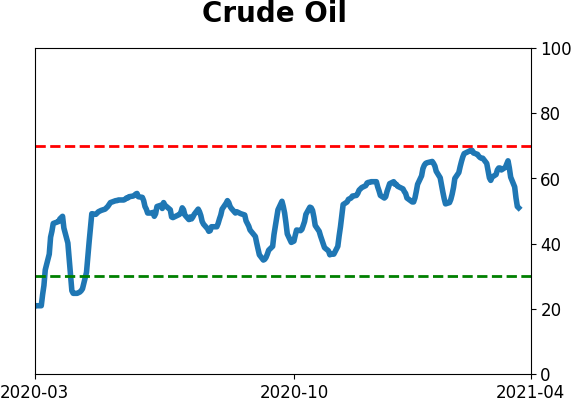
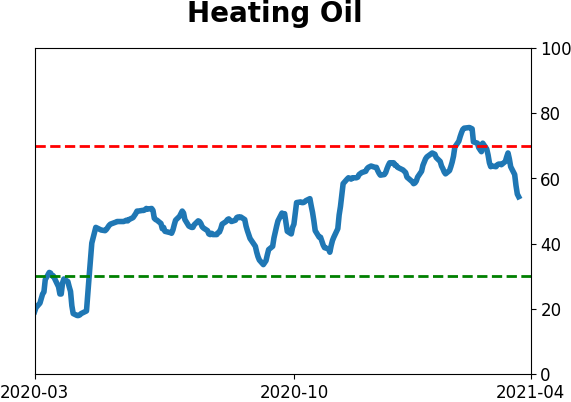
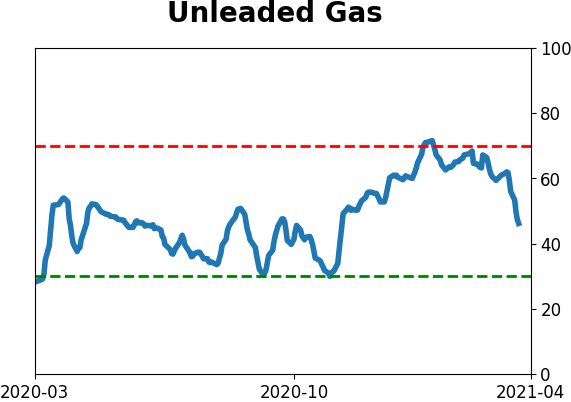
Crude Oil
|
|
Gold
|
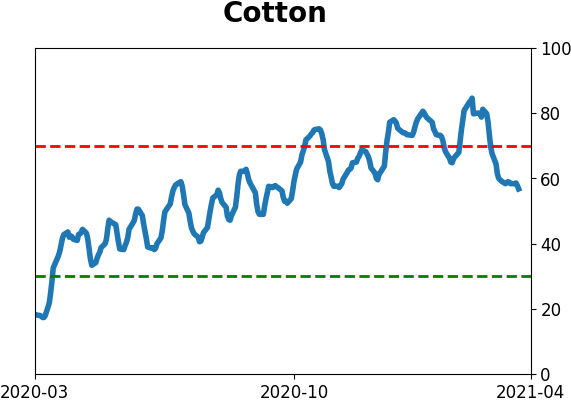
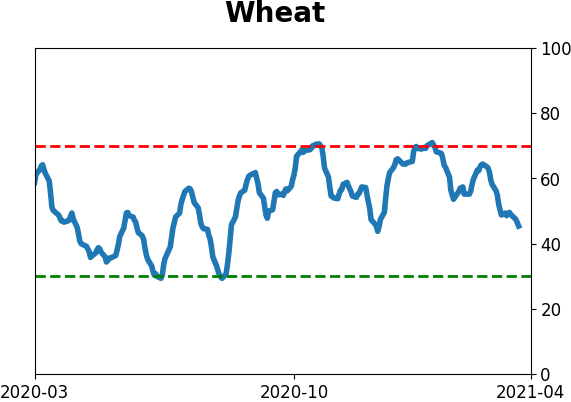
Agriculture

|
|
Research
BOTTOM LINE
This week, we passed the 1-year anniversary of the bear market bottom, with impressive gains across sectors and factors. Year 2 tends to bring less impressive results. There are more signs of speculation, even as some indexes crack their recent trends. Bonds and gold have continued to get hit.
FORECAST / TIMEFRAME
None
|
The goal of the Weekly Wrap is to summarize our recent research. Some of it includes premium content (underlined links), but we're highlighting the key focus of the research for all. Sometimes there is a lot to digest, with this summary meant to highlight the highest conviction ideas we discussed. Tags will show any symbols and time frames related to the research.
| STOCKS |
 |  |
|
One-year anniversary
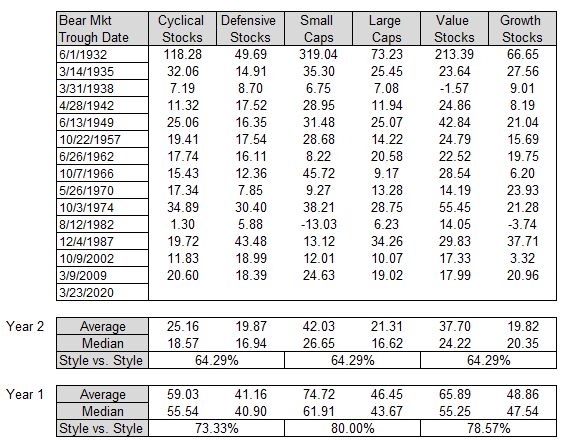
It's now been a year since stocks bottomed during the height of the pandemic panic. Dean looked at the 1-year performance return among major sectors and factors.
Cyclical vs. Defensive - Cyclical stocks have outperformed defensive issues 73% of the time one year post a bear market bottom, and this time was no different. The group also registered the second-best absolute performance in history.
Small-Cap vs. Large Cap - Small stocks have outperformed large-cap issues 80% of the time one year post a bear market bottom, and this time was no different. The group also registered the second-best absolute performance in history.
Value vs. Growth - Value stocks have outperformed growth issues 79% of the time one year post a bear market bottom. However, this time they underperformed growth. Growth stocks registered their best performance in history.
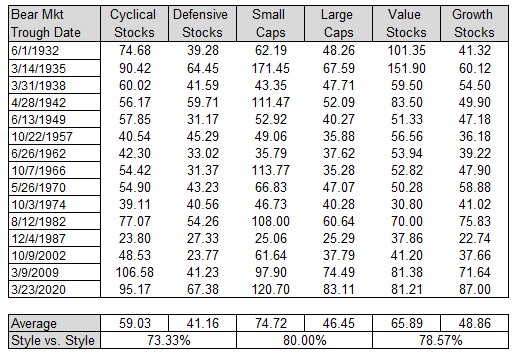
Dean then reviewed year two after bear market lows to see if we can gain some perspective on what the future might have in store for us over the next 12 months. While still good, average and median gains were cut in half as the momentum thrust off the low cools down. That's to be expected. The percentage of time one style bucket outperforms the other drops in all three cases.
And what a year it was
The rally off the 2020 low is remarkable simply because of how far the average stock has traveled. Across all the major equity indexes, and throwing in over-the-counter stocks just because they have seen such a tremendous surge of interest, the median stock is up more than 100% from its lows.
That's more than the initial recoveries off the bear market bottoms in 2003 and 2009.
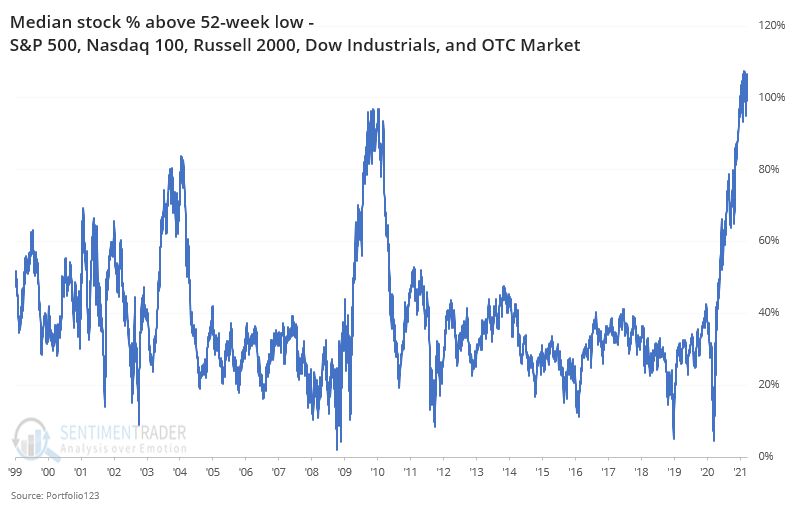
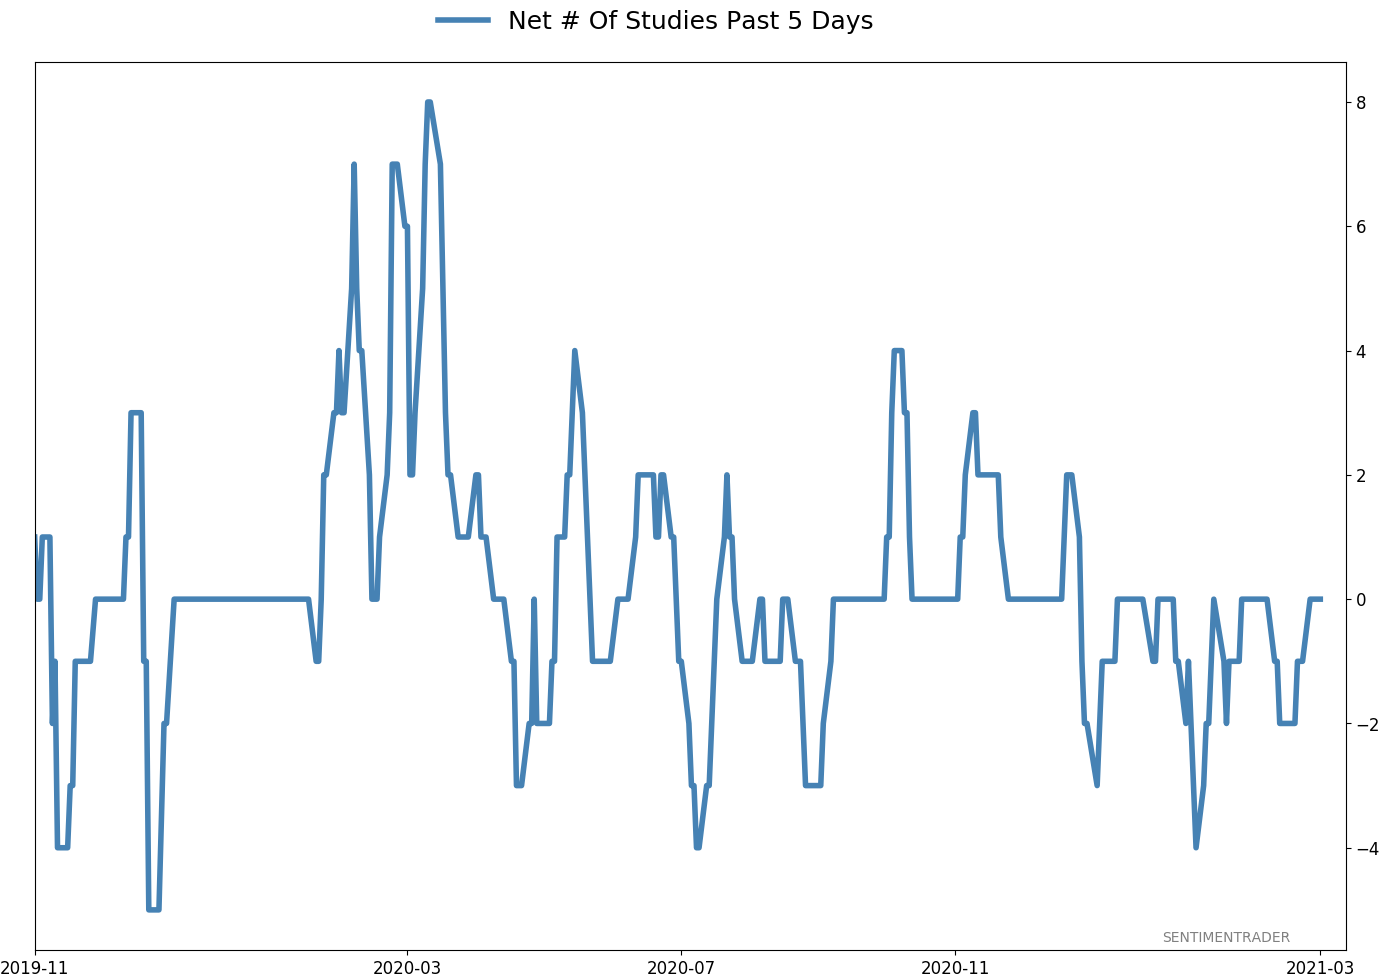
Because stocks have rallied so hard, it's going to be hard to see an increase in the number of stocks falling to 52-week lows. If we did see that, then it could create a divergence with indexes like the S&P 500, a reliable warning sign.
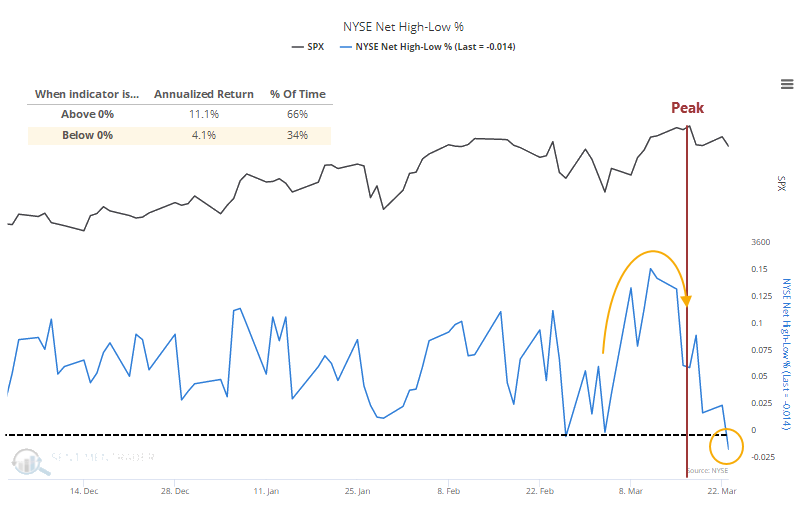
Even though we likely won't see a divergence, by Tuesday there were more 52-week lows than 52-week highs. We can see the stark difference in forward returns in the chart below when this metric is below zero. It's also a worry that this has flipped so soon after a new high in the S&P, triggering the Titanic Syndrome noted in Tuesday's Daily Report.
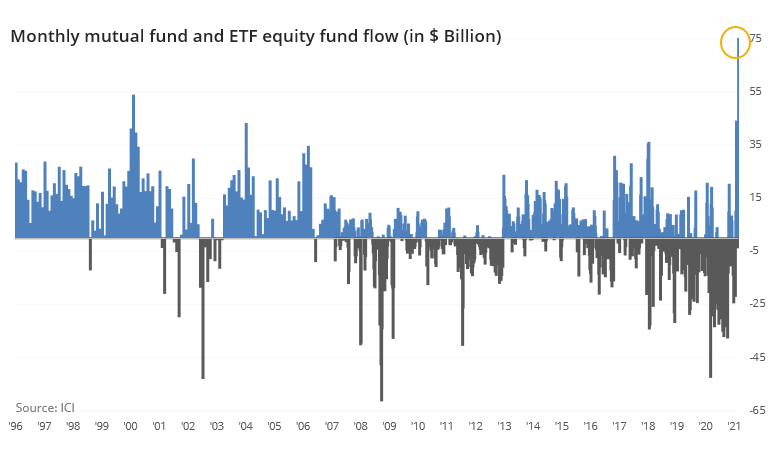
Still a lot of speculation
Last week, investors shoveled nearly $54 billion into equity mutual funds and ETFs. Not only is that more than any other week, it's more than any other entire month since 1996.
For the month so far, investors have moved more than $75 billion into equities, by far a record high.
One of the most visible and discussed aspects of the current welcoming environment for investors is the plethora of new offerings. According to Bloomberg data, there has now been $114 billion in U.S. initial public offerings that were priced over the past 12 weeks.
At 0.26% of the entire market capitalization of U.S. stocks, this is the most in more than 25 years, but below the peak in the early 1990s.
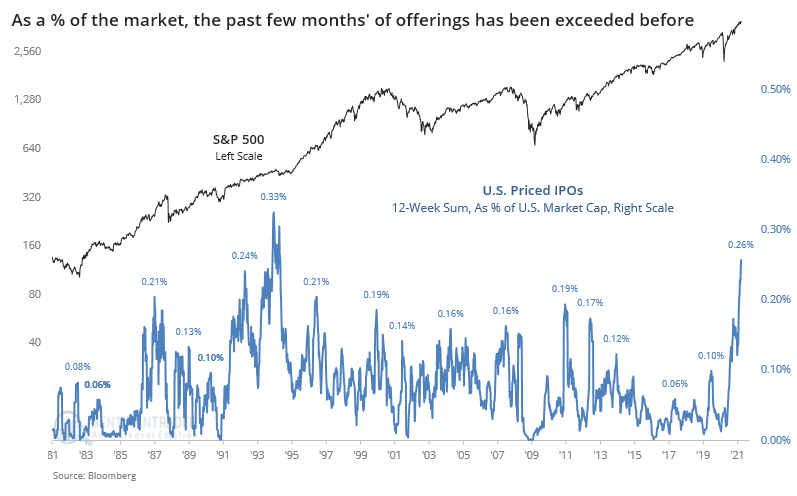
There are more salient worries about these offerings, like the average age of a company going public (again, thanks to SPACs) the pop that they've enjoyed when hitting the market, and how many of them are losing money. The sheer number and size of new issues is certainly extreme, but it took quite a while before that mattered to the market in the mid-80s and early 90s.
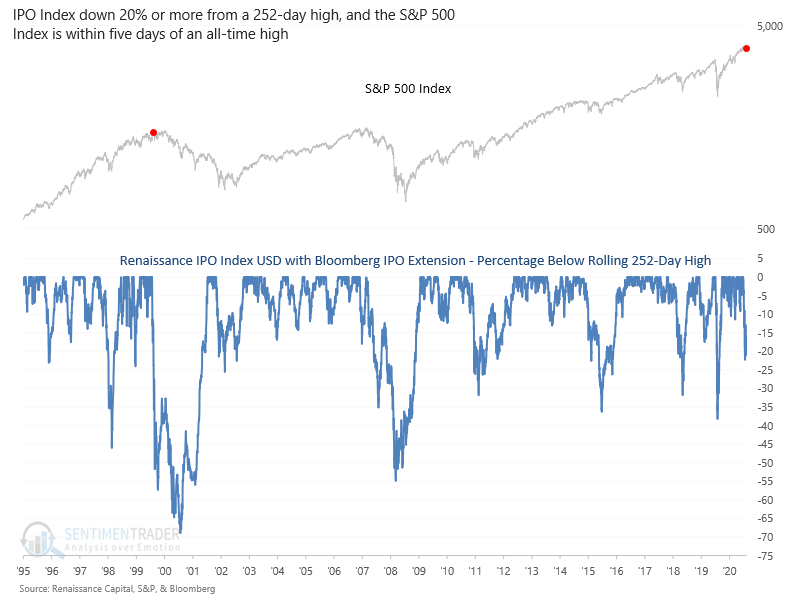
Dean showed that with IPO, SPAC, Solar, and other speculative stocks down more than 20% from their peaks, it compares to the technology bubble in the mid to late 1990s in the sense that IPOs were getting hit hard while the S&P 500 had just been sitting at a new high.
Some quick and heavy selling pressure
Small-cap stocks have struggled a bit. Their pummeling on Tuesday pushed the Russell 2000 below its 50-day average for the first time in almost 4 months.
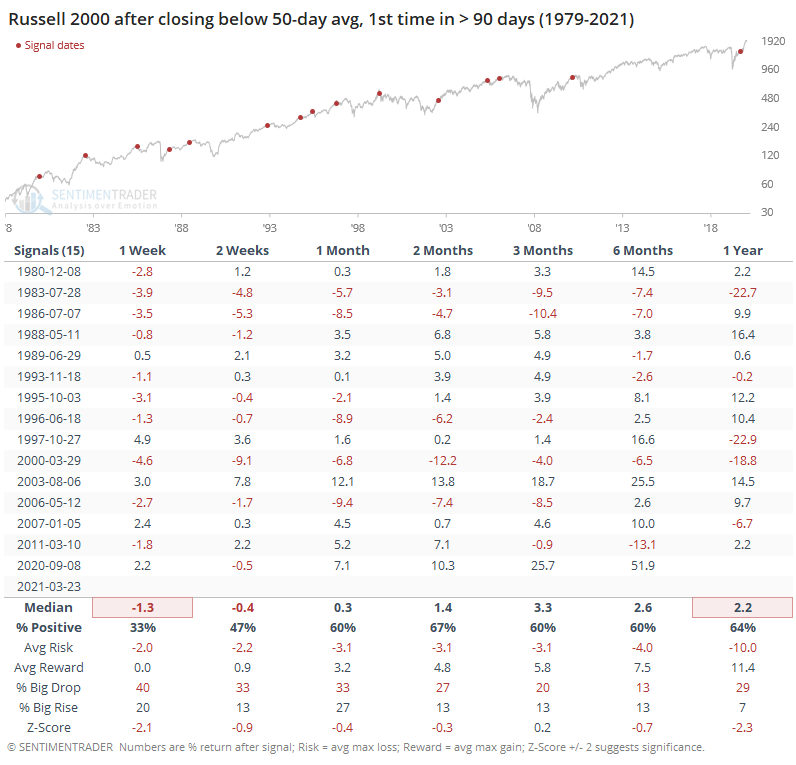
When these trends have ended soon after the Russell was at a 3-year high, it preceded tough conditions for small-cap stocks over the next year+ each time.
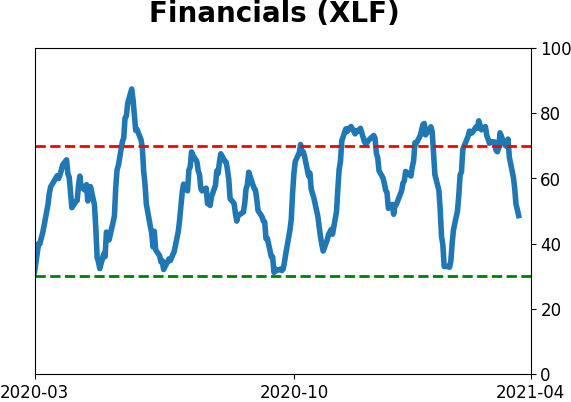
Among sectors, Dean showed that financial stocks are oversold in an uptrend.
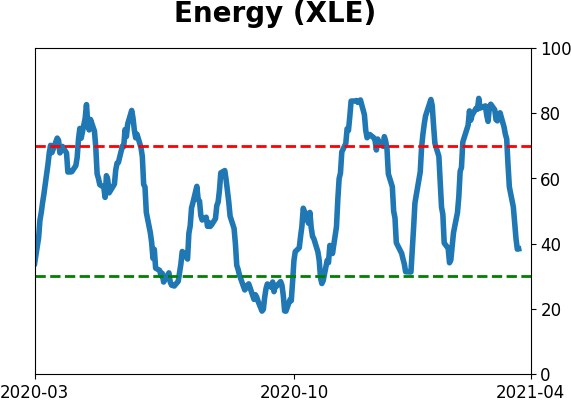
A similar condition to what energy stocks saw last week has now developed for the second time in less than 2 months for financials. As of Tuesday, 100% of financial stocks traded above their 200-day moving averages, and fewer than 8% traded above their 10-day averages.
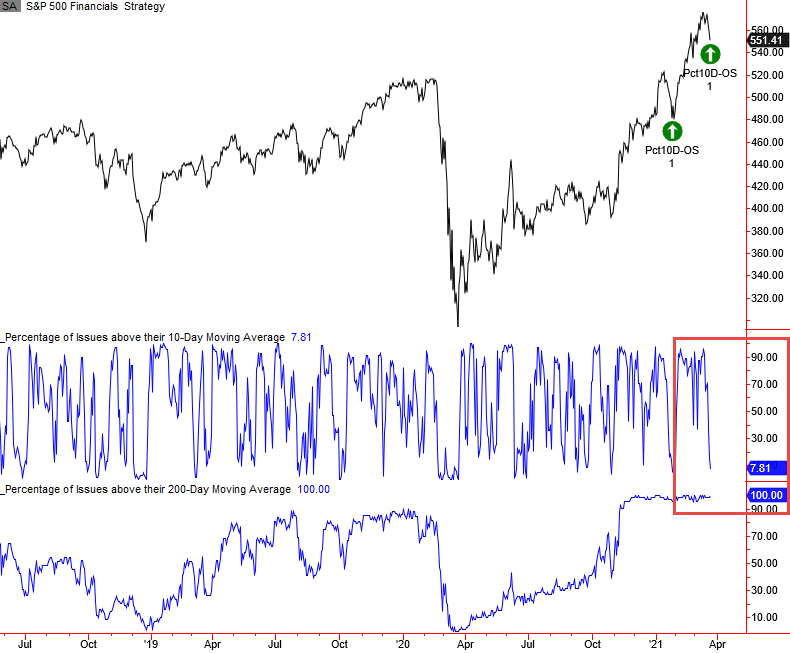
Except for 1961 and 1989, signal performance looks good, with a median one-year return of over 18%. The risk/reward profile was solid on almost all timeframes, with average risk of -2% versus average reward of an impressive +34% during the next year.
Structuring a trade
Jay continued his series about finding various ways to structure an outlook using options. Using activity in Blackberry (BB) as an example, he showed that implied volatility is still very high in options going out several months.
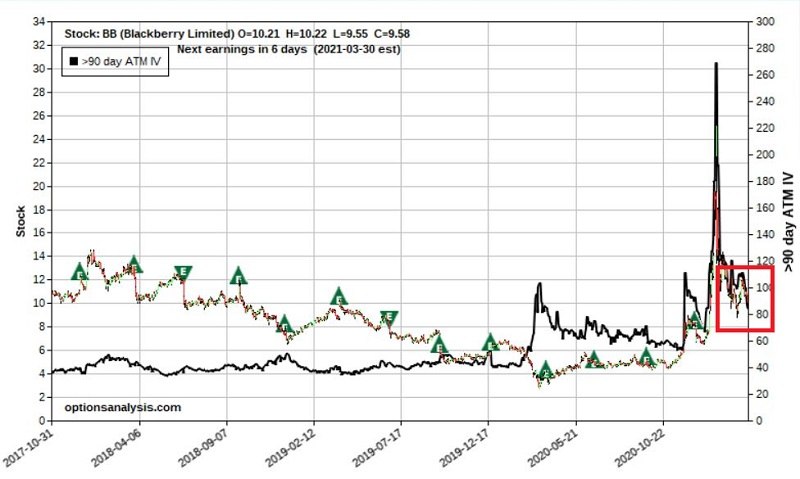
If a trader had good reason to believe BB might rally over the next few months, but didn't want to be so exposed to the risk of collapsing implied volatility, she could combine a long call option with a bull put spread.
Jay pointed out that it's important to see if bonds bounce here.
He looked at the number of weeks over the past 30 weeks that bonds rose, using the VUSTX fund. It has increased in price during only 10 out of the past 30 weeks, enough to be considered oversold.
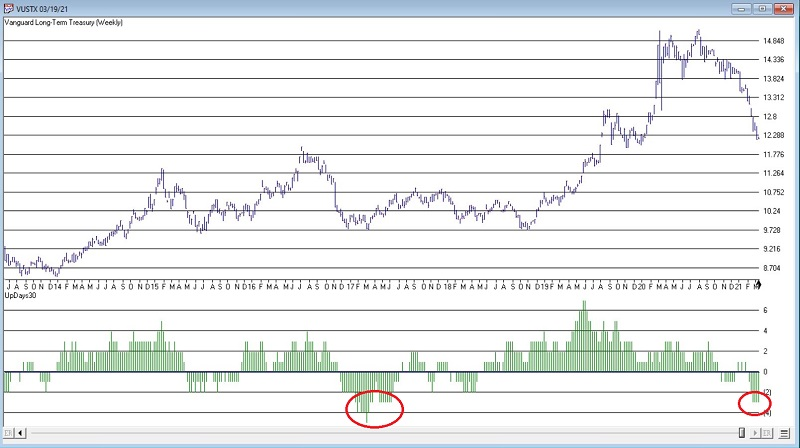
Since 1987 there have been 1817 weeks and 298 of those (16%) weeks ended with this indicator as oversold as it is now. Over the next 26 weeks, the fund was higher 85% of the time. The biggest trouble tended to come when bonds were oversold like this but didn't bounce.
Jay also noted that if bonds are going to bounce, they're more likely to do it after the first couple of weeks of a month. While most investors are aware that bonds have been in a bull market for a long time, most are not aware of the fairly consistent monthly dichotomy in performance depending on where we are on the calendar.
The chart below displays the cumulative hypothetical price return from buying ticker TLT at the close of trading day of the month #9 and selling at the close on the last trading day of the month.
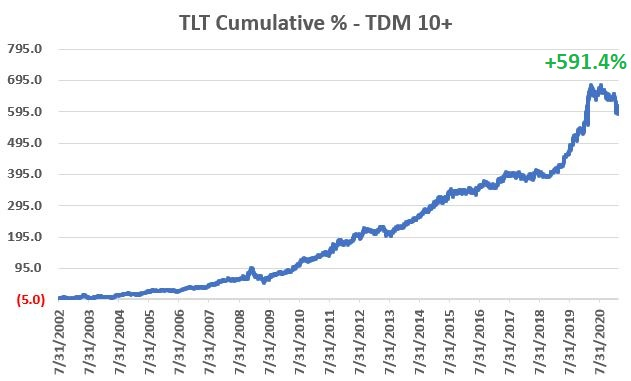
The fund has shown a tendency to decline during the first two weeks of a new month, so it still has a few sessions with a seasonal tailwind.
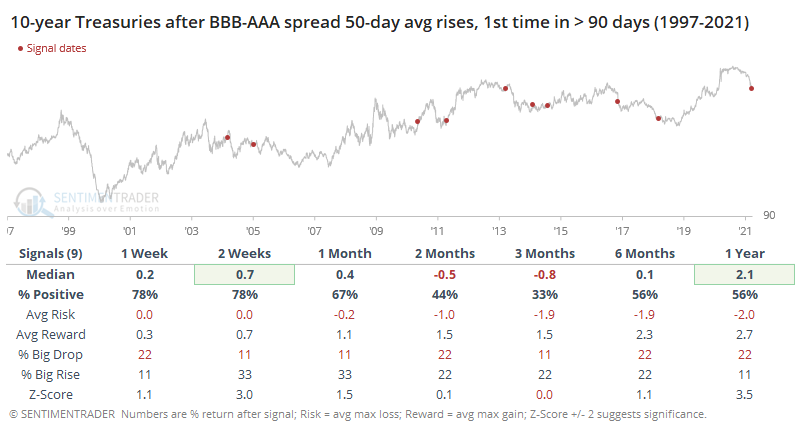
In the corporate bond market, for the first time in almost a year, spreads on riskier bonds are starting to rise compared to spreads on the safest ones. It had been more than 200 days since the 50-day average of the spread was rising, ending the 3rd-longest streak in 25 years.
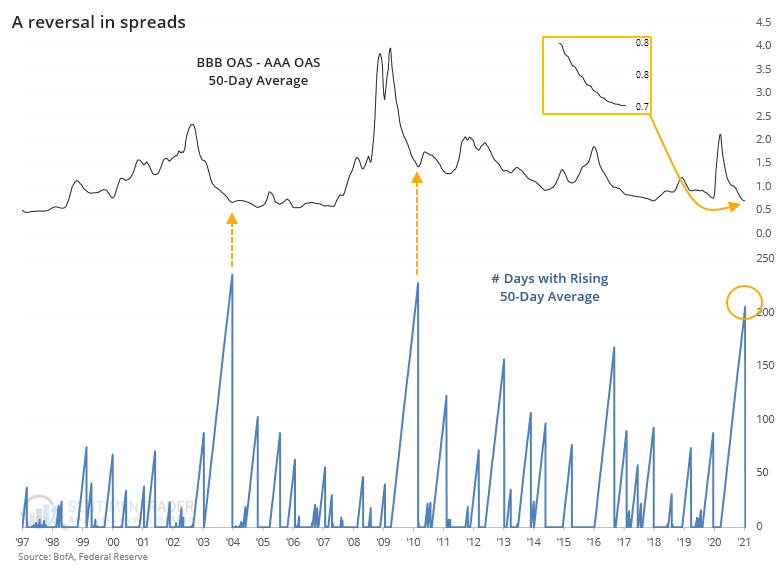
When the 50-day average of this difference in spreads first started to rise after more than 90 days of declining, it wasn't necessarily a sell signal for stocks. Returns over the medium-term were mediocre, about in line with random. Thanks to the overall rising trend over the study period, longer-term returns were good.
There also wasn't much of a flight-to-safety response in Treasuries, with consistently negative returns over the next 2-3 months.
| COMMODITIES |
|  |
|
More and more, there are calls that we're in the beginning of a commodity supercycle, those multi-year cycles when broad baskets of things that people pull out of the ground actually rise in price.
It's been a while since that concept wouldn't be laughed at. But for one of the few times in 40 years, every major commodity contract is now showing a year-over-year gain.
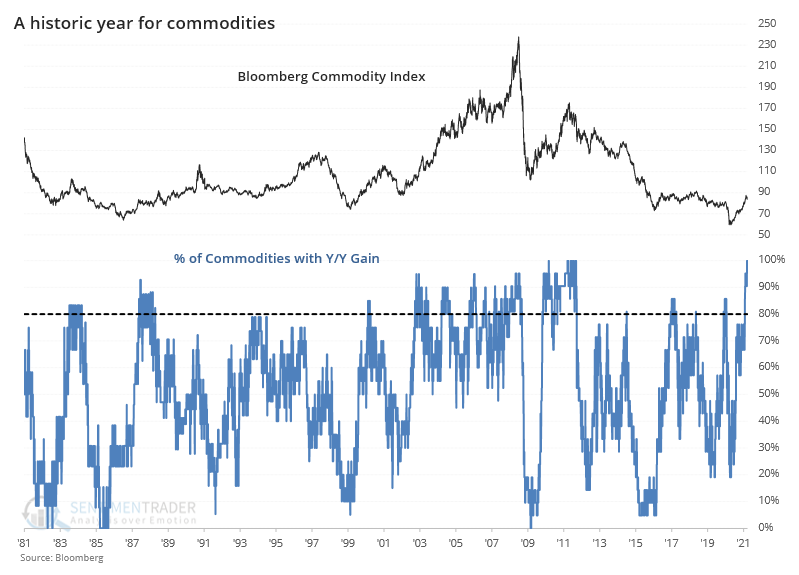
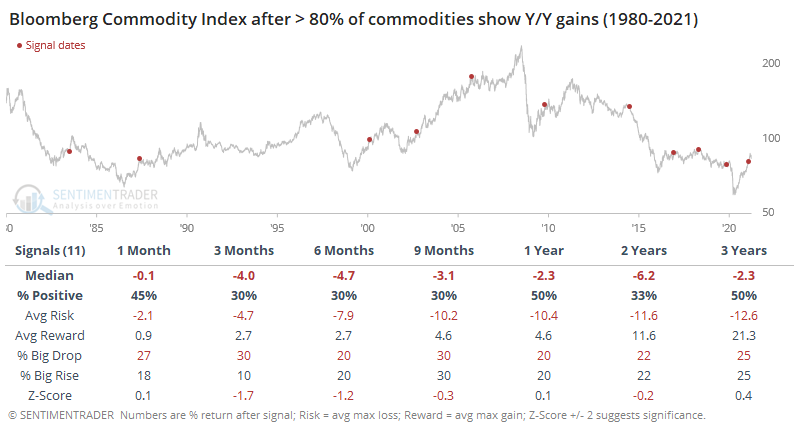
If we focus on the breadth of the price increases among commodity contracts, then we can look at other times when a majority of them were showing gains and see if it suggested a high probability that it was a new supercycle.
The table below shows each distinct occurrence since 1980, with forward returns in the Bloomberg Commodity Index.
Jay mentioned that a lot of investors are familiar with the 4-year cycle - or "Election Cycle" - for the stock market. But does it apply to precious metals as well?
The answer appears to be, "Yes, but differently." Whereas the stock market tends to exhibit strength or weakness during specific times within each 4-year cycle, gold seems to treat each alternating 4-year period differently.
The chart below shows the cumulative price gain/loss for gold during the "unfavorable" 4-year periods.
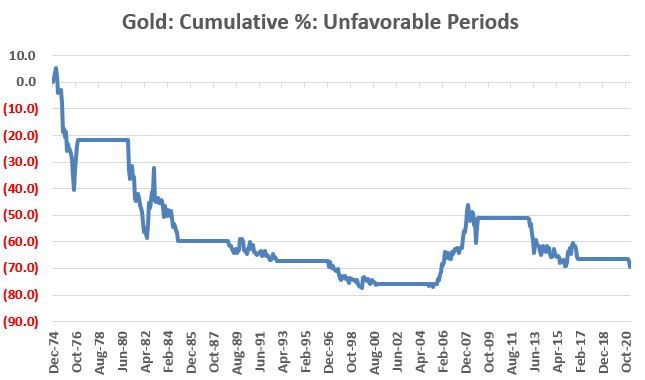
Gold entered a seasonally unfavorable period on January 1, 2021. Since then, gold has lost roughly -9%. Will the shiny metal bounce back? It certainly could (it gained over 100% from 2004 through 2008).
But for the next four years, any gains may have to come "against the wind" of an unfavorable 4-year cycle.
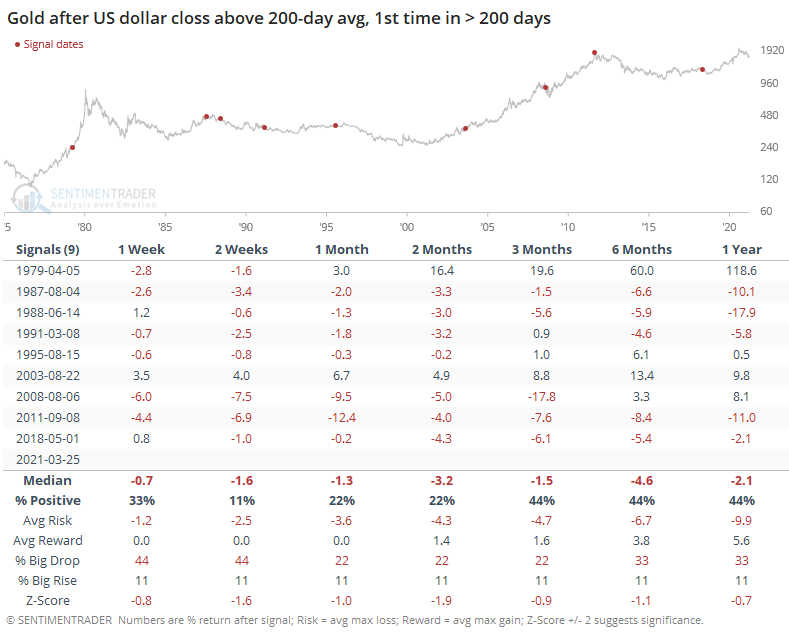
A more pressing issue for gold is that the trend in the U.S. dollar has turned higher. When the buck rose above its 200-day average for the first time in more than 200 days, gold suffered.
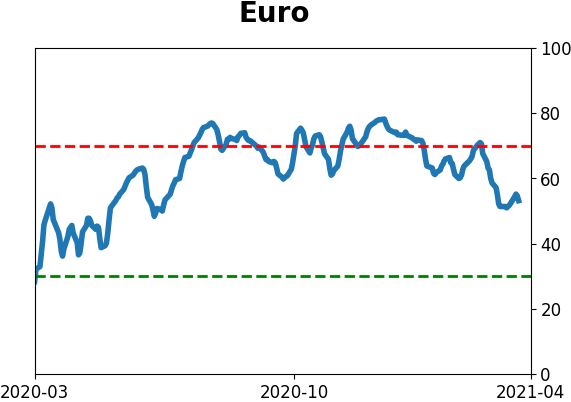
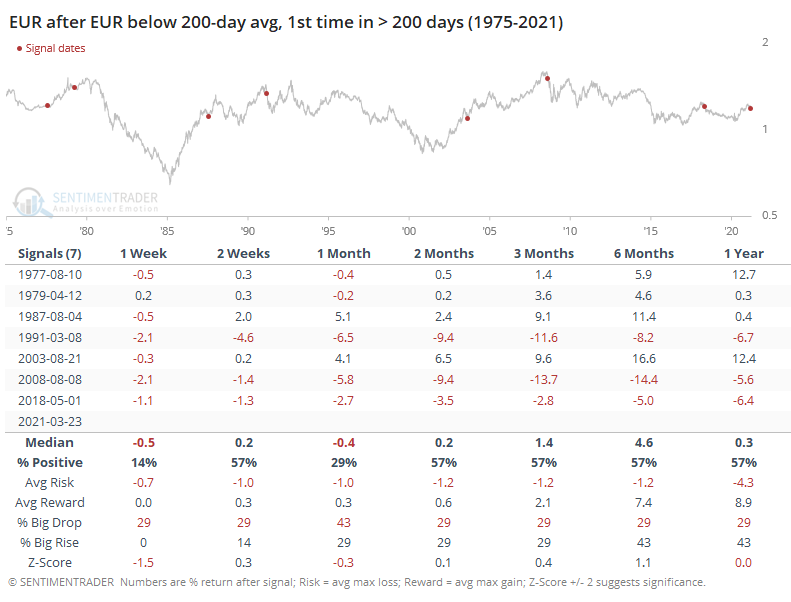
The dollar is rising in large part because the euro fell below its 200-day average. This would be its first cross below the average in over 200 days, ending its 7th-longest streak above the 200-day since 1975.
Once it did this, it tended to keep going. A month later, the euro had rebounded only 29% of the time, though in the months after that it was mixed-to-higher.
Active Studies
| Time Frame | Bullish | Bearish | | Short-Term | 0 | 0 | | Medium-Term | 2 | 10 | | Long-Term | 16 | 4 |
|
Indicators at Extremes
Portfolio
| Position | Description | Weight % | Added / Reduced | Date | | Stocks | RSP | 4.9 | Reduced 4% | 2021-02-09 | | Bonds | 30.0% BND, 8.8% SCHP | 38.8 | Added 15.1% | 2021-02-18 | | Commodities | GCC | 2.3 | Reduced 2.1%
| 2020-09-04 | | Precious Metals | GDX | 9.0 | Added 0.1% | 2021-02-18 | | Special Situations | 7.3% XLE, 4.8% PSCE | 12.1 | Reduced 5.6% | 2021-02-18 | | Cash | | 32.8 | | |
|
Updates (Changes made today are underlined)
With a market that has seen the kinds of broad participation and big breath thrusts like we did in the fall, it's hard to become too negative. Those kinds of conditions have consistently preceded higher returns over the next 6-12 months. It's the interim that's more of an issue. Even conditions like that haven't prevented some shorter-term pullbacks. And when we combine an environment where speculation is rampant and recent days have seen an increase in cracks under the surface of the indexes, it's enough to become more defensive over a short- to medium-term time frame. We still don't have much confirmation from the price action in the indexes, so those who are more conservative would likely wait before increasing cash levels. I've decreased risk exposure a bit more, mainly in terms of energy stocks and the ANGL fund, while adding more to the broader bond market. RETURN YTD: 6.2% 2020: 8.1%, 2019: 12.6%, 2018: 0.6%, 2017: 3.8%, 2016: 17.1%, 2015: 9.2%, 2014: 14.5%, 2013: 2.2%, 2012: 10.8%, 2011: 16.5%, 2010: 15.3%, 2009: 23.9%, 2008: 16.2%, 2007: 7.8%
|
|
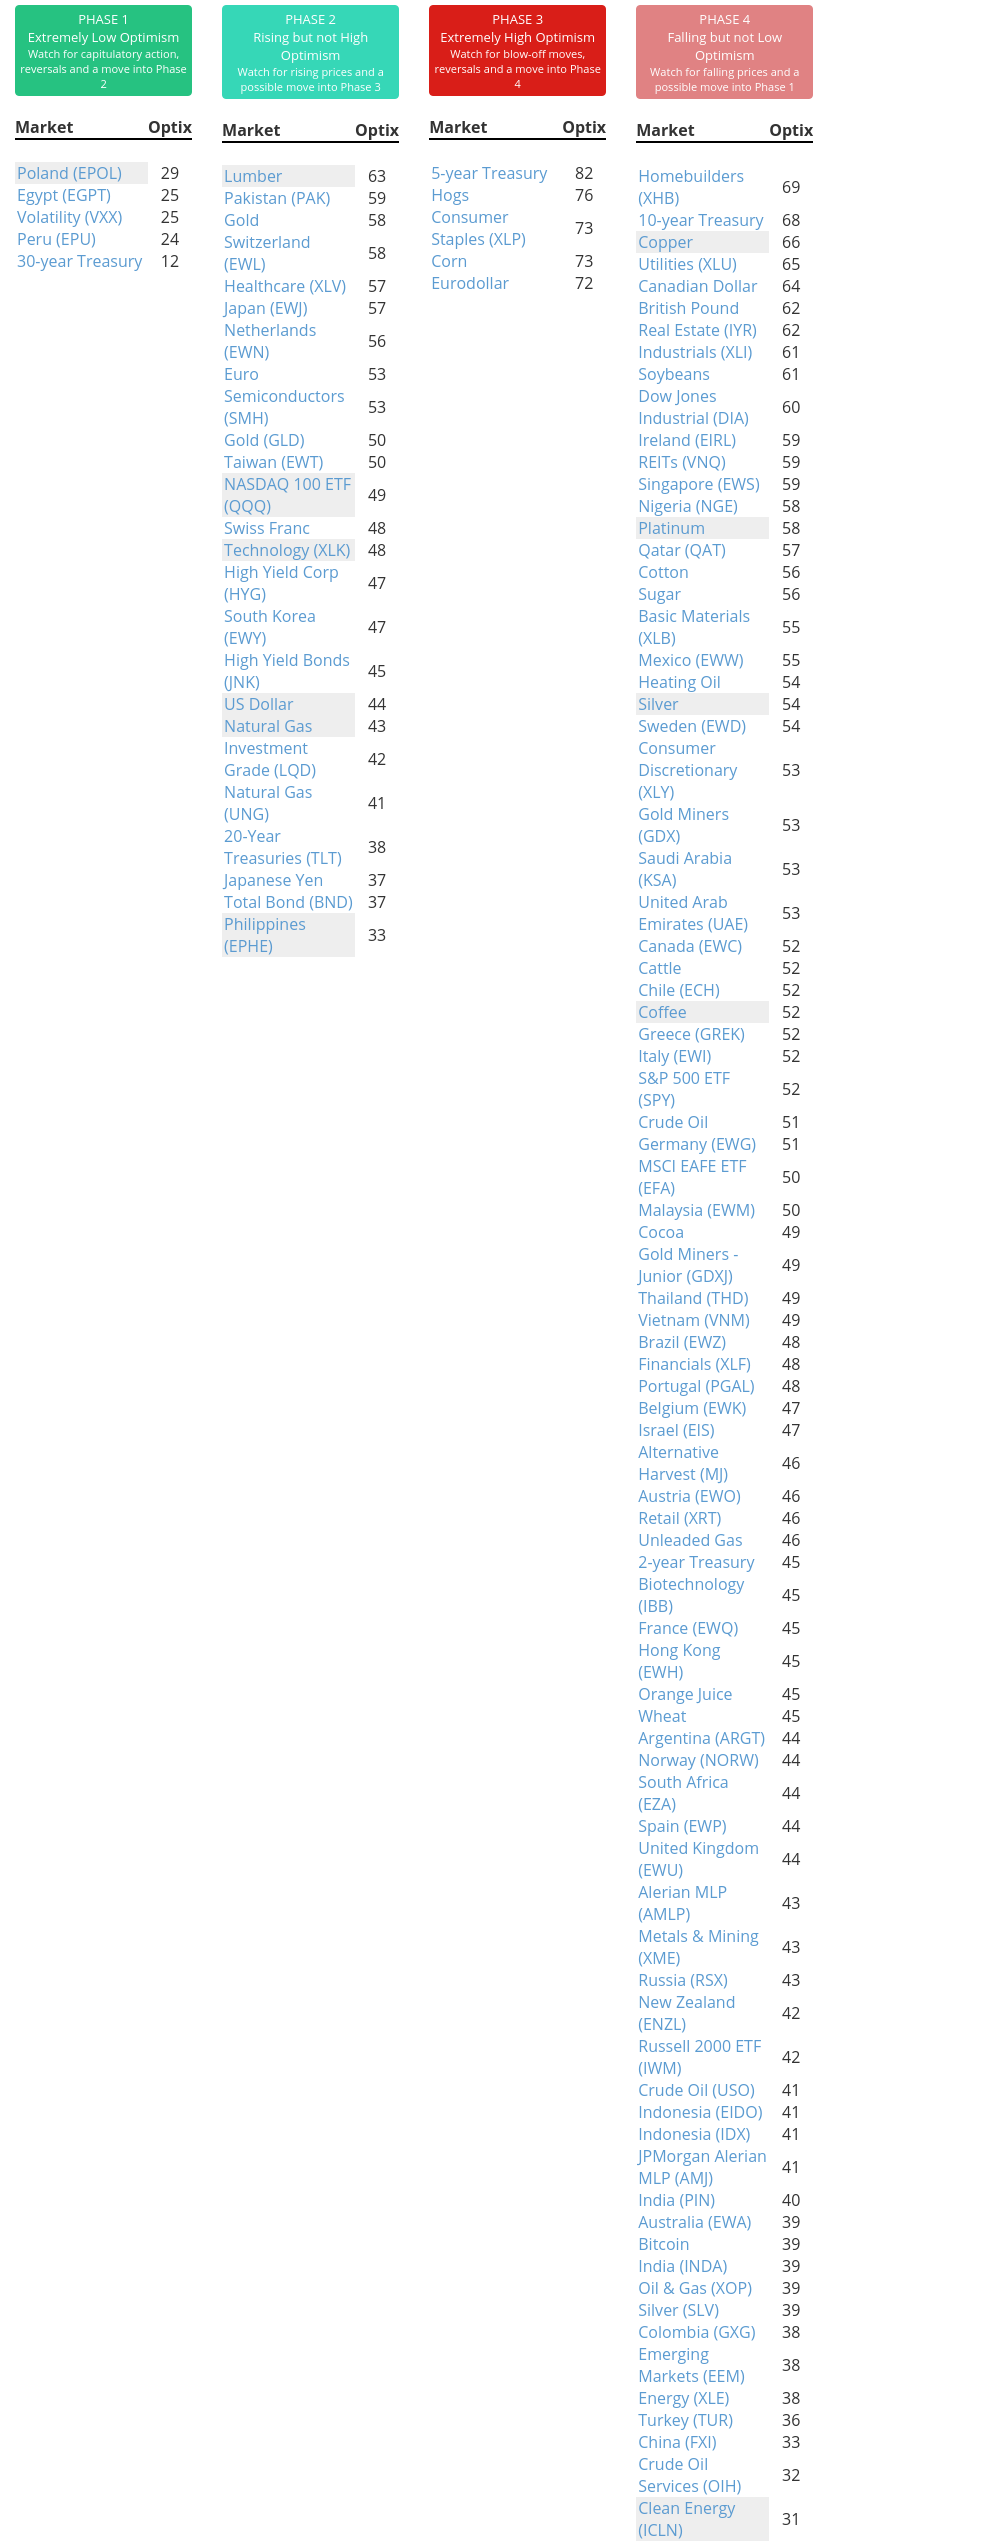
Phase Table
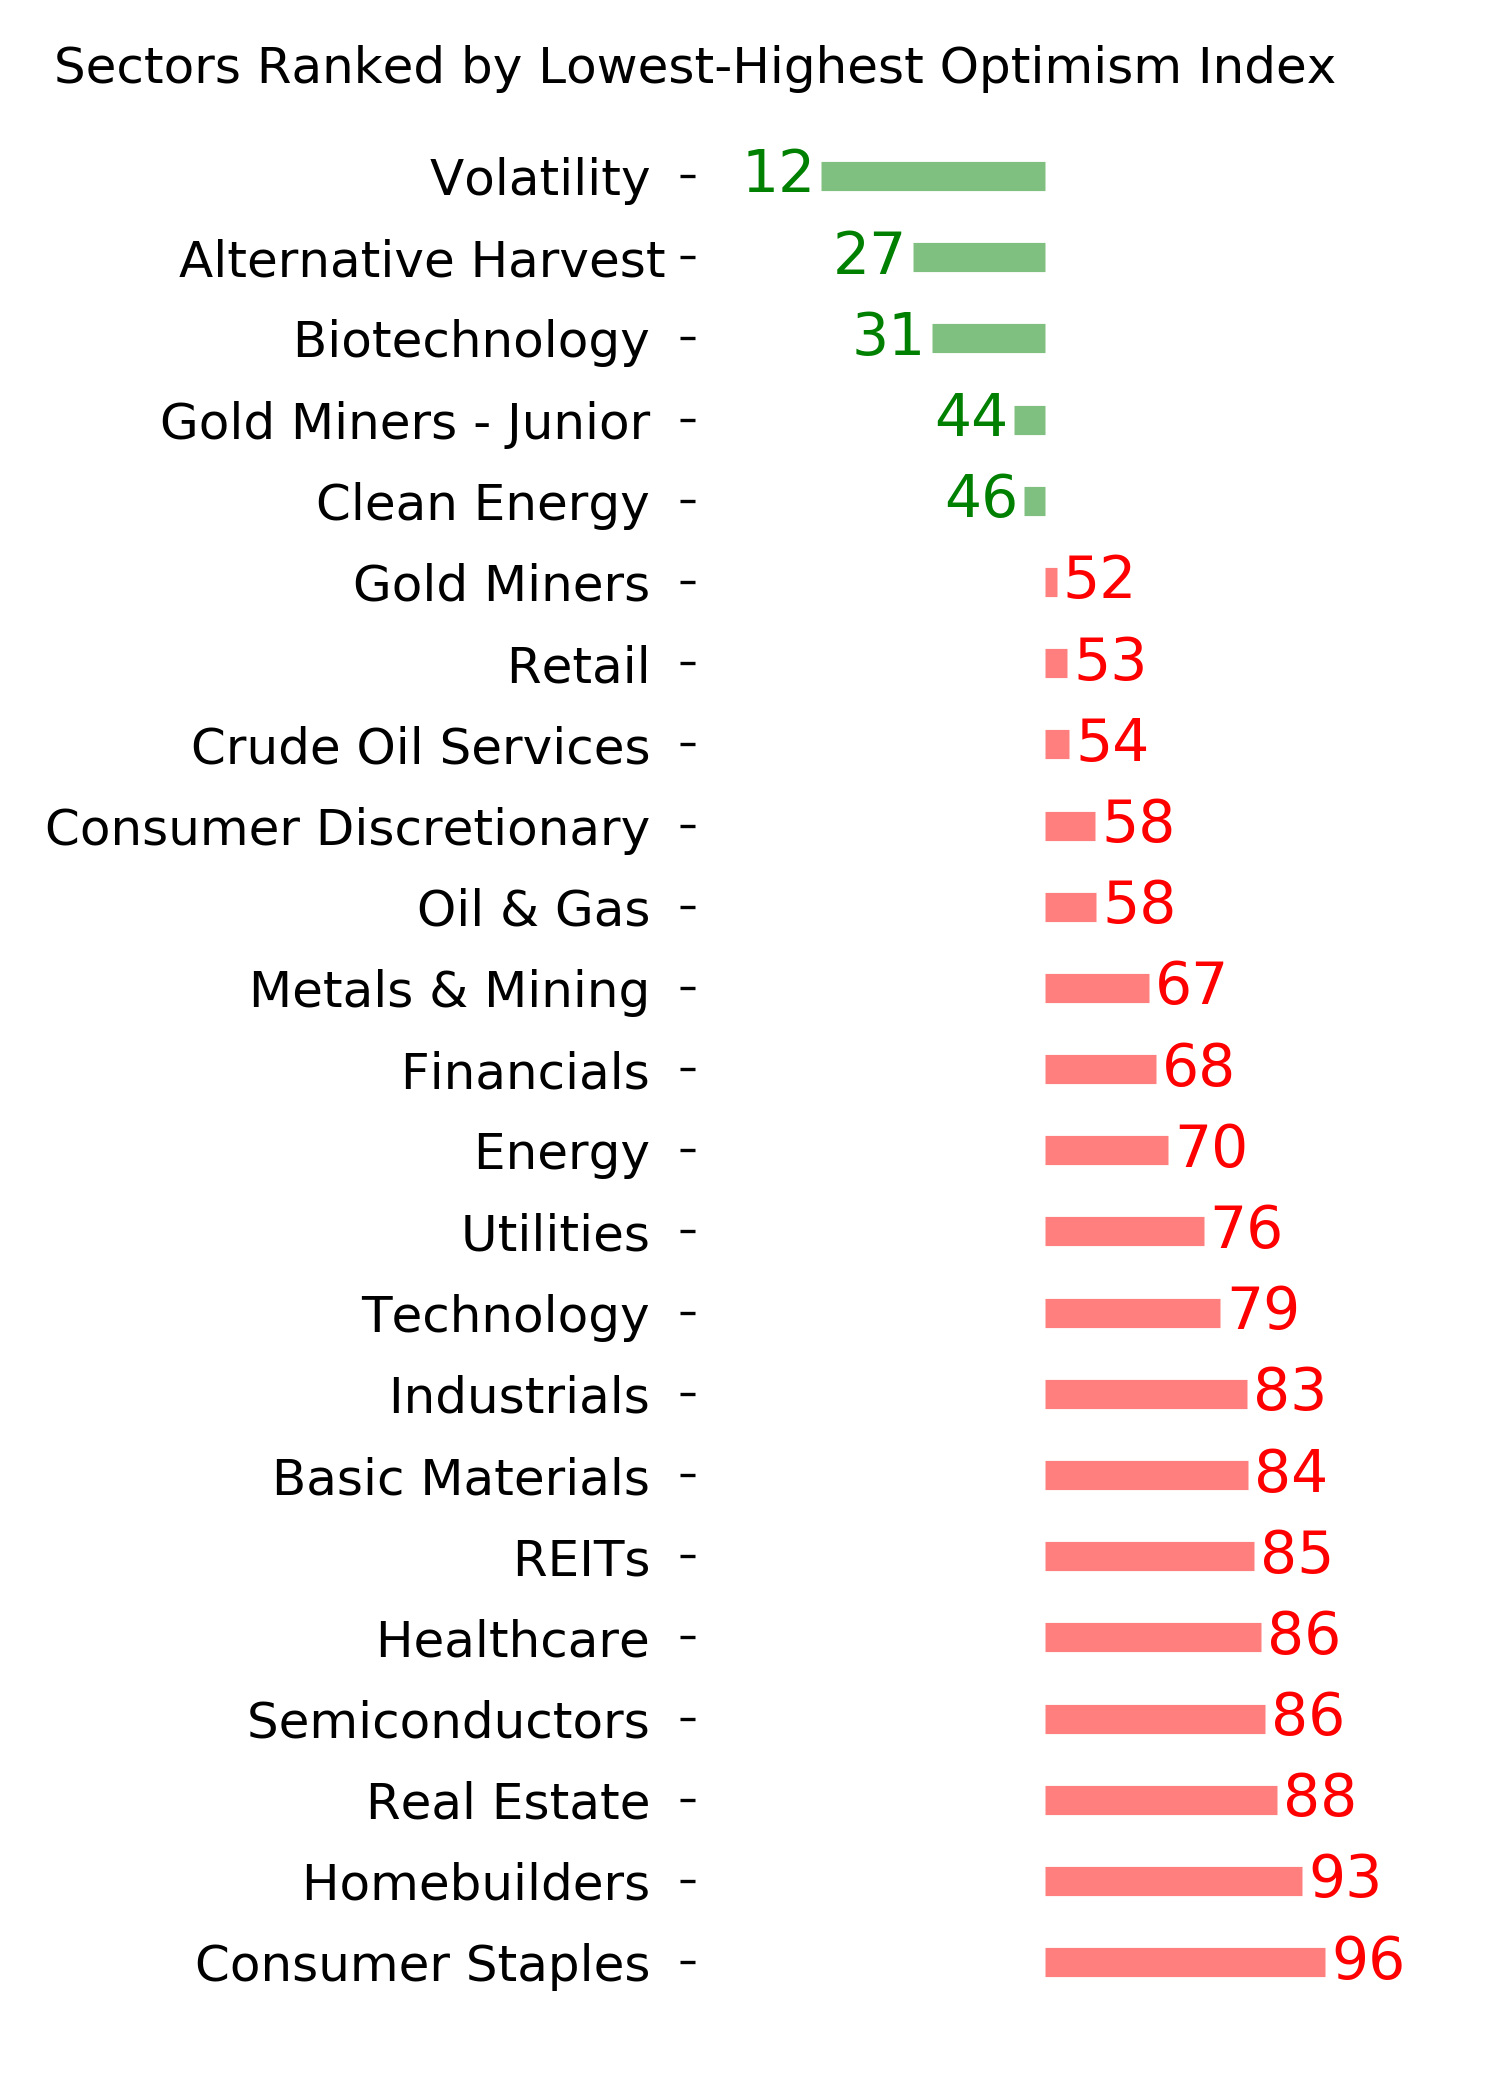
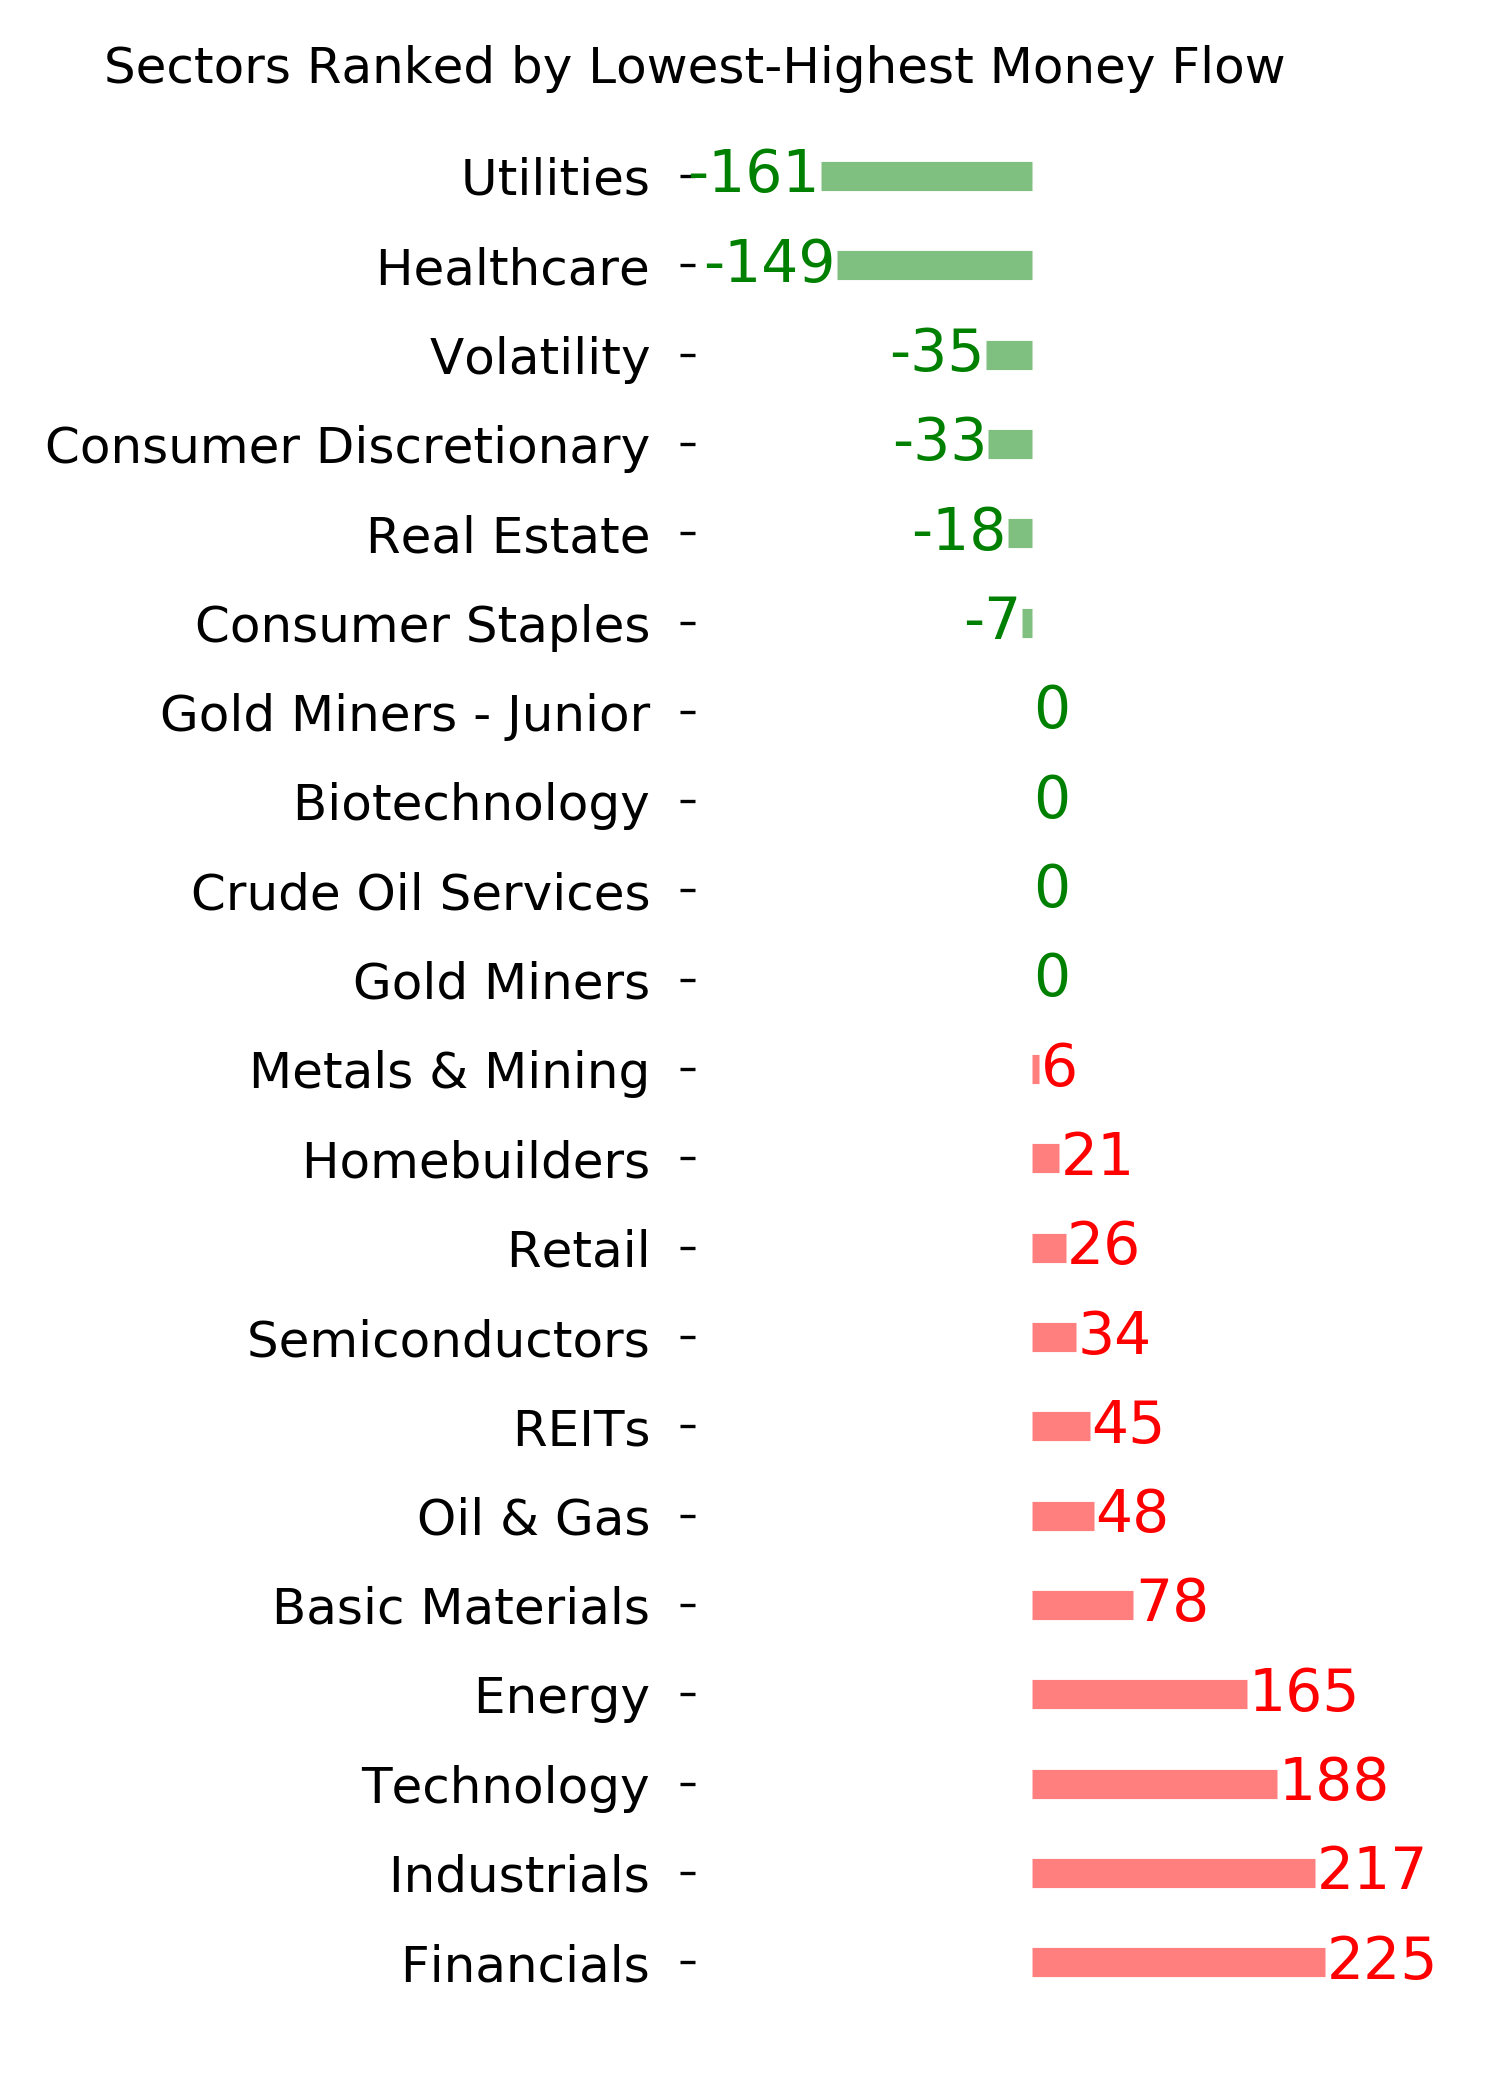
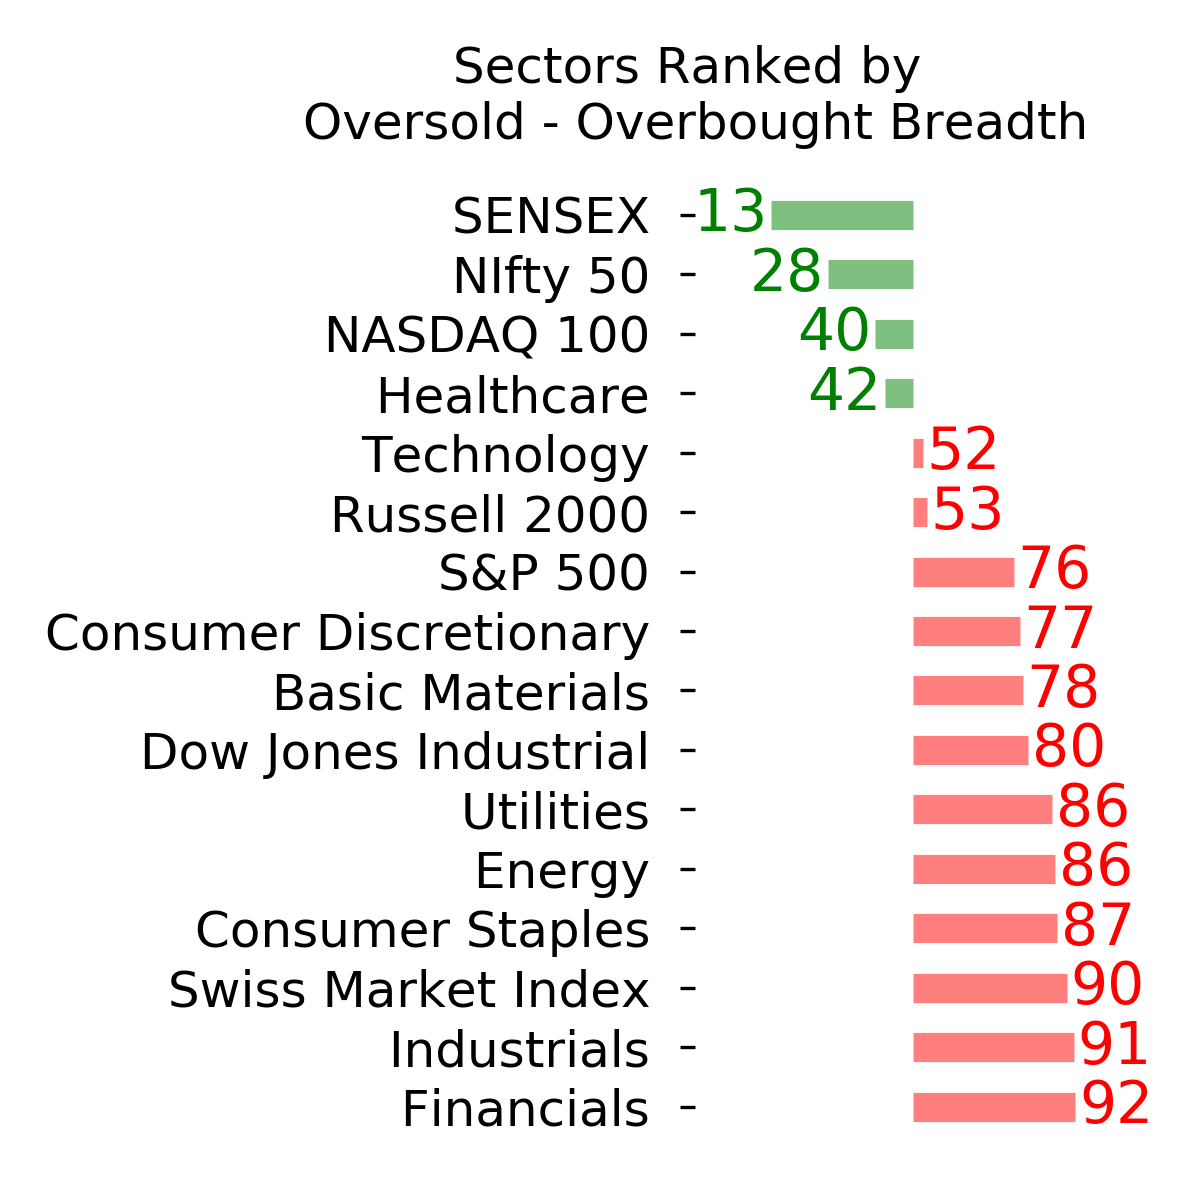
Ranks
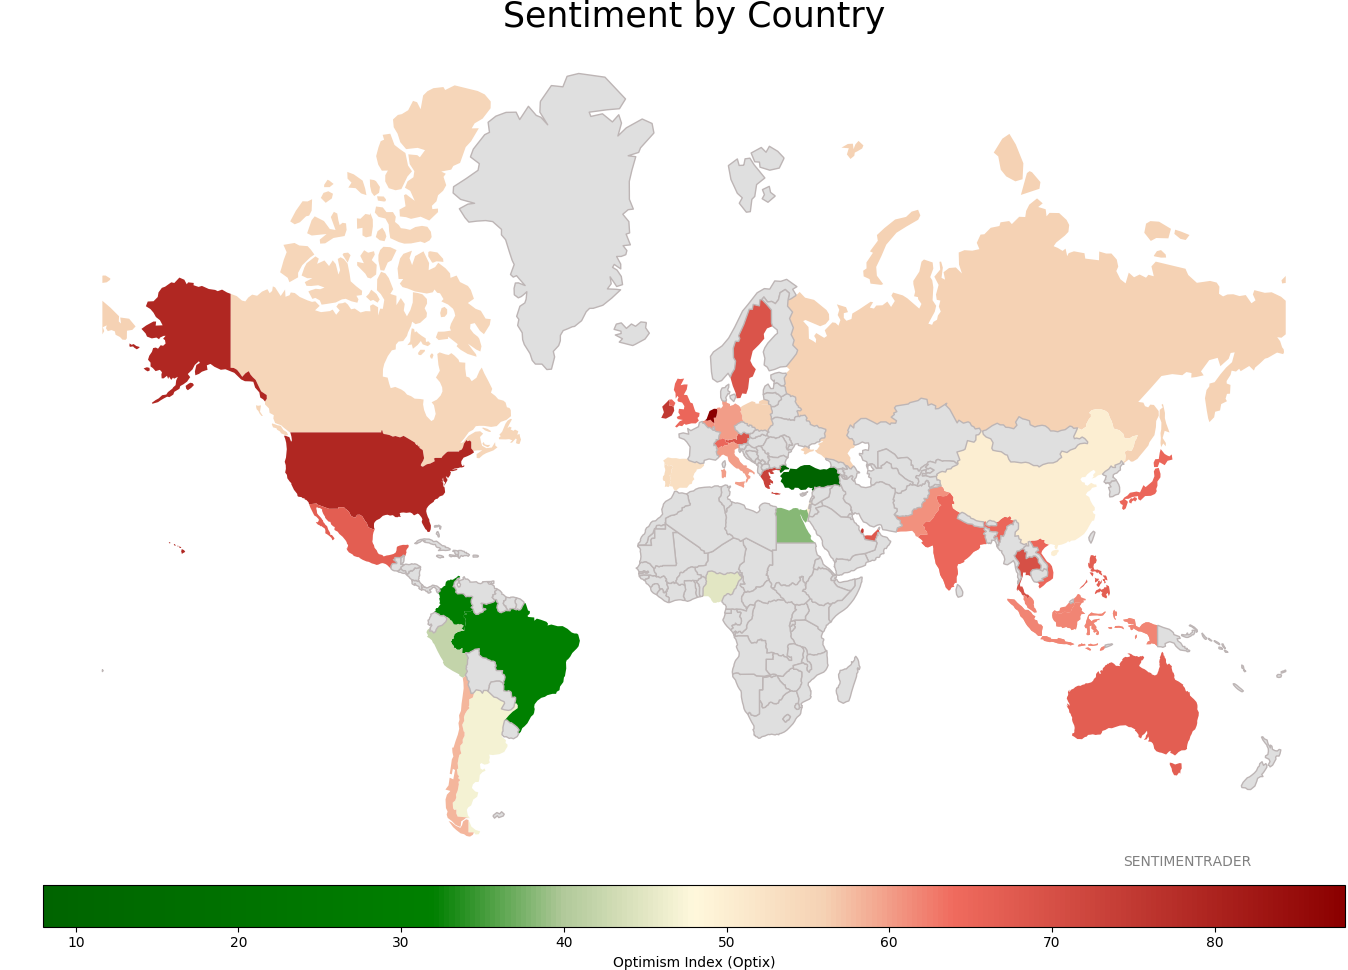
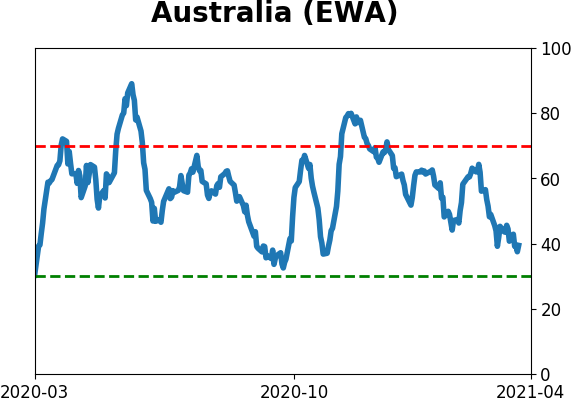
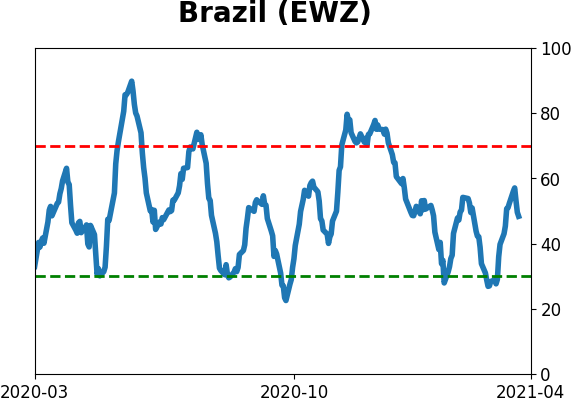
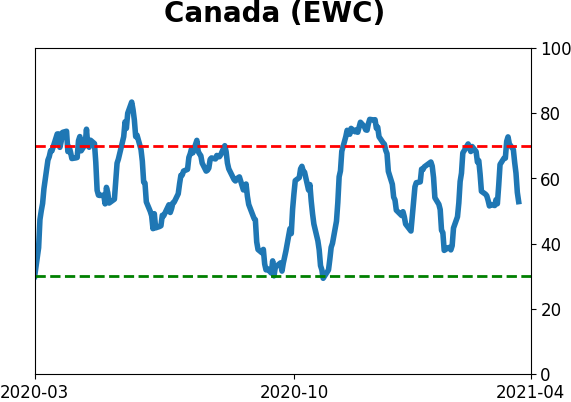
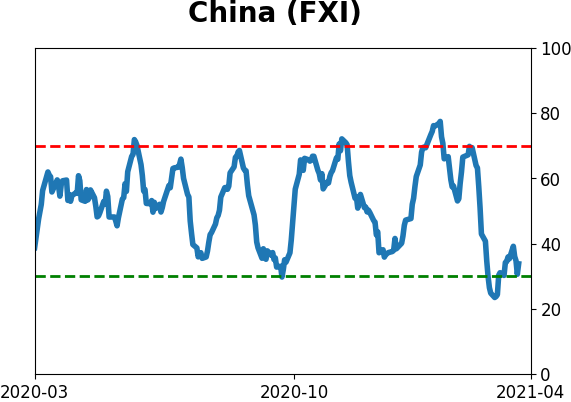
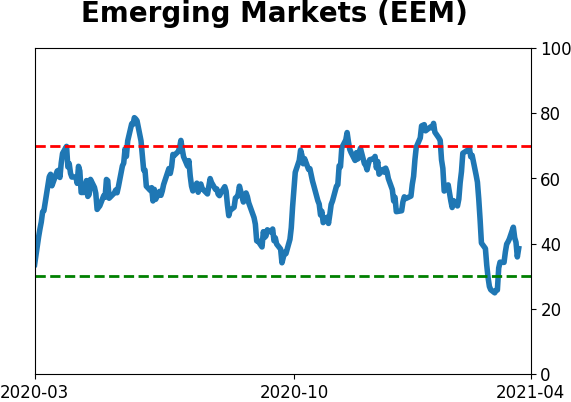
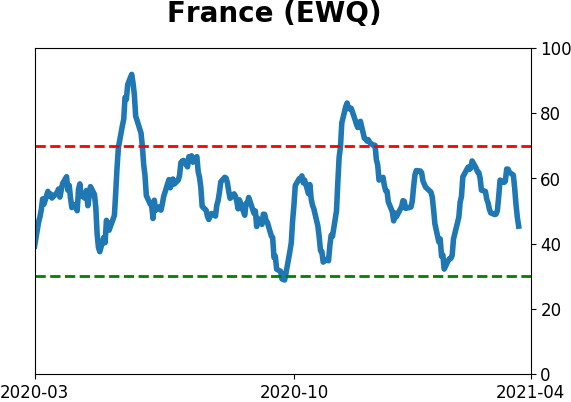
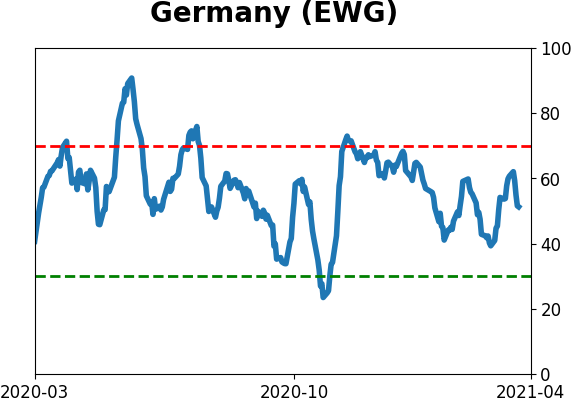
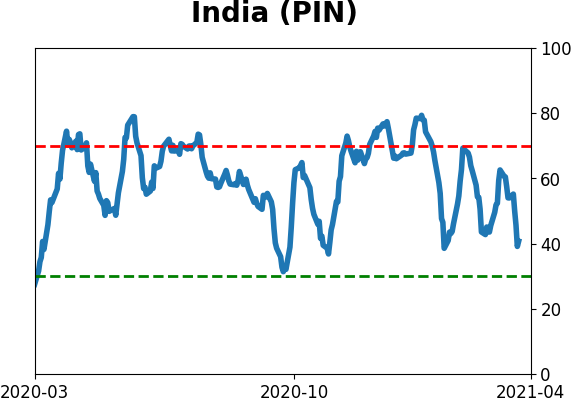
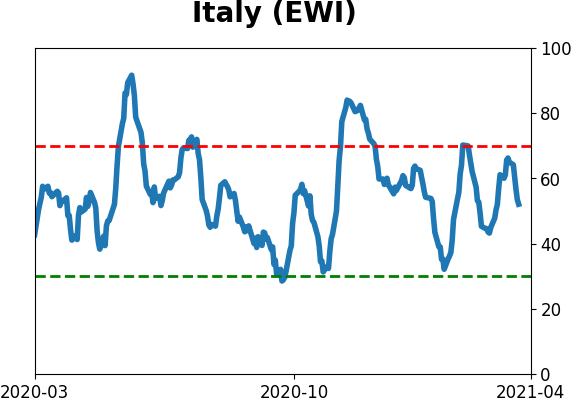
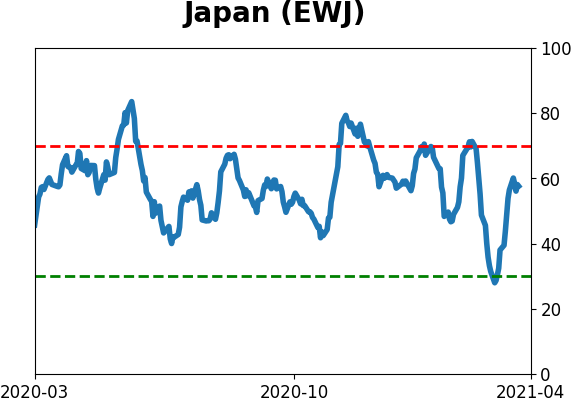
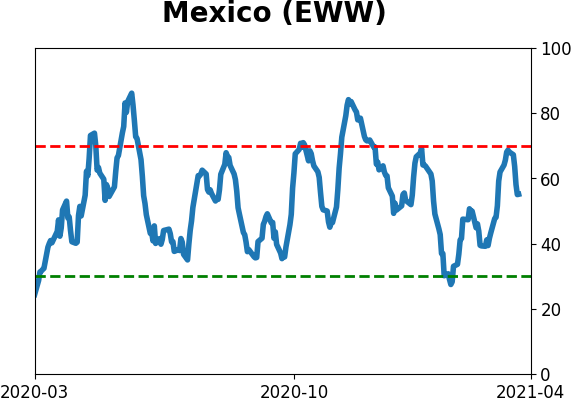
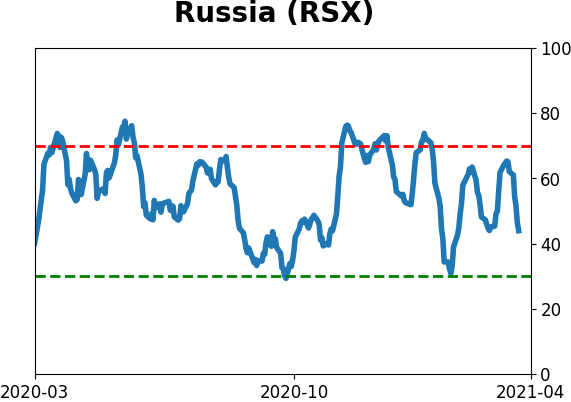
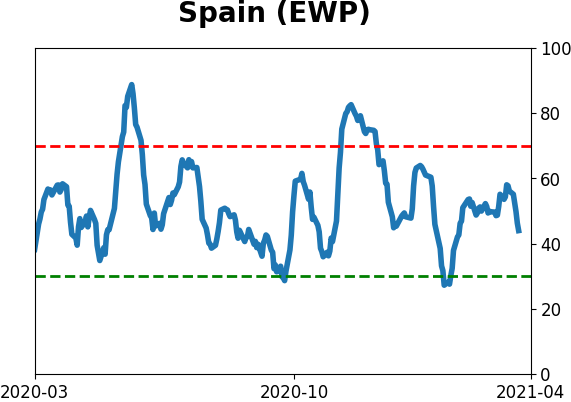
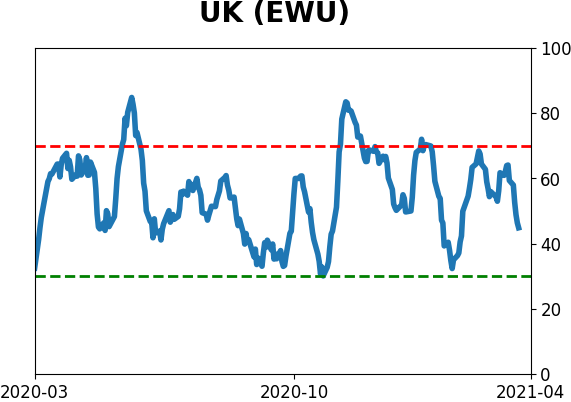
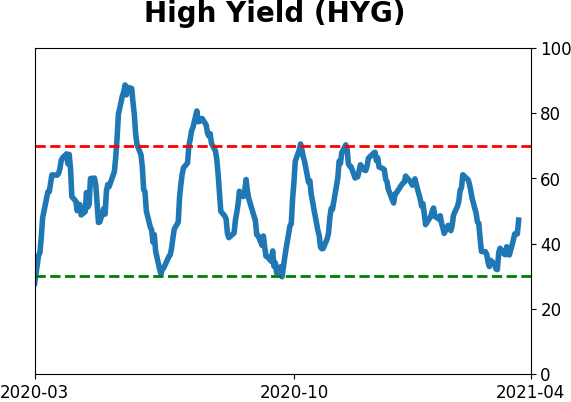
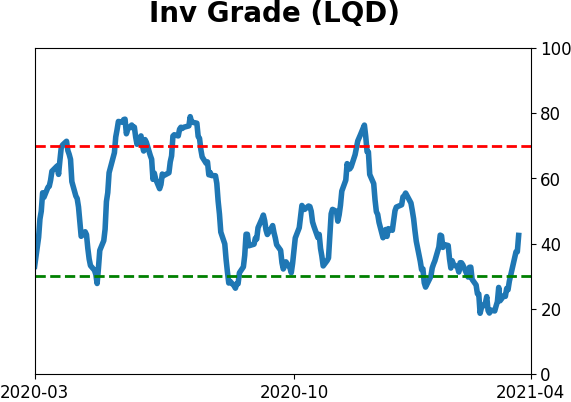
Sentiment Around The World
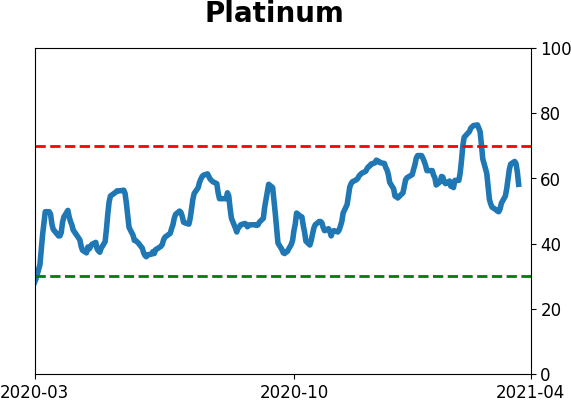
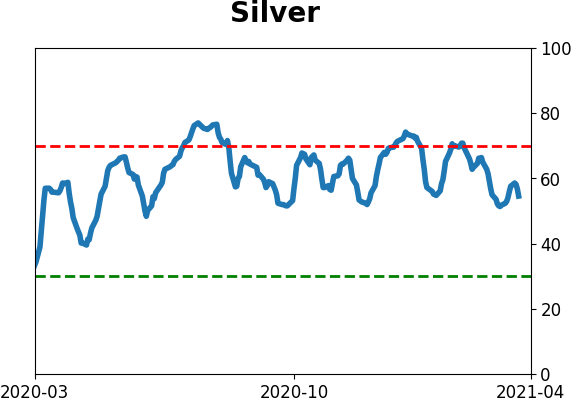
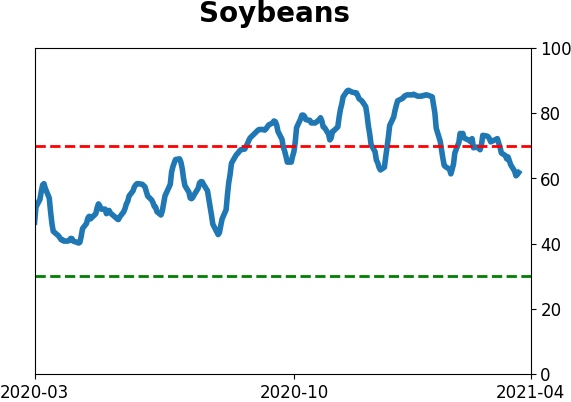
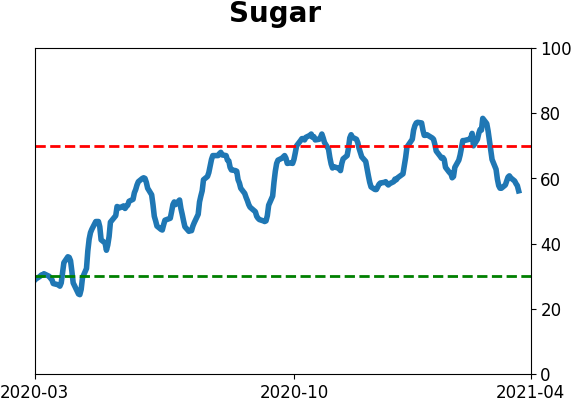
Optimism Index Thumbnails
|
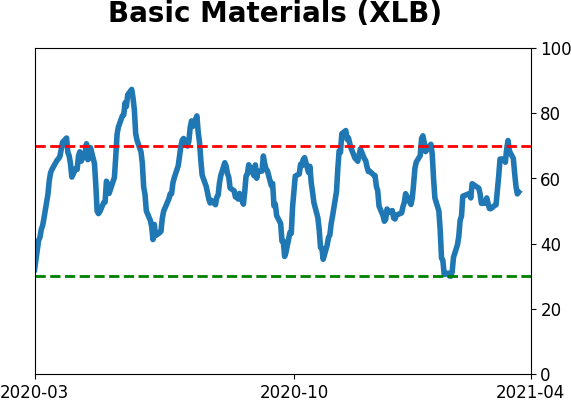
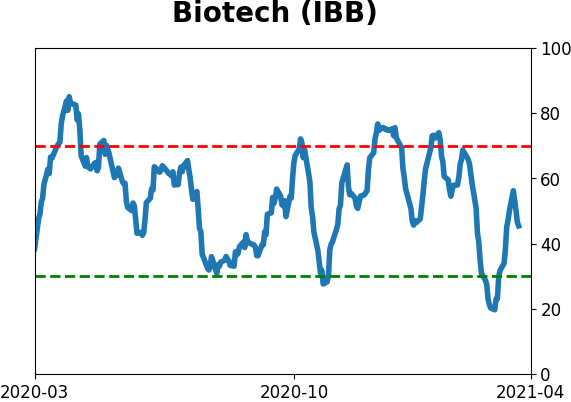
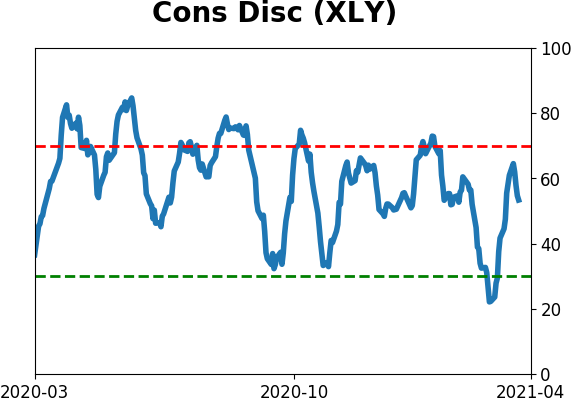
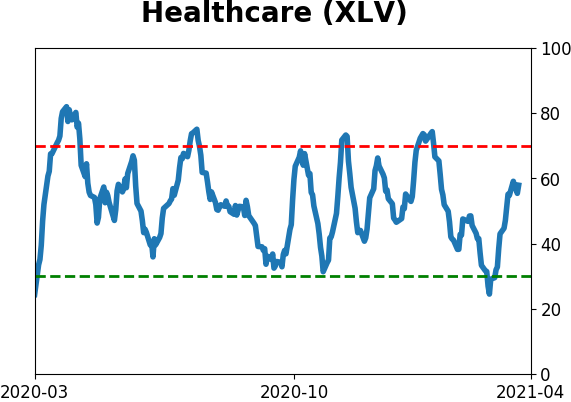
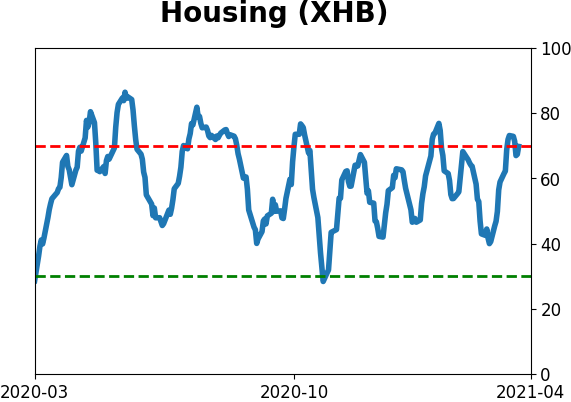
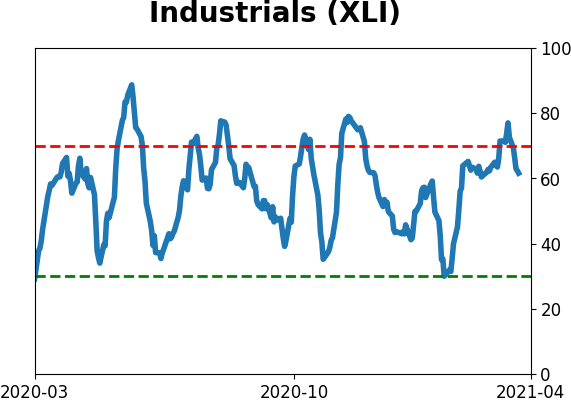
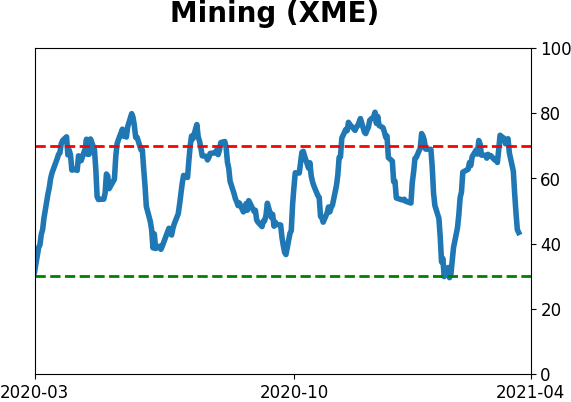
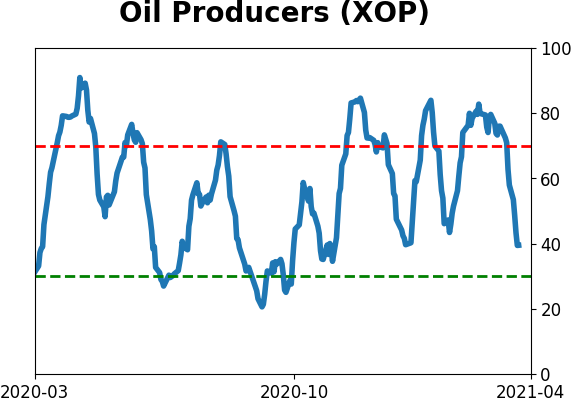
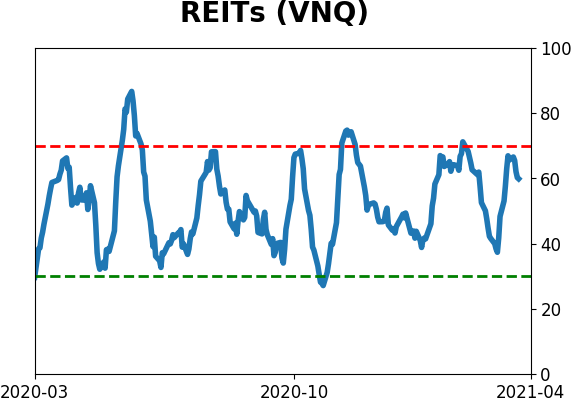
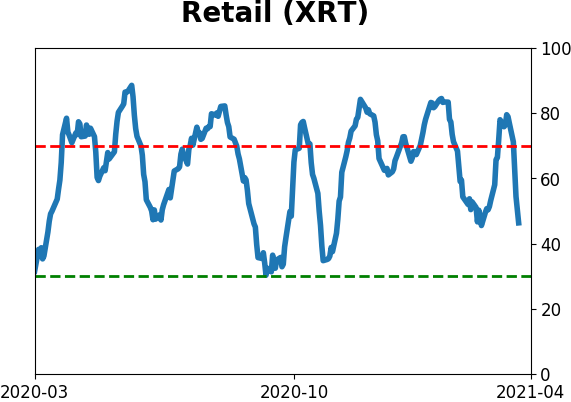
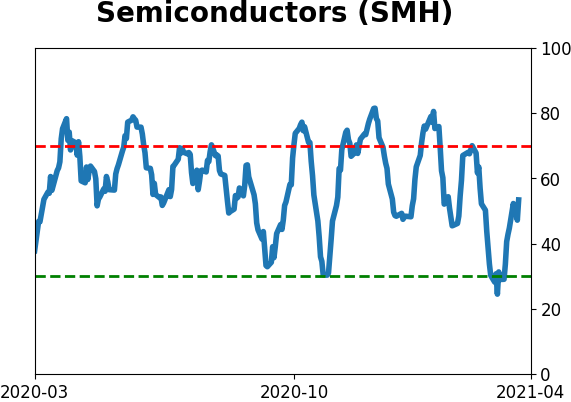
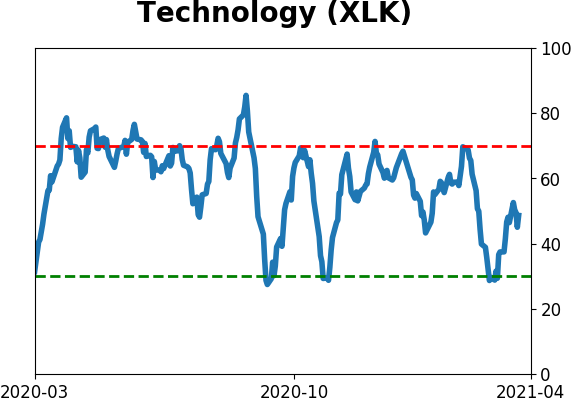
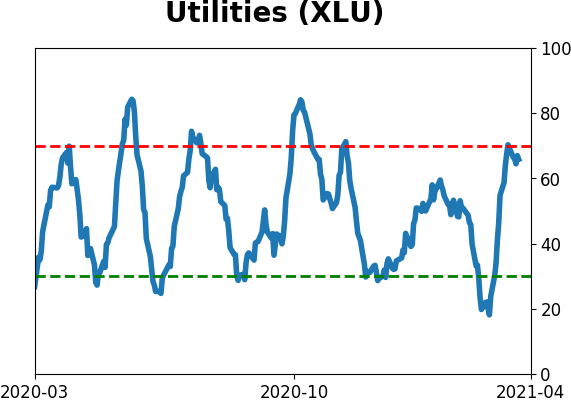
Sector ETF's - 10-Day Moving Average
|
|
|
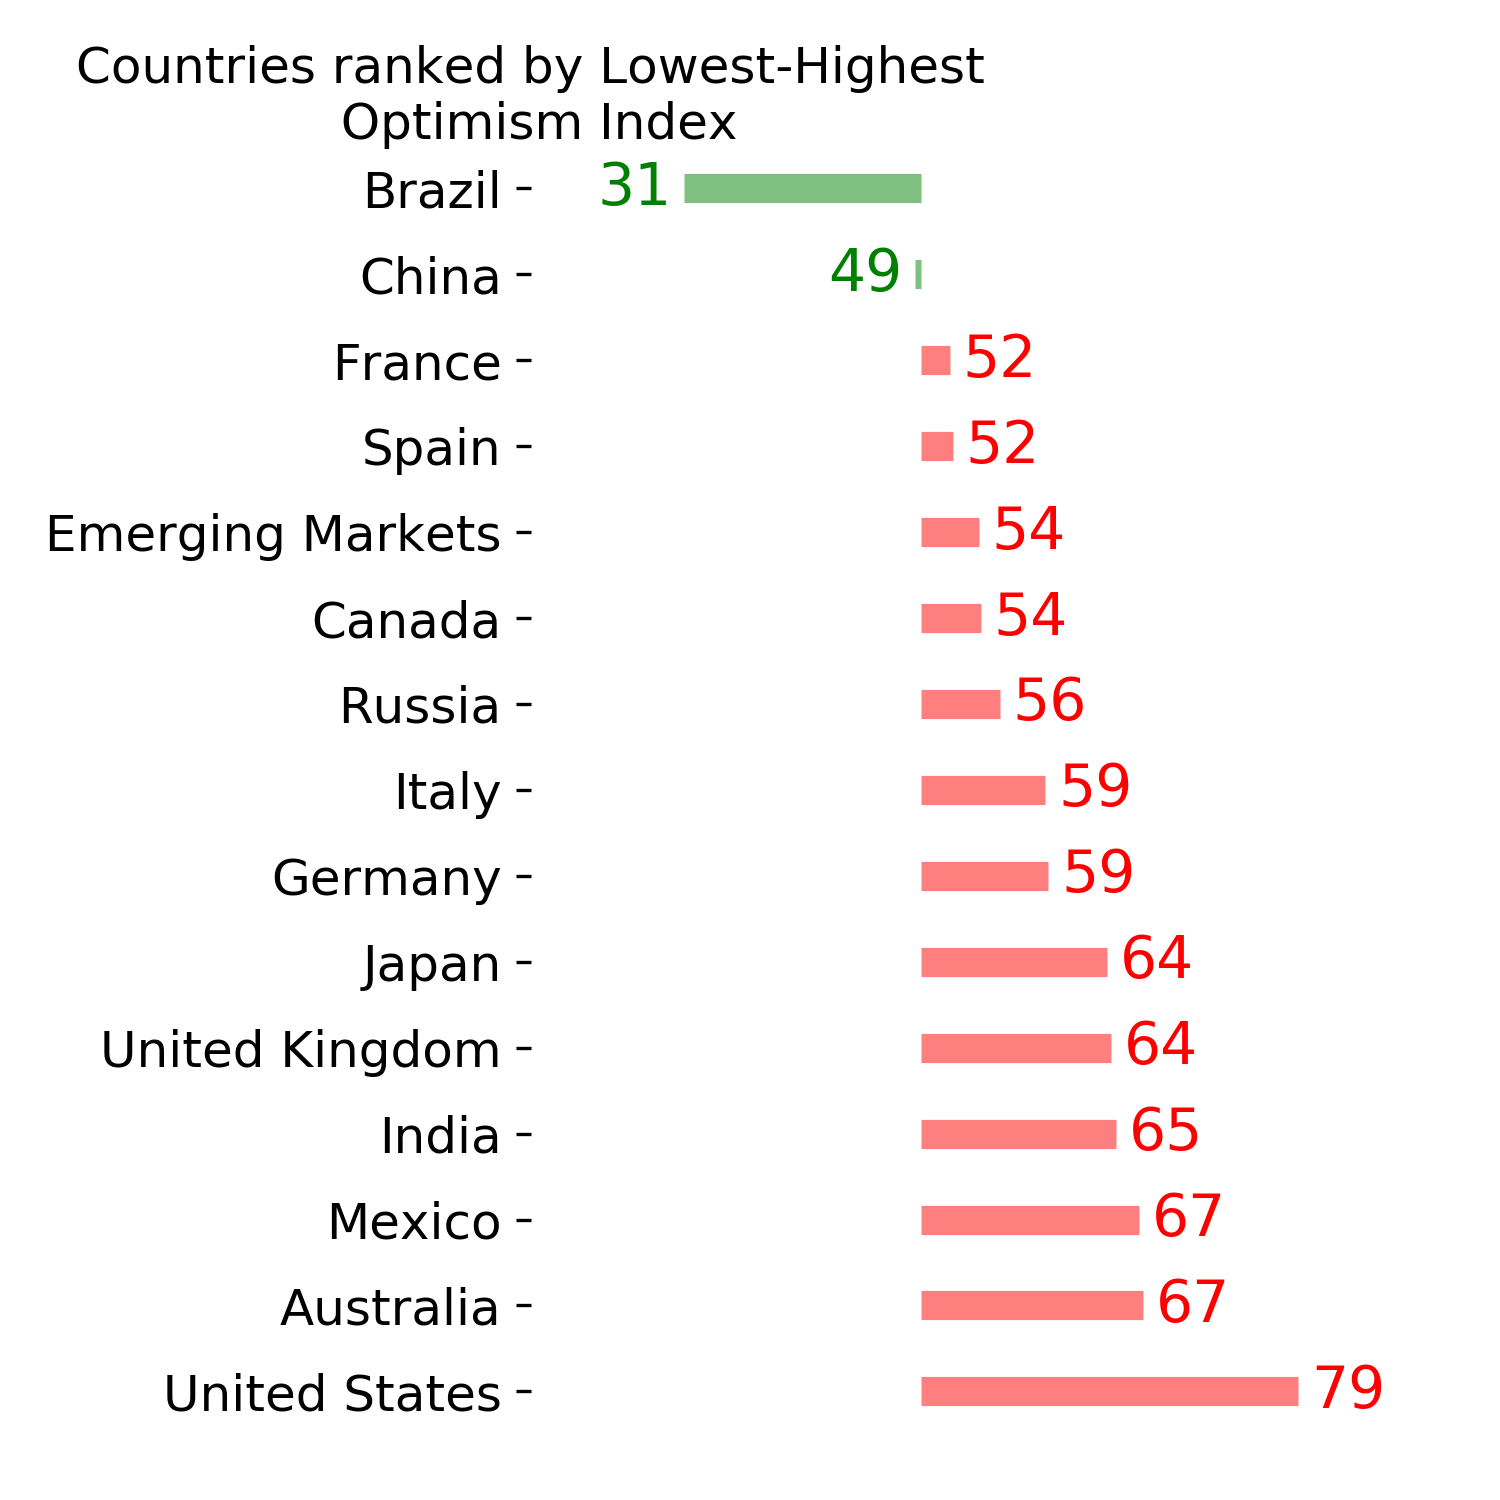
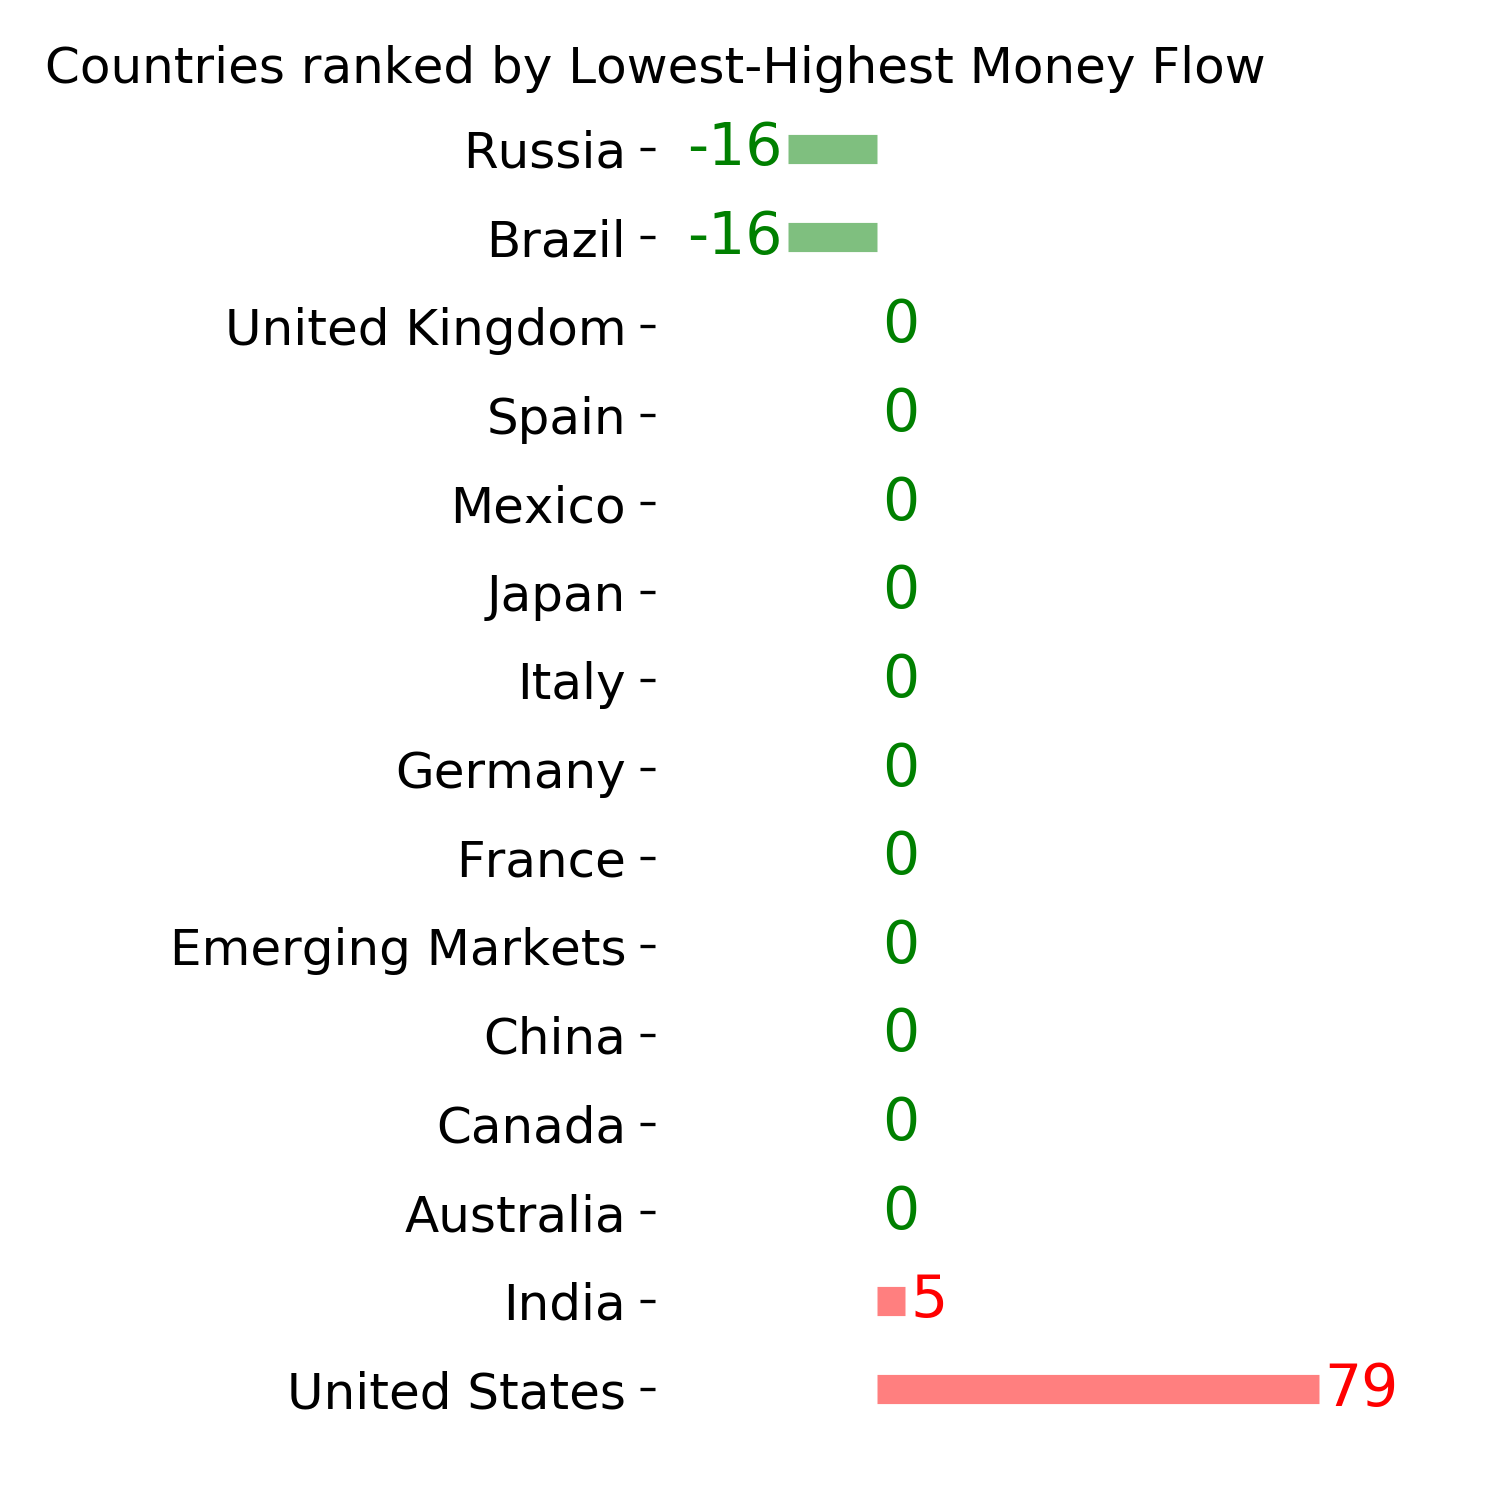
Country ETF's - 10-Day Moving Average
|
|
|
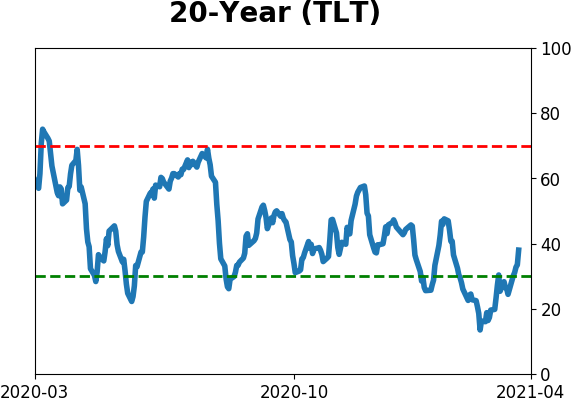
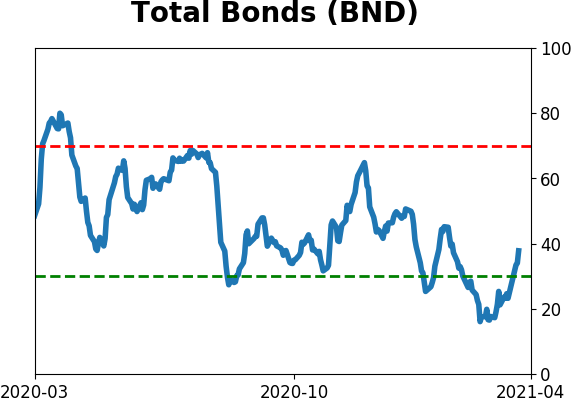
Bond ETF's - 10-Day Moving Average
|
|
|
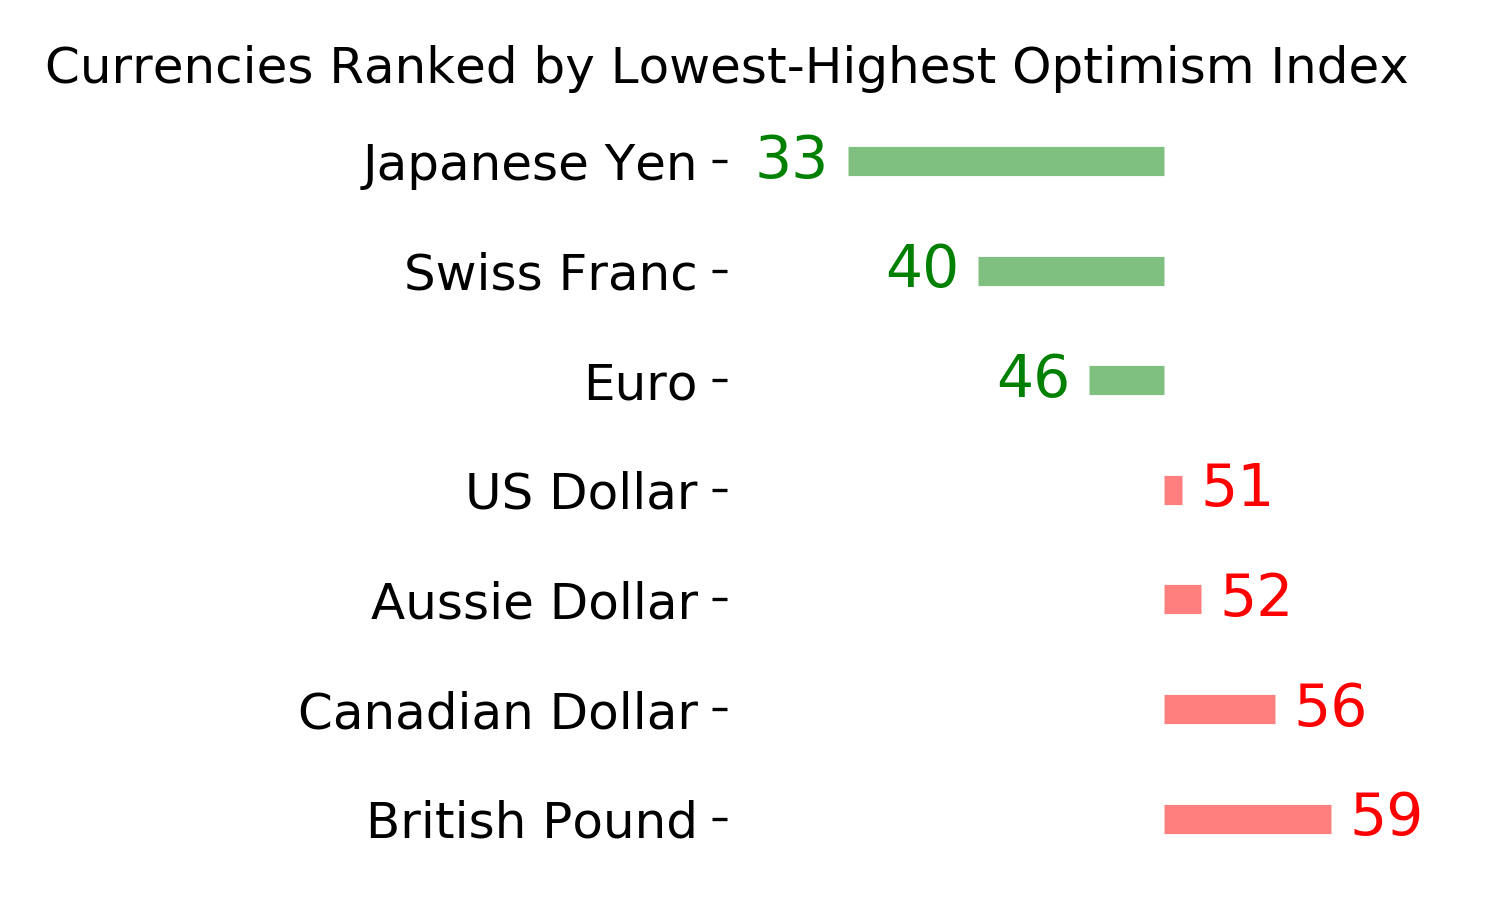
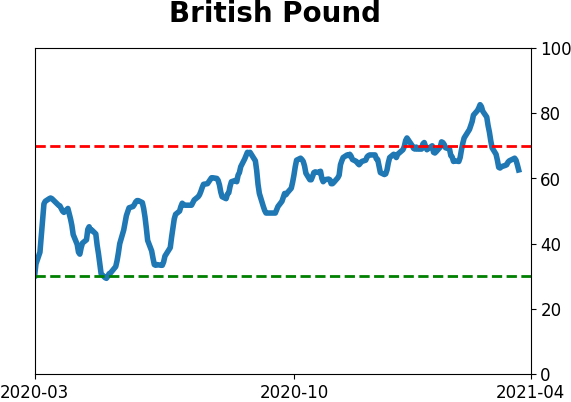
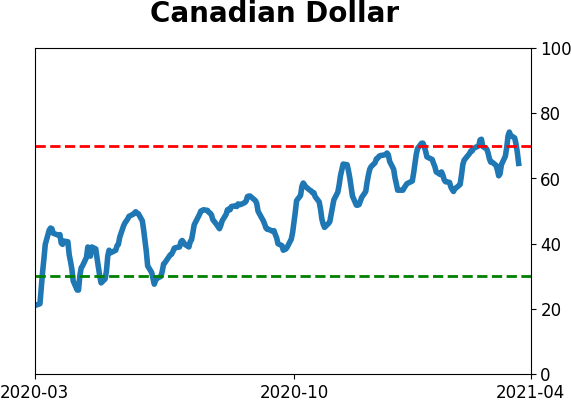
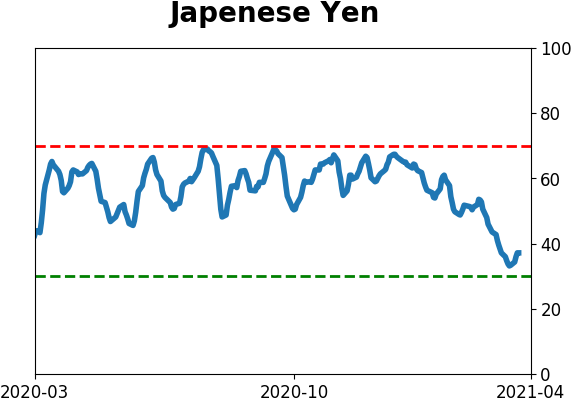
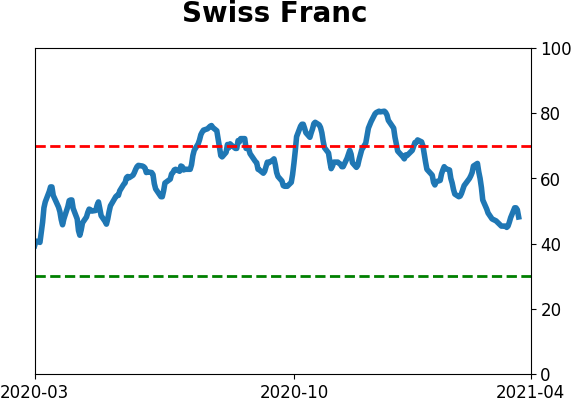
Currency ETF's - 5-Day Moving Average
|
|
|
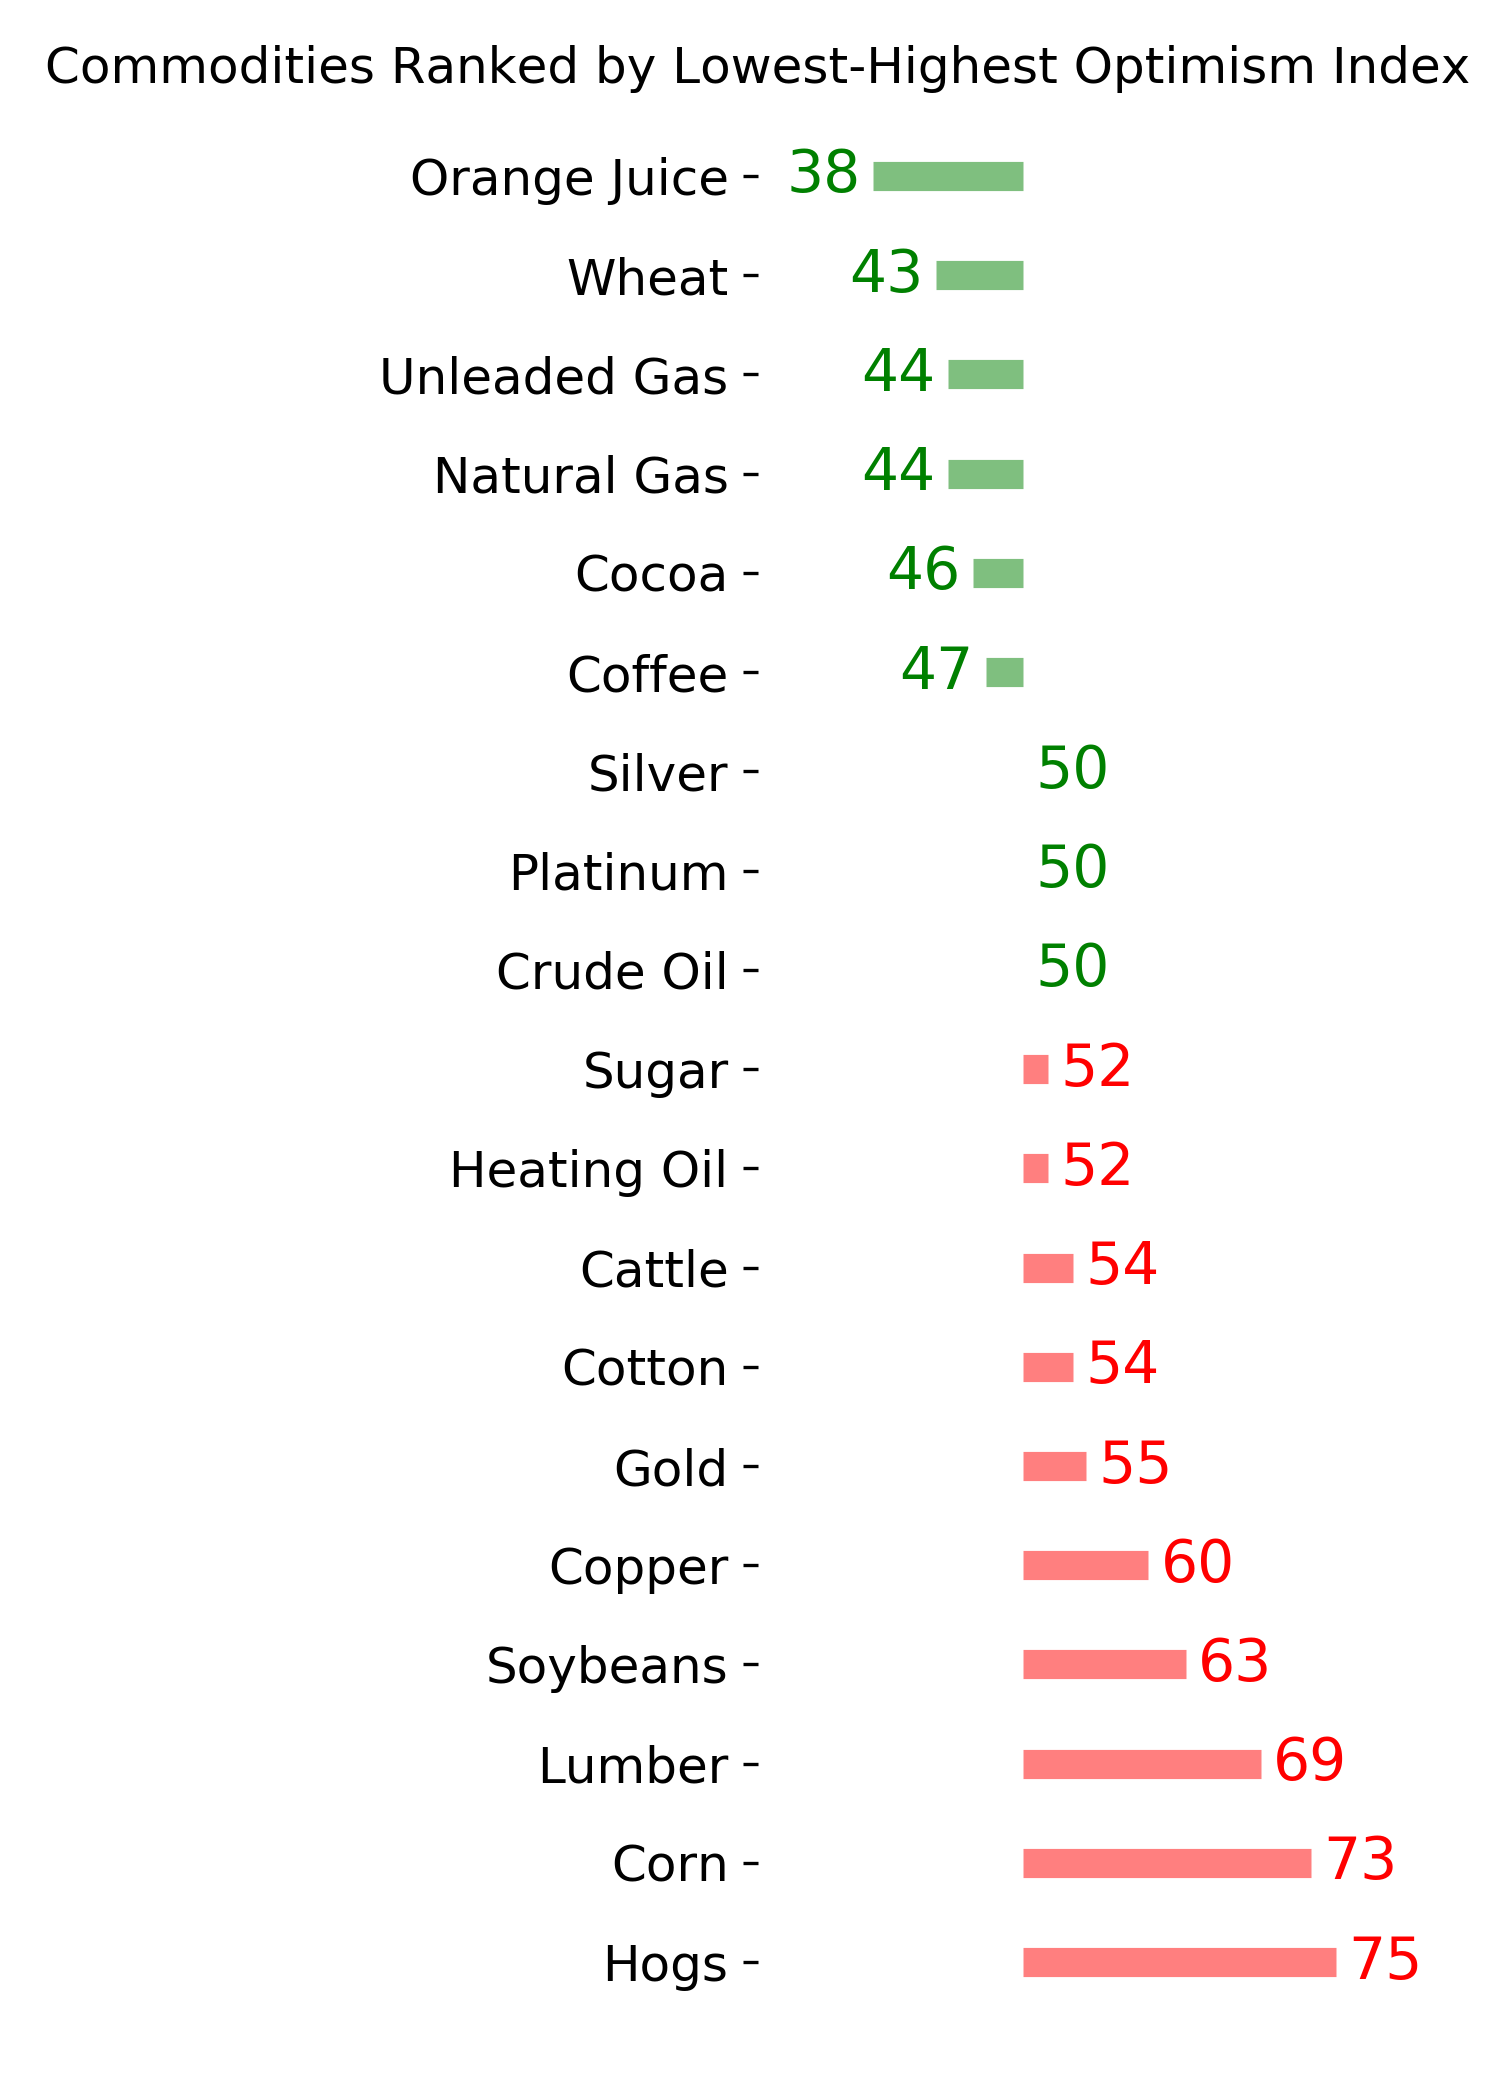
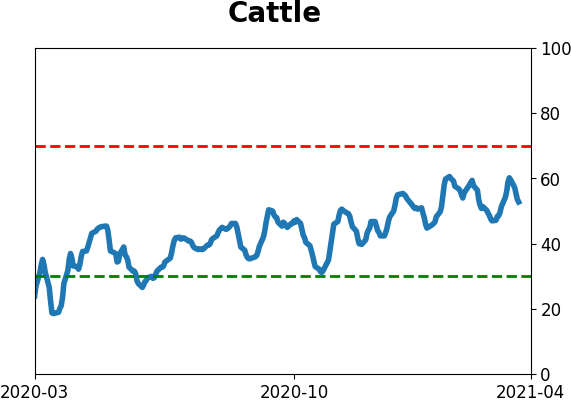
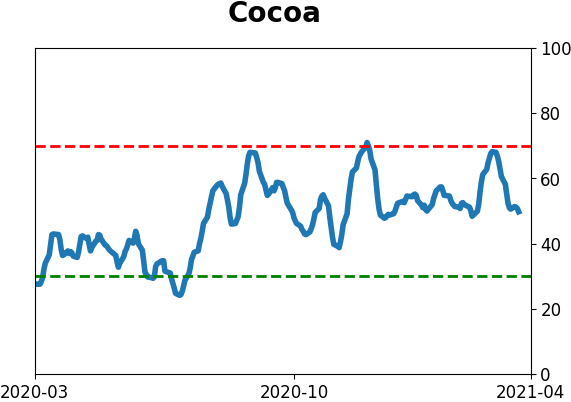
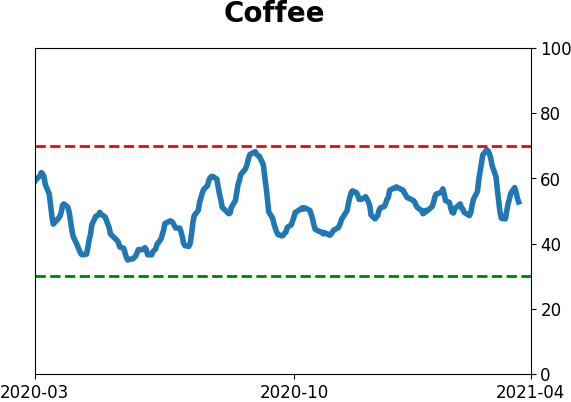
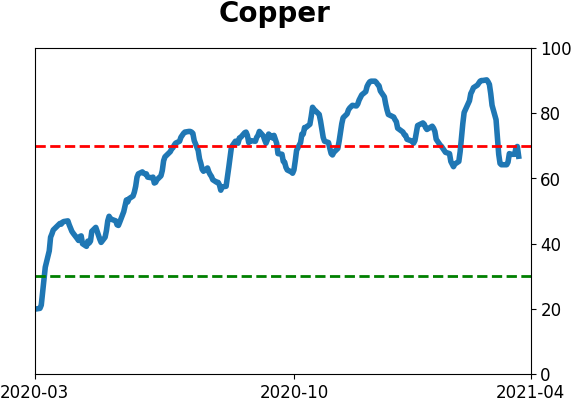
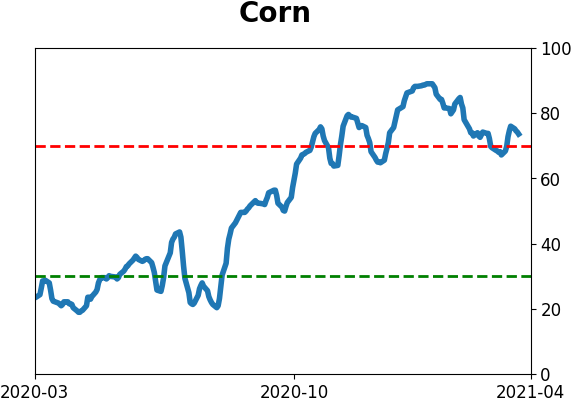
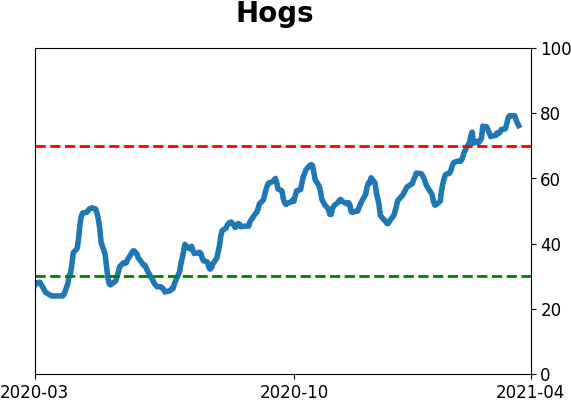
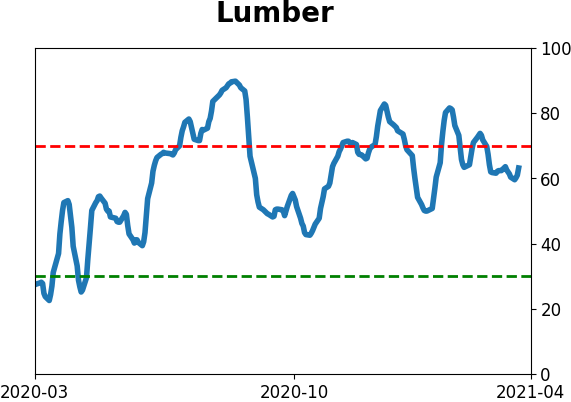
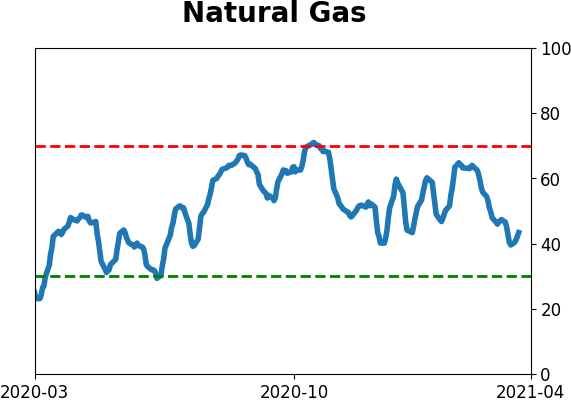
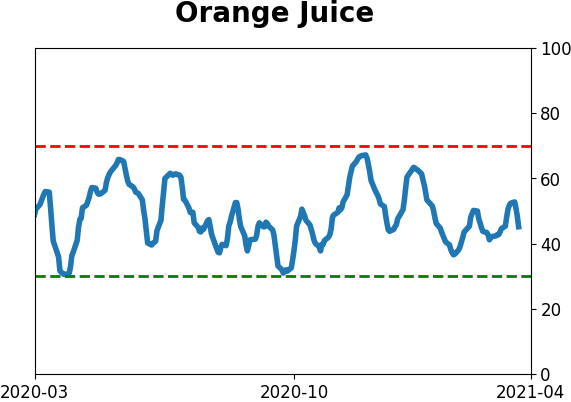
Commodity ETF's - 5-Day Moving Average
|
|