
If Bonds Don't Bounce...

In this article I highlighted the widely known fact that bonds have been in a bull market for almost 40 years following the top - and subsequent decline - in interest rates starting in the early 1980's. The big argument now is whether or not that trend has ended with the recent uptick in interest rates - and if not, when will it end?
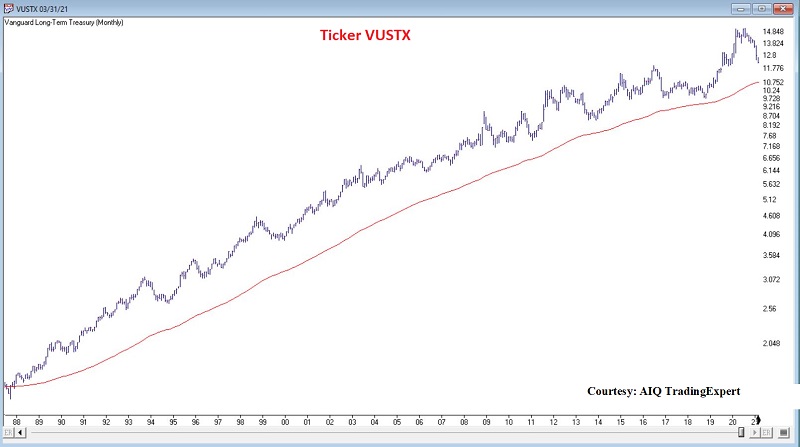
The chart below is a logarithmic chart of ticker VUSTX (Vanguard Long-Term Treasury Fund) with a 120-month exponential moving average. During the past 40 years - with interest rates in a sustained decline - virtually every dip in bond prices presented a buying opportunity for patient investors.
But what about now? Well, we may get an important clue in the weeks ahead as a fairly useful oversold indicator is ostensibly flashing green at the moment. Does this mean bonds are destined to stage another rally? Maybe, maybe not. But here is what bond action in the weeks ahead will likely tell us:
- If bonds DO rally in the weeks and months ahead then arguably the long-term bullish trend in bonds remains intact
- If bonds DO NOT rally in the weeks and months ahead - i.e., if the oversold indicator discussed below proves meaningless - then that will be a significant clue that for bonds "the times they are a changin"
The 30-Week Up/Down Indicator
In all candor this is something of a rudimentary indicator. But sometimes simple is best. This 30-week weekly version is essentially a knockoff of an indicator I learned from Tom McClellan at McClellan Oscillator that uses 20 trading days instead.
A = Weekly change in VUSTX
B = If A > 0 then 1 else 0
C = Sum of all B values for the last 30 weeks
D = C - 15
30WeekUpDown = D
I subtract 15 so that the indicator oscillates above and below 0. In other words, if 15 days closed up and 15 days closed down then the 30WeekUpDown indicator would read a neutral 0. In theory, the higher the value the more overbought the long-term treasury market and the lower the value the more oversold the long-term treasury market.
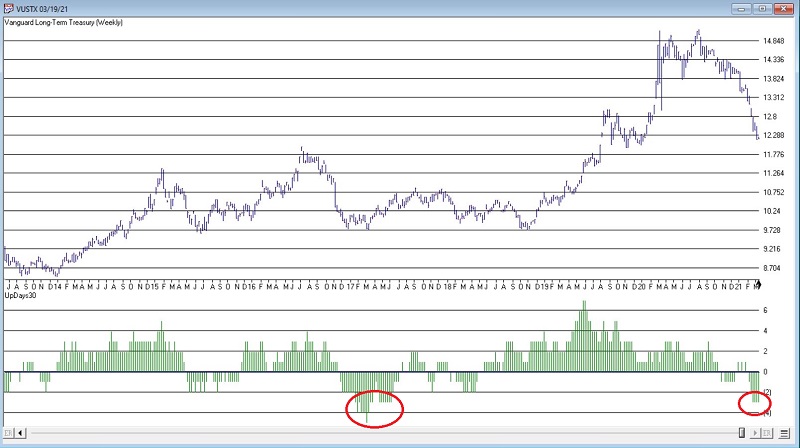
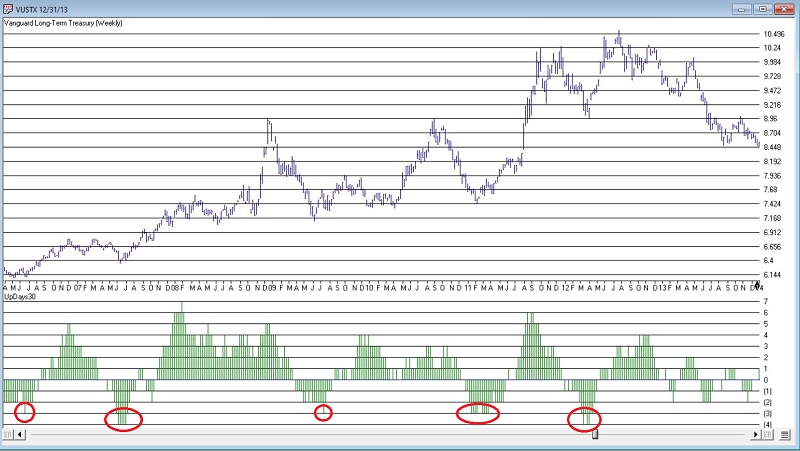
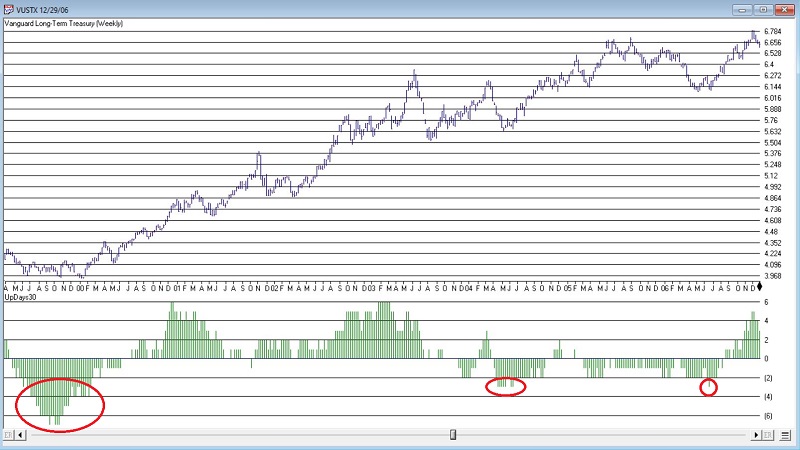
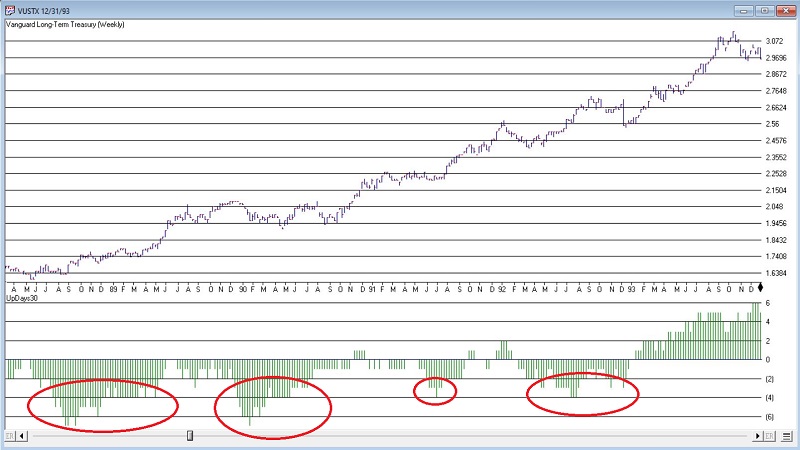
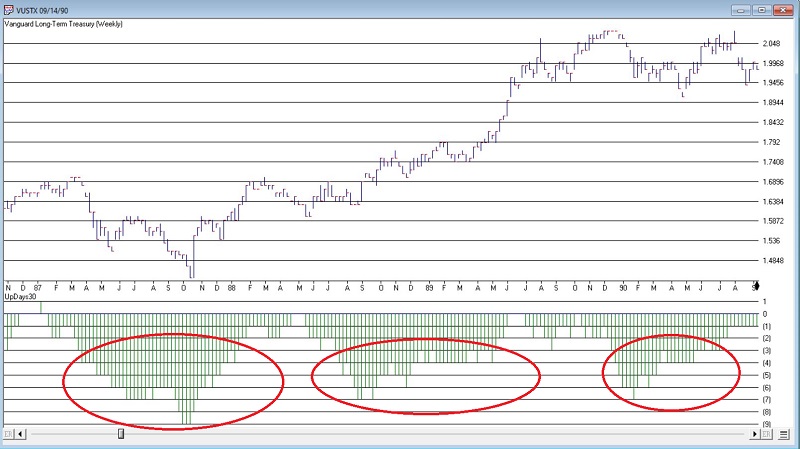
There is no "magic number" but as a default I use -3 as a sign of an "oversold" bond market - i.e., one that "should" rally (if in fact the overall trend is bullish). The charts below shows the previous times when 30WeekUpDown dropped to -3 or lower since 1987. All charts below are courtesy of AIQ TradingExpert.
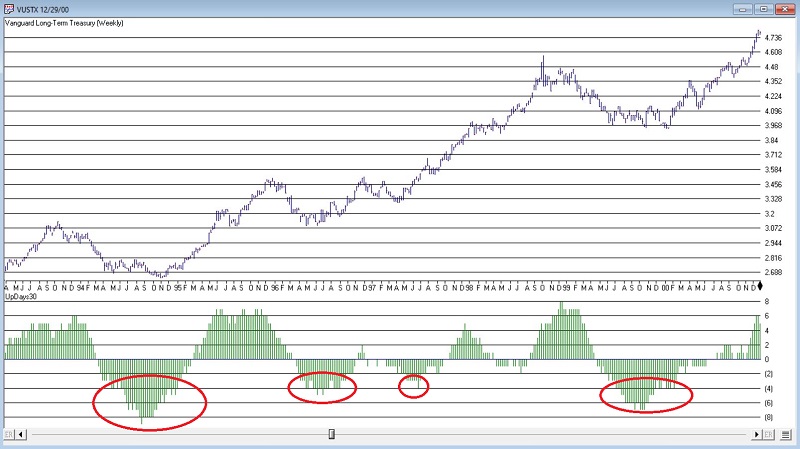
Since 1987 there have been 1817 weeks. 298 of those (16%) weeks ended with 30WeekUpDown at -3 or lower. The table below displays the average performance following all such weeks (including overlaps).
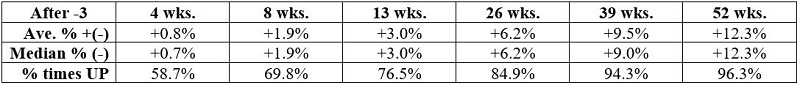
Summary
By this objective measure the long-term treasury bond market is oversold. The big question is "what does this mean for bonds going forward."
- If bonds reverse and rally in a meaningful way in the weeks and months ahead it may tell us that the widely predicted demise of the bond bull market was premature
- On the other hand, if bonds fail to rally, or offer only a muted half-hearted rally, or even worse, continue to break significantly lower - it may be another nail in the coffin of arguably the longest bond bull market in history
Now is the time to be paying close attention to what the bond market wants to tell us.