
Bonds Monthly Jekyll and Hyde Routine

There are a lot of eyes on the bond market lately, and for good reason. The big question on investors minds is whether the recent decline in treasury bond prices is just another pullback in an ongoing bull market or the beginning of a major reversal (for some ideas of clues to watch for read Jason's piece here and mine here).
While most investors are aware that bonds have been in a bull market for along time, most are not aware of the fairly consistent monthly dichotomy in performance. The chart below displays the cumulative hypothetical price return from holding ticker TLT (iShares 20+ Year Treasury Bond ETF ) ONLY during the first 9 trading days of every month since the ETF started trading in 2002.
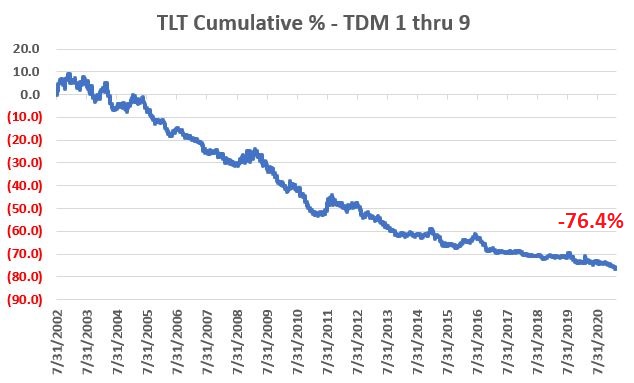
There clearly was no bull market going on during that time of month.
The chart below displays the cumulative hypothetical price return from buying ticker TLT at the close of trading day of the month #9 and selling at the close on the last trading day of the month - also every month starting in 2002.
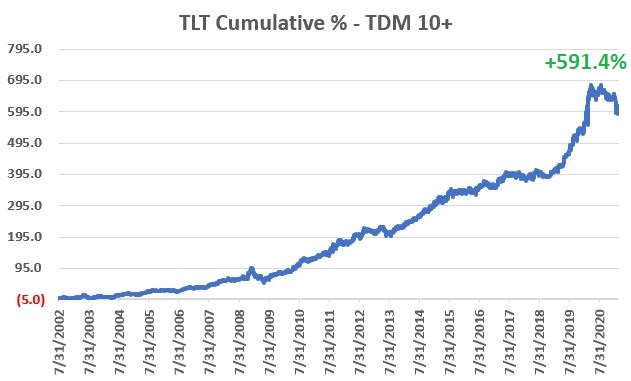
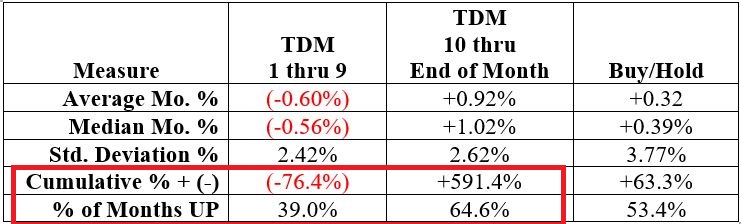
The difference in performance is essentially impossible to miss. The table below spells out the differences in numerical format.
Will this stark difference in performance persist? It's hard to know. But if you are thinking about a long or short position in t-bonds you might want to check your calendar before placing that trade.