
IPO mania continues, with a caveat

One of the most visible and discussed aspects of the current welcoming environment for investors is the plethora of new offerings. Whatever form they take, whether blank-check companies or traditional investment bank-led, we've never seen the market absorb so much in new shares.
According to Bloomberg data, there has now been $114 billion in U.S. initial public offerings that were priced over the past 12 weeks.
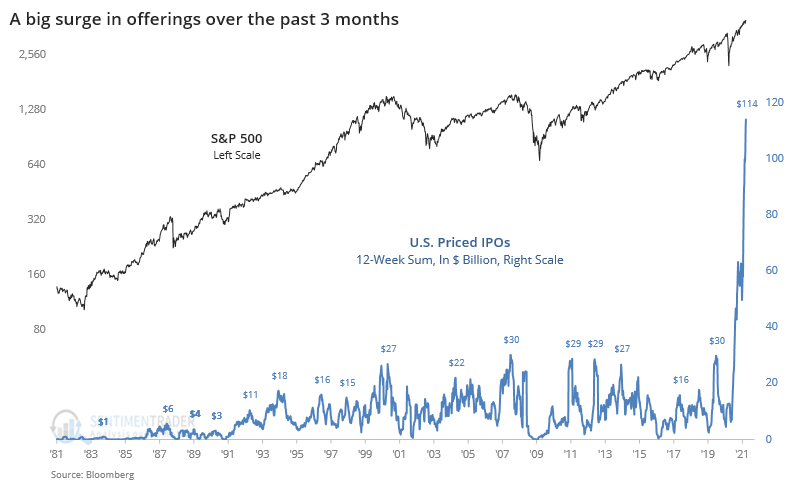
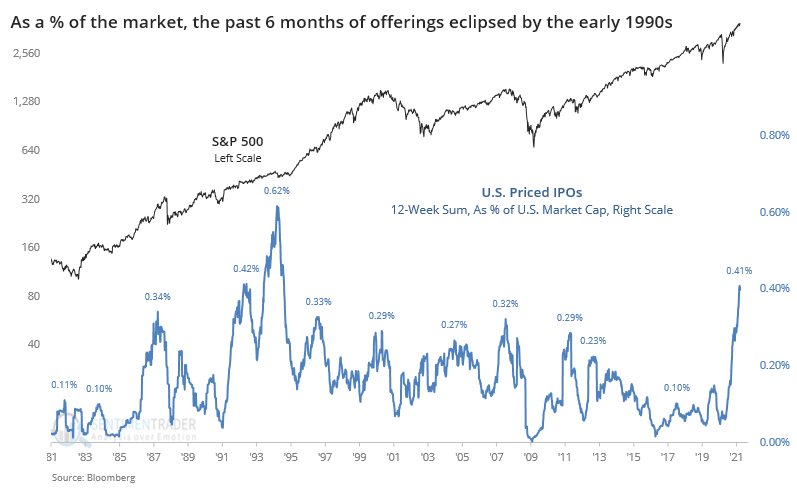
The parabolic nature of the chart looks just as egregious over a 6-month time frame.
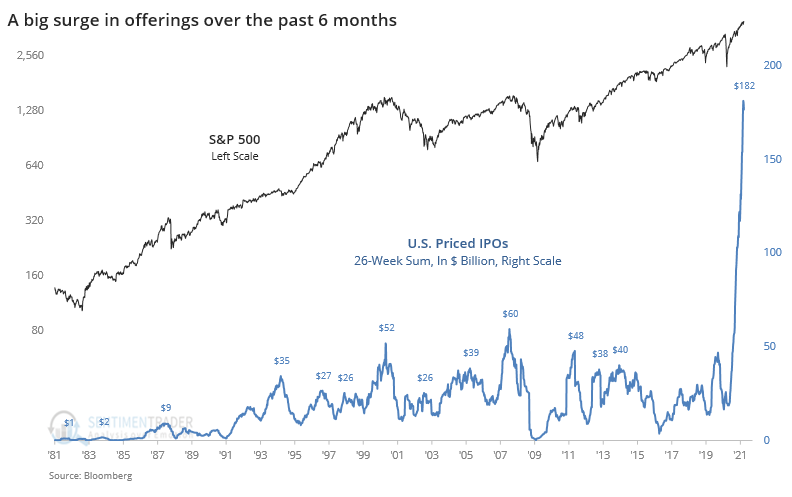
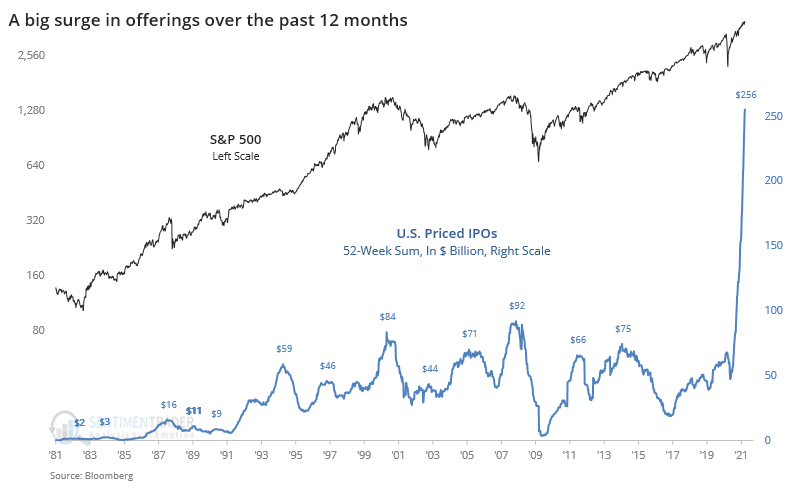
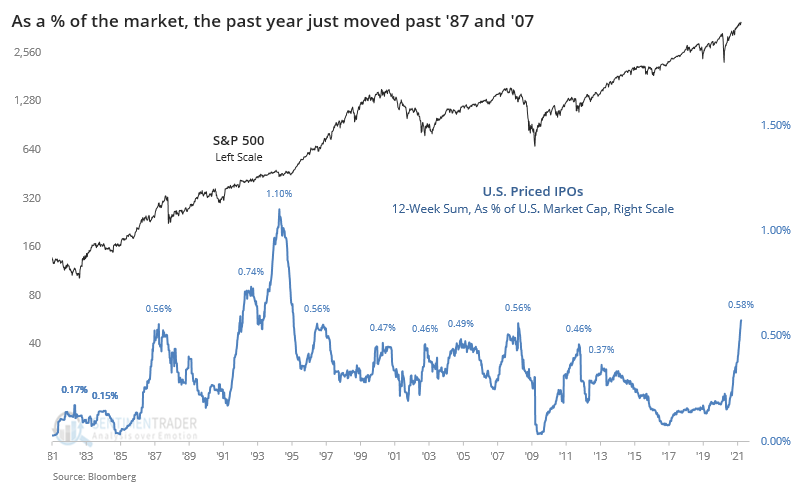
And over the past year with $256 billion in offerings compared to a previous high of $92 billion in 2007 and $84 billion in 2000.
As we've discussed before, though, those are all distorted due to the larger size of the market for stocks. When we account for that, the current extreme shows quite a bit of shrinkage. At 0.26% of the entire market capitalization of U.S. stocks, this is the most in more than 25 years, but below the peak in the early 1990s.
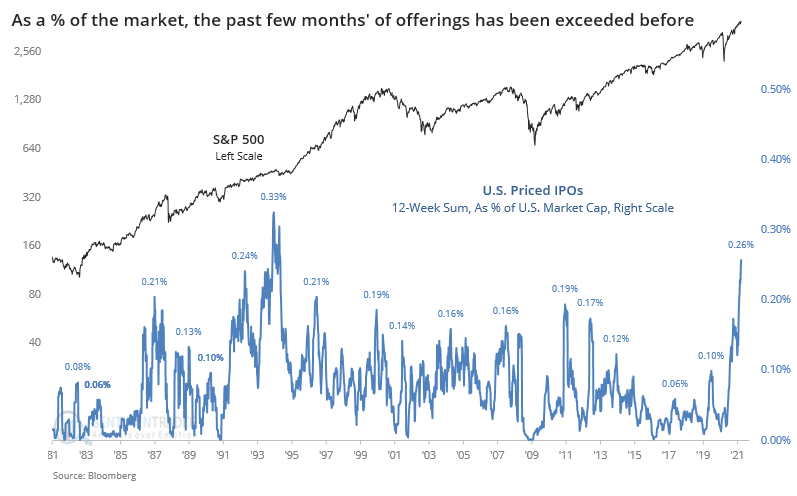
It becomes a little more clear when using a 6-month time frame, but with the same general conclusion.
Over the past year, the current surge just eclipsed the extremes from 1987 and 2007 but still remains well below the early 1990s.
There are more salient worries about these offerings, like the average age of a company going public (again, thanks to SPACs) the pop that they've enjoyed when hitting the market, and how many of them are losing money. The sheer number and size of new issues is certainly extreme, but it took quite a while before that mattered to the market in the mid-80s and early 90s.