Headlines
|
|
Weekly Wrap for Mar 12 - Value storms back, with a volatile tech sector:
The week saw more signs of speculative activity, even though it remained split to some degree. Value stocks have stormed back and triggered signs that typically preceded further gains. Tech stocks suffered a quick correction, and high-yield bonds became oversold.
The latest Commitments of Traders report was released, covering positions through Tuesday: The 3-Year Min/Max Screen shows that "smart money" commercial hedgers didn't establish any new extremes of note this week. Mostly, they modestly reversed prior extremes. In gold, they covered enough short positions to hold the fewest contracts net short (including as a % of open interest) since June 2019. Still, they're holding a significant short position. They also start to cover some shorts in soft commodities, but their total short position in agricultural contracts remains near a record. In fixed income, they whipsawed from a near-record net short position in 2-year Treasuries to a near-record net long position, but this has been an inconsistent predictor for future returns. Hedgers reduced their position in stocks to a near-neutral position. In the VIX, they reduced some of their net long but still hold over 35% of the open interest net long, which is typically a sign that the VIX will rise.
Bottom Line:
See the Outlook & Allocations page for more details on these summaries STOCKS: Weak sell
The extreme speculation registered in January and February is starting to get wrung out. Internal dynamics have mostly held up, so a return to neutral sentiment conditions would improve the forward risk/reward profile substantially. We're still a ways off from that. BONDS: Weak buy
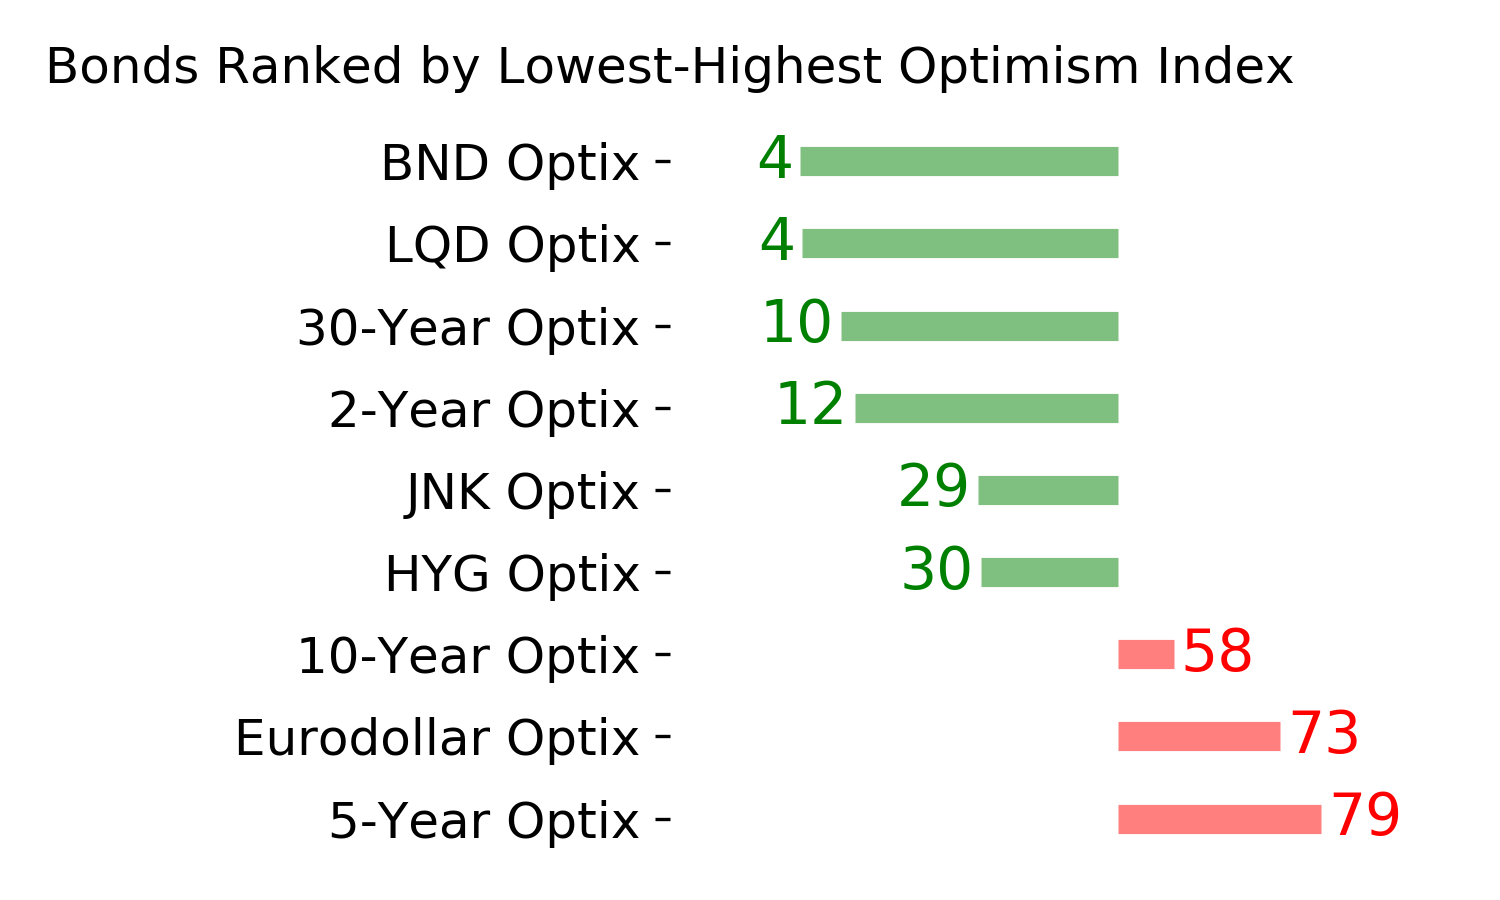
Various parts of the market have been hit in recent weeks, with mild oversold conditions. The Bond Optimism Index is now about as low as it gets during healthy bond market environments. Fixed income isn't responding well, so that needs to be monitored in case it's transitioning to a longer-term negative market environment. GOLD: Weak buy
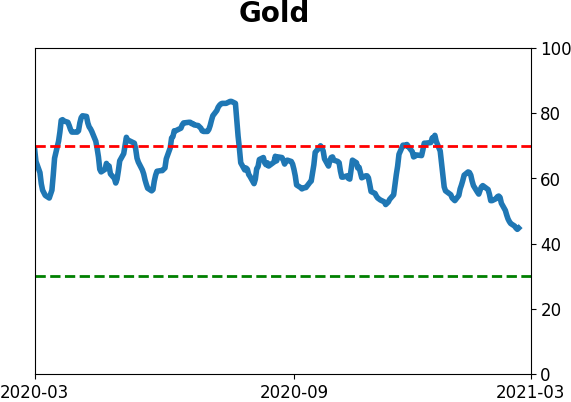
A dollar trying to rebound from a severe short position has weighed on gold and miners. The types of signals they've given in recent weeks, within the context of their recent surge, have usually resulted in higher prices over a medium- to long-term time frame. Like bonds, gold and miners aren't responding very well, and this needs to be monitored.
|
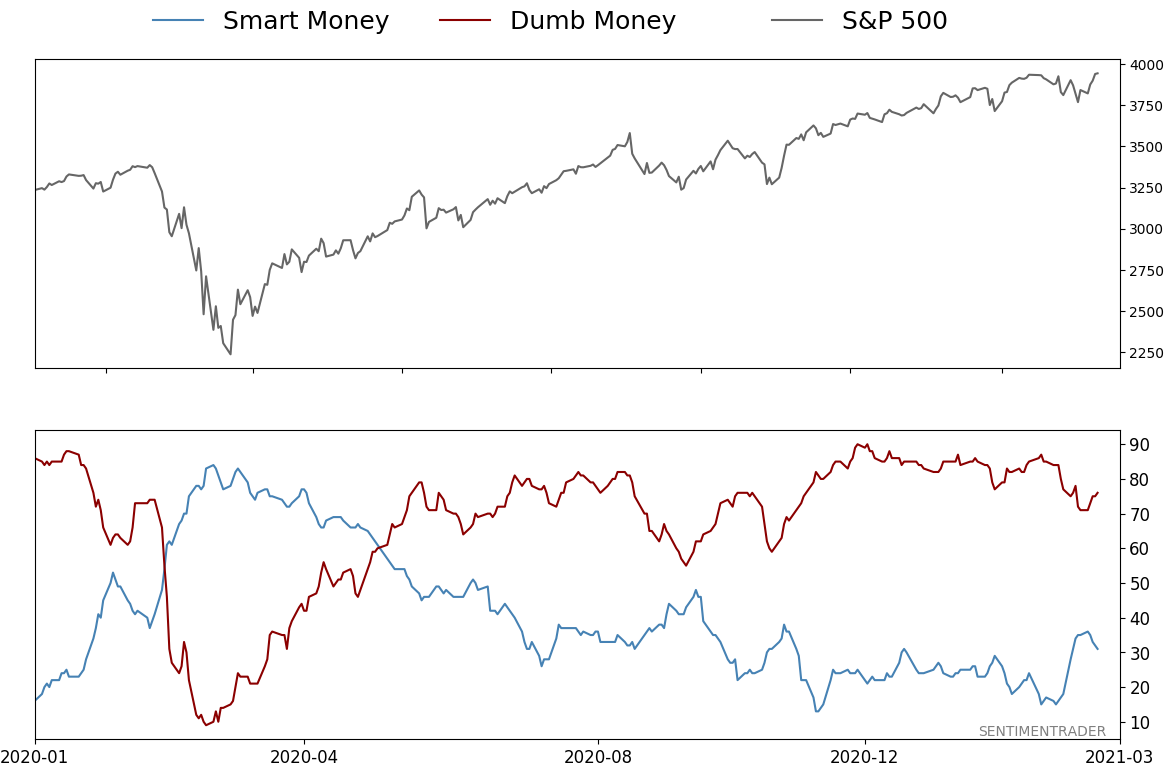
Smart / Dumb Money Confidence
|
Smart Money Confidence: 31%
Dumb Money Confidence: 76%
|
|
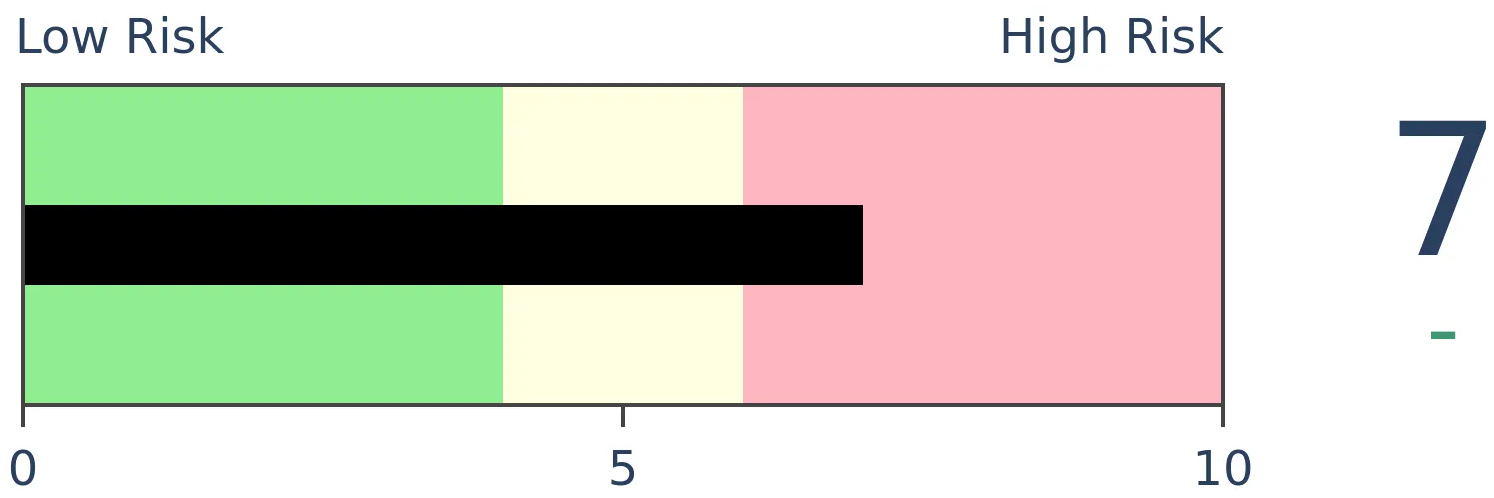
Risk Levels
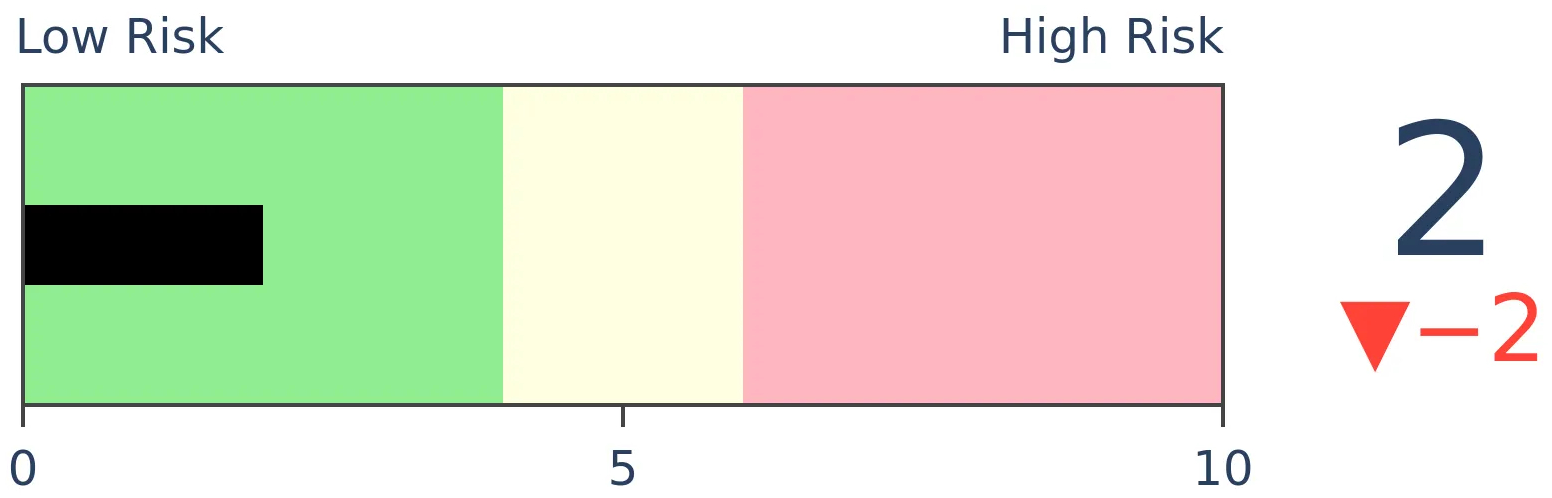
Stocks Short-Term
|
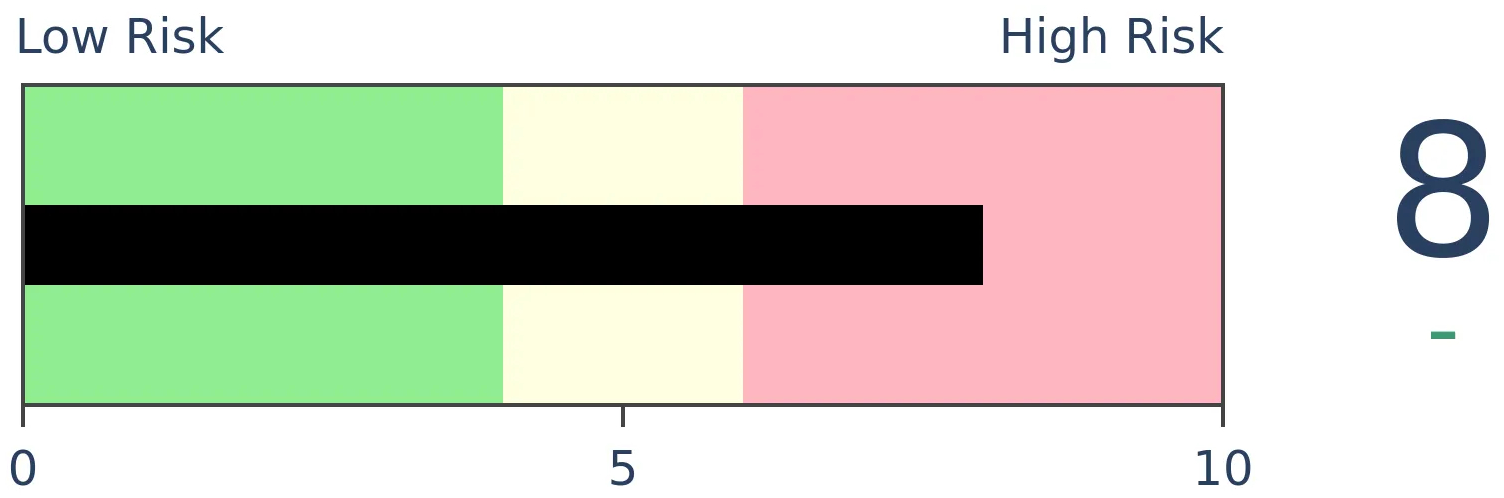
Stocks Medium-Term

|
|
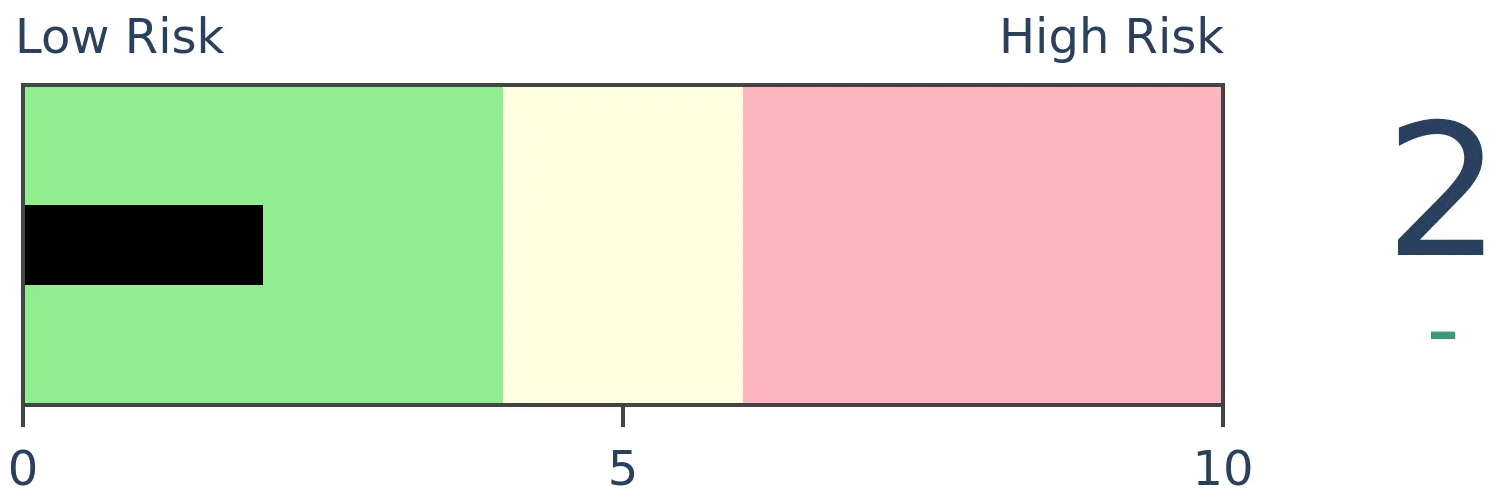
Bonds
|
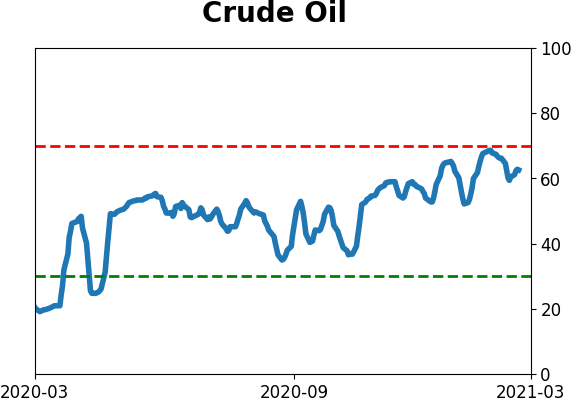
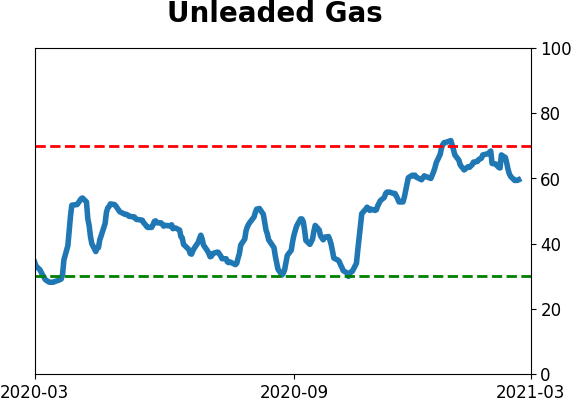
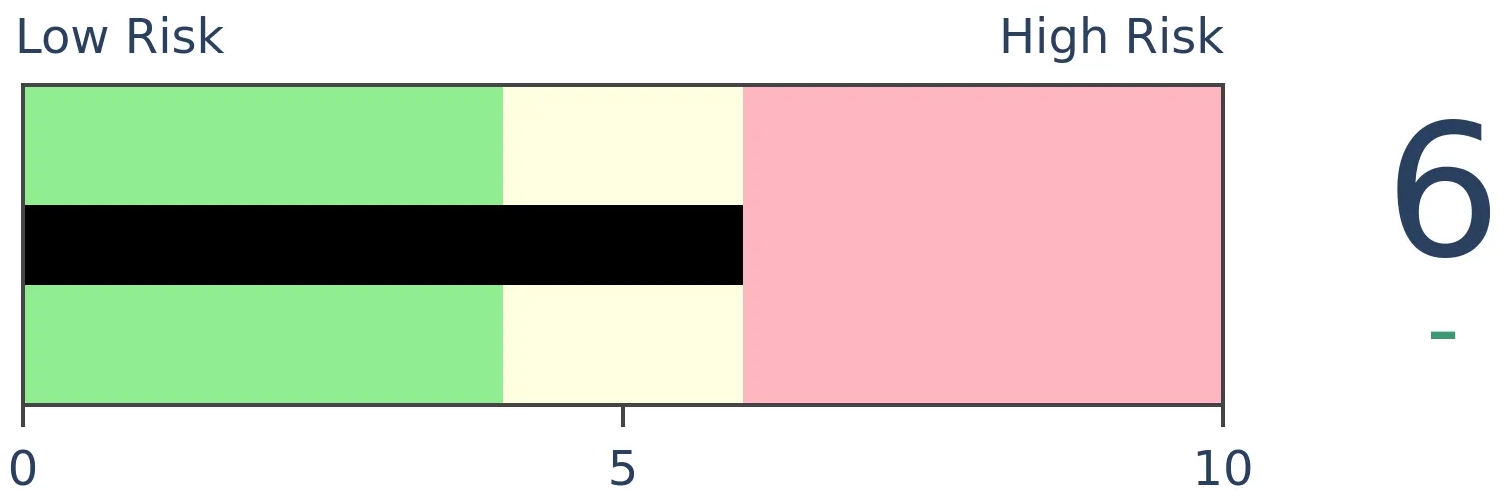
Crude Oil
|
|
Gold
|
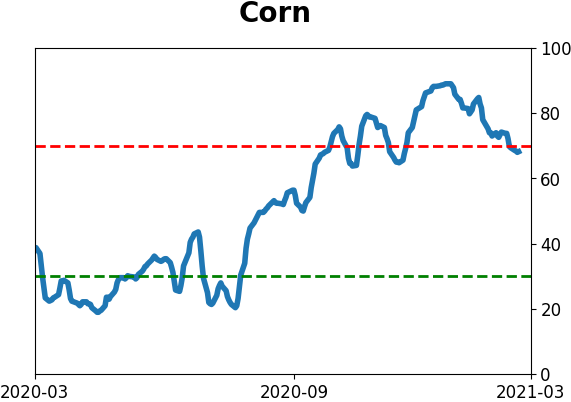
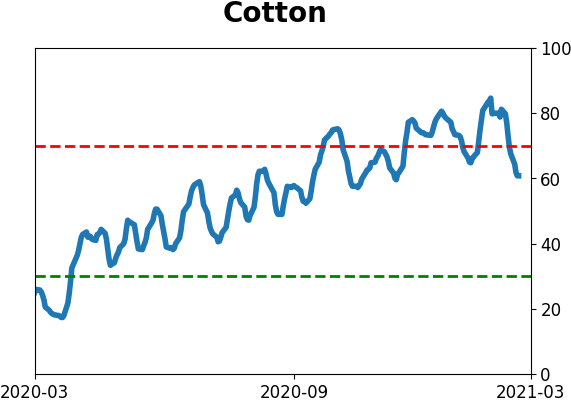
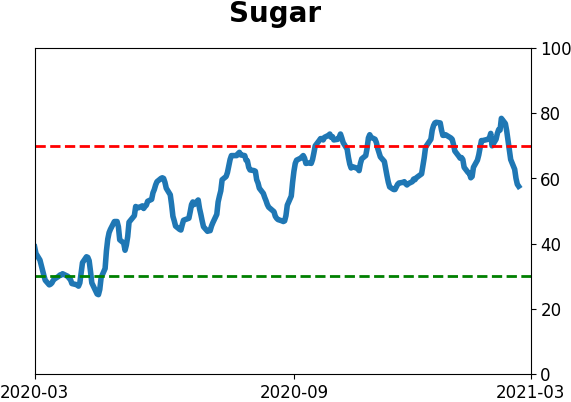
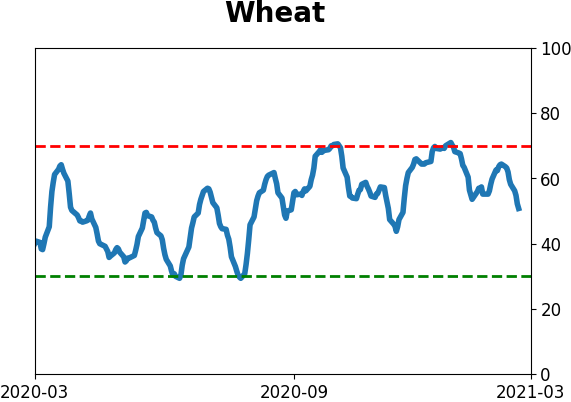
Agriculture
|
|
Research
BOTTOM LINE
The week saw more signs of speculative activity, even though it remained split to some degree. Value stocks have stormed back and triggered signs that typically preceded further gains. Tech stocks suffered a quick correction, and high-yield bonds became oversold.
FORECAST / TIMEFRAME
None
|
The goal of the Weekly Wrap is to summarize our recent research. Some of it includes premium content (underlined links), but we're highlighting the key focus of the research for all. Sometimes there is a lot to digest, with this summary meant to highlight the highest conviction ideas we discussed. Tags will show any related symbols and time frames related to the research.
A few times last week, we looked at the "split" in the market between winners and losers. It continued earlier this past week, highlighted by the HiLo Logic Index.
Over a 5 day span, the HiLo Logic Indexes on both the NYSE and Nasdaq averaged a very high reading. In recent years, this has had a mixed record, roughly preceding 3 rallies and 4 declines. Generally, if it was going to matter, then it mattered right away.
Over a long time frame, the Backtest Engine shows that anytime the NYSE figure averaged more than 2.5 over a week, forward returns were very poor. The test includes only those times when the S&P 500 was above a rising 200-day moving average at the time.
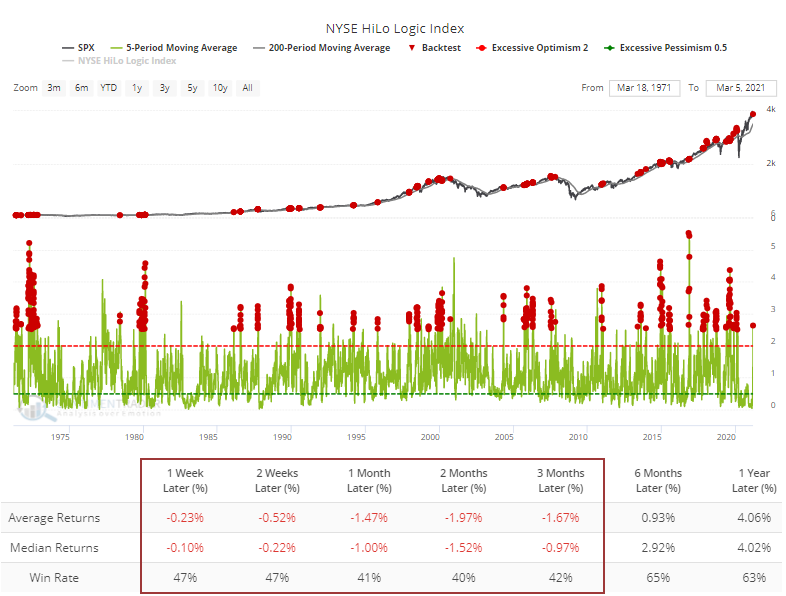
The same can be said for the Nasdaq, which showed an even larger split.
We rate these splits as a negative, with the modest caveats that it's being heavily influenced by one particular corner of the market, and it was preceded by very healthy internal conditions.
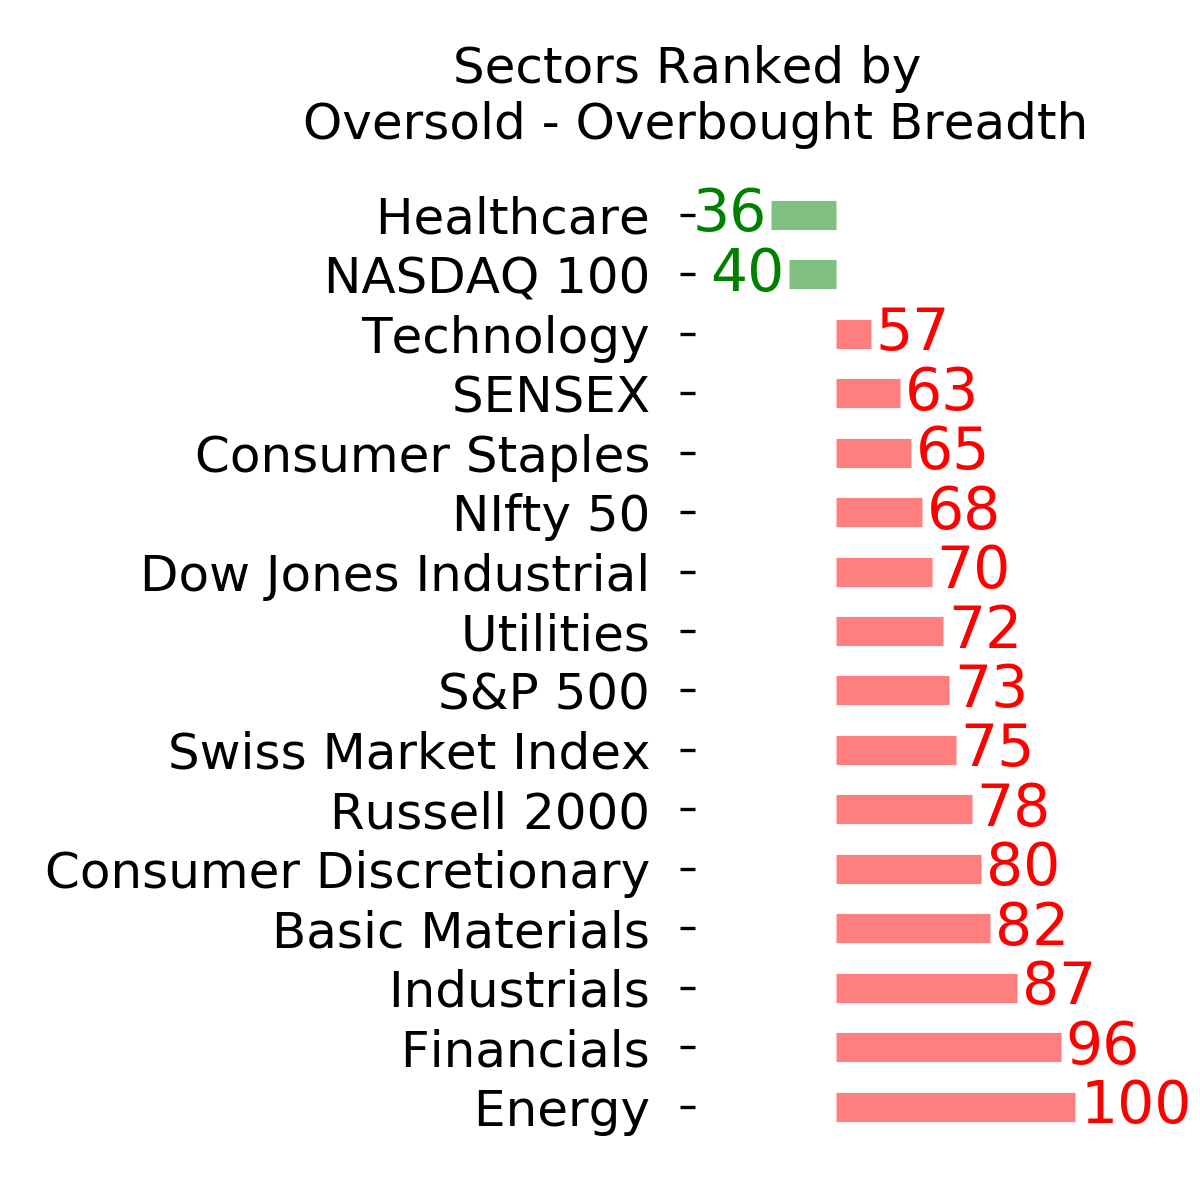
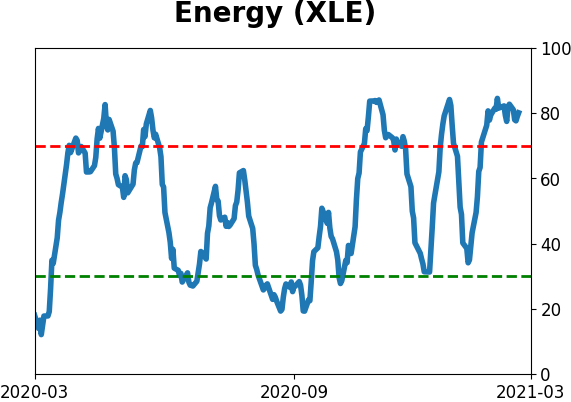
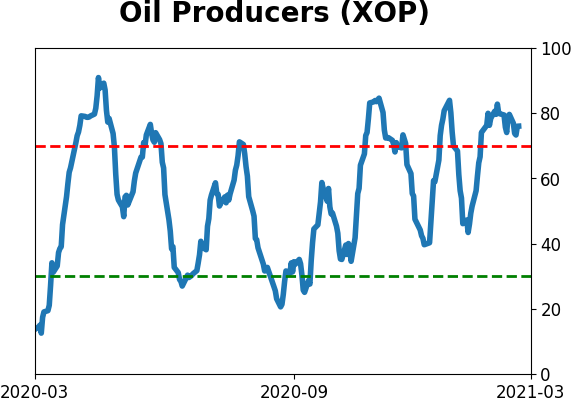
Dean took a very in-depth look at the surge in energy stocks. They've thrusted higher on a relative and absolute basis, accompanied by some of the strongest internal breadth in history, with a breadth composite model for large-cap energy issues recently registering the highest reading since 2006.
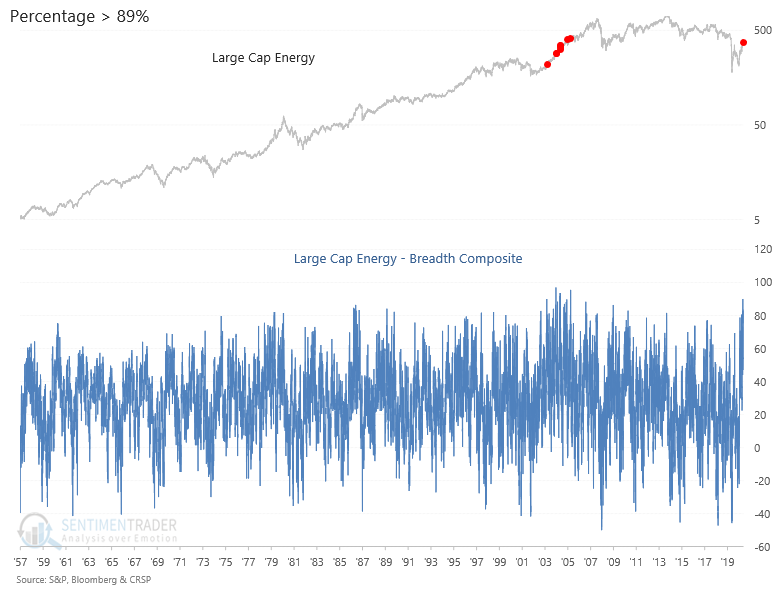
The energy sector is exhibiting strong absolute and relative performance with one of the better risk/reward profiles in a long time, though it is a volatile sector.
All of these shifts have triggered a massive move in Value stocks relative to Growth. Over a rolling 1-month period, the total return on value is more than 10% greater than the total return on growth, one of the largest spreads in 30 years.
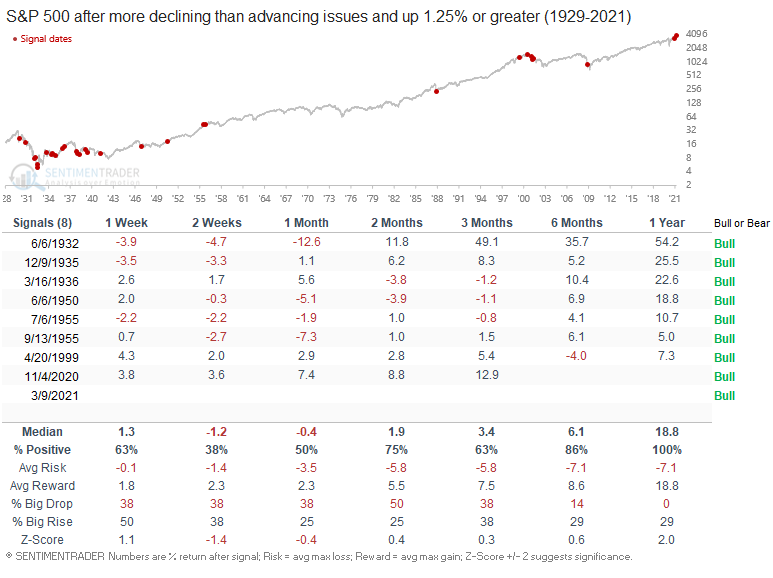
The table below shows every time since 1928 when the total return on Value stocks over a rolling 21-day period was more than +5%, while the total return on Growth stocks was less than -5%.
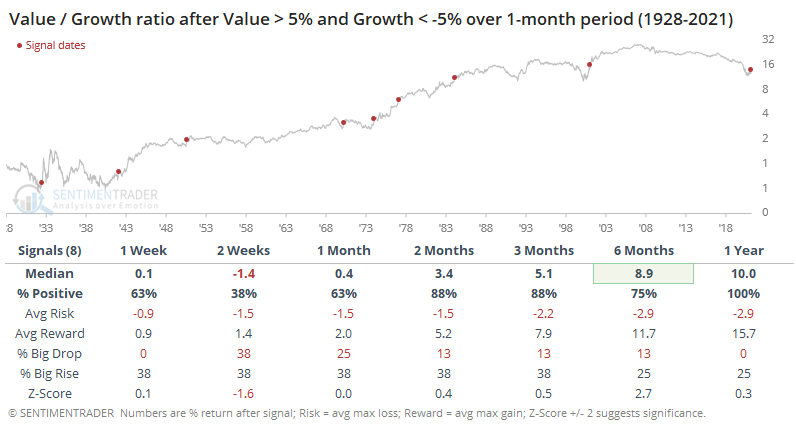
There was some back-and-forth in the shorter-term. Other than that, there was a clear and increasing bias toward Value.
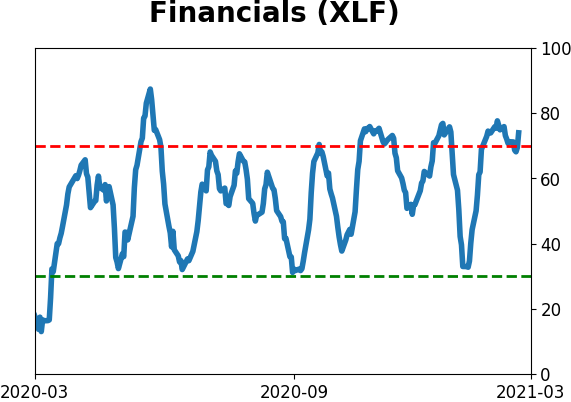
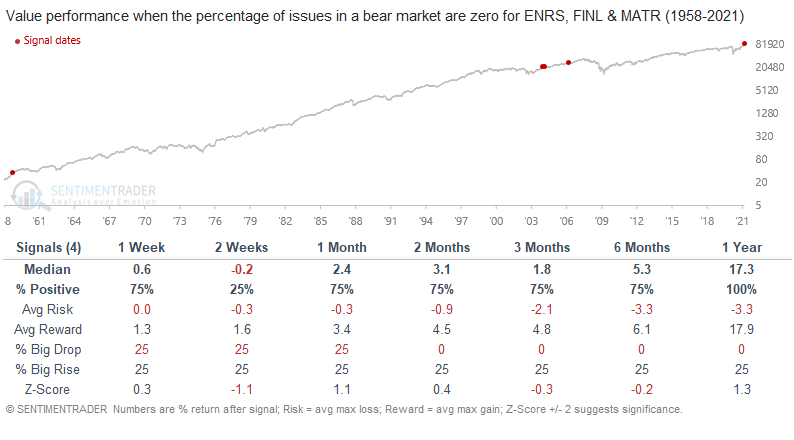
The move toward value stocks was powerful enough that for the 1st time in 14 years, not a single Energy, Financial, or Material stock was more than 20% below their highs. Dean showed how rare this is, with the few other signals preceding good longer-term gains for Value.
 Dean also took a longer-term and more in-depth look at this rotation. The 126-day rate of change spread between value and growth crossed above 20% on Monday. Before the current signal, one has to go back over two decades to find the last cross in November 2000.
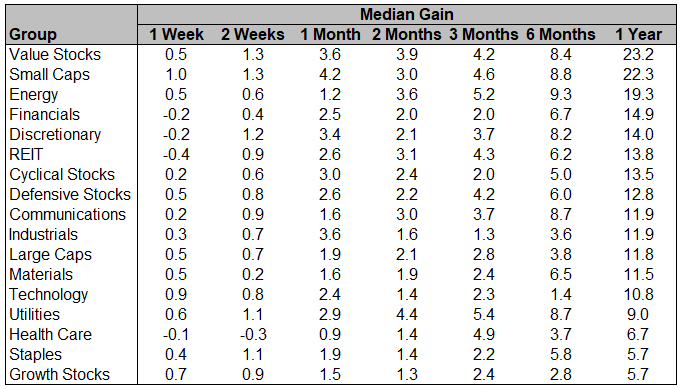
That meant good things for value, and also some other sectors / factors. He showed the following table, using total return data, that highlights the returns following other 6-month surges in Value vs. Growth stocks. Value, Small-Caps, and Energy were the strongest performers.
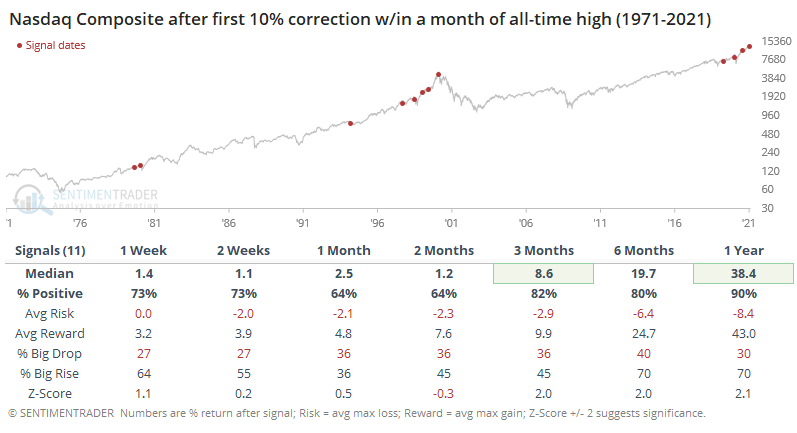
Part of the reason for the rotation was due to tech stocks getting pounded. By early in the week, the Nasdaq suffered a quick correction. With rare exceptions, this did not lead to poor forward returns, so something of a solace there.
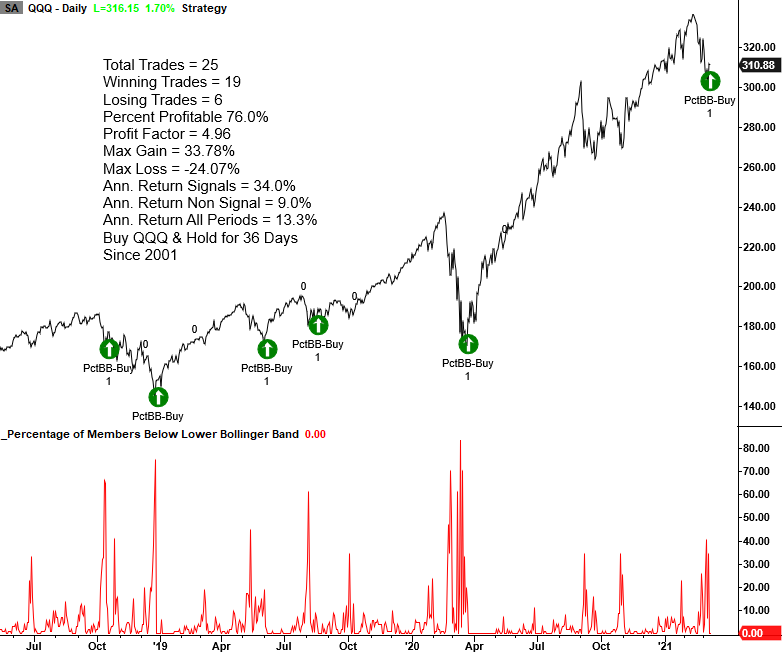
Also, Dean showed that the percentage of Nasdaq 100 (QQQ) members trading below their respective lower Bollinger Band registered a mean reversion buy signal on the close of trading on Wednesday. The signal identifies times when a large number of stocks fell below their lower volatility bands, and then rebounded, with QQQ showing positive momentum.
Other times this triggered, QQQ had a strong tendency to hold the rebounds for the next 1-2 months, so that's at least a minor positive for tech from here.
Jay looked at the boogeyman on everyone's lips nowadays - inflation.
The bottom line is that "Everybody Knows" that inflation - possibly of the significant kind - is just around the corner. Of course, there are at a minimum two potential problems here:
- Conventional wisdom doesn't always turn out to be correct
- Beyond all the fear and loathing what does a rise in inflation really mean for the markets?
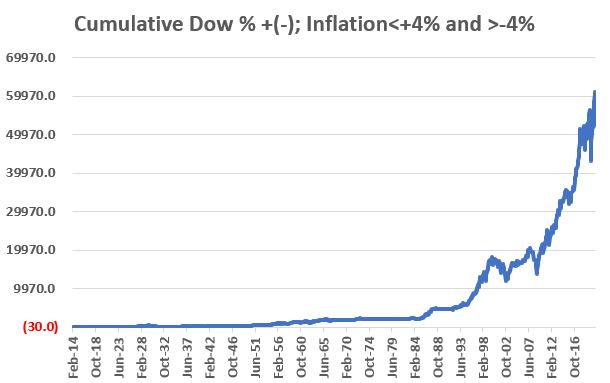
After taking a look at definitions, Jay showed that the best 40-year rolling return in the Dow just happened to coincide with a low-inflation environment.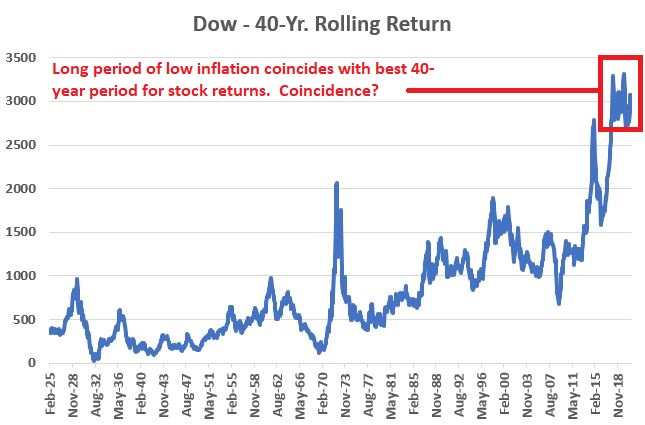
In Part II, Jay showed the Dow's performance during those months when inflation is in the "Not too hot, not too cold" range of above -4% but below +4%. The chart below displays the cumulative price performance for the Dow during these times.
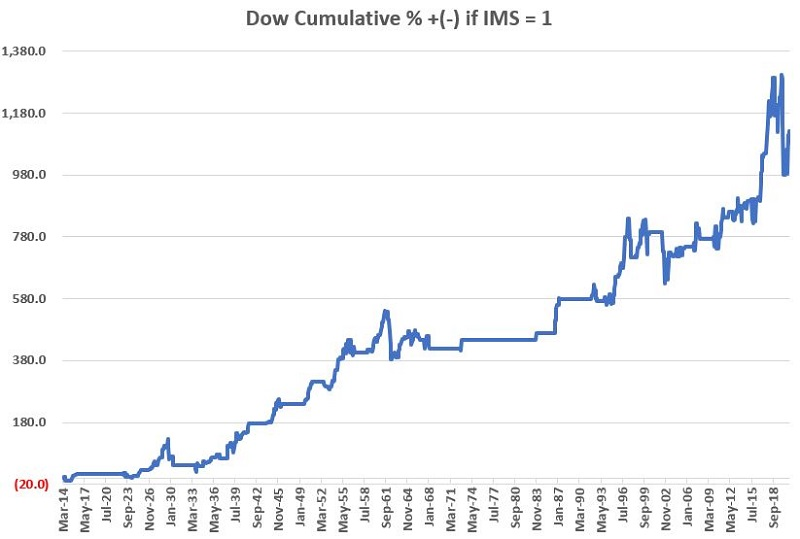
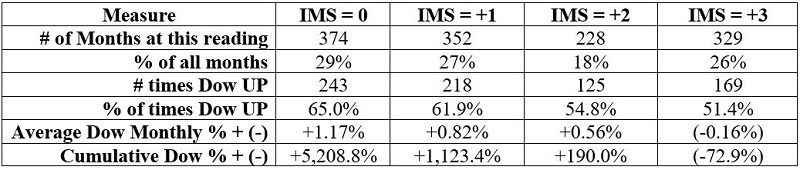
In Part III, he outlined an Inflation Model for Stocks (IMS) that showed a stark difference in returns in the Dow Industrials based on various inflation regimes. The best returns occurred when the model was equal to 0, but anything below +3 far outperformed those times when the model was greater than +3.
Currently, it's at +1, which has preceded some nasty drawdowns but still showed an overall positive bias.
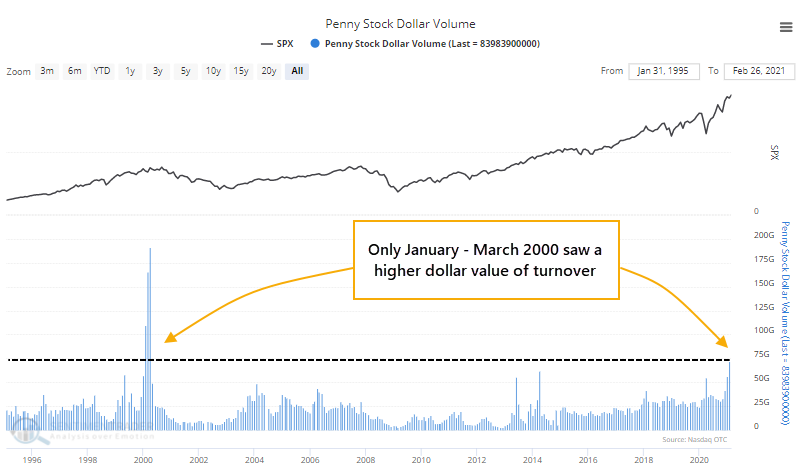
Over the past couple of months, we've been raising the alarm on several pockets of speculative activity, which had reached or exceeded all prior records. The latest figures are out, covering activity through the end of February, and it shows an increasing willingness to trade the riskiest securities available to individual investors.
The number of shares traded has jumped to nearly 2 trillion shares and dollar volume traded rose to nearly $84 billion, the highest in the past decade. Going back nearly 30 years, February's activity was only exceeded by January - March of 2000. This is still highly troubling.
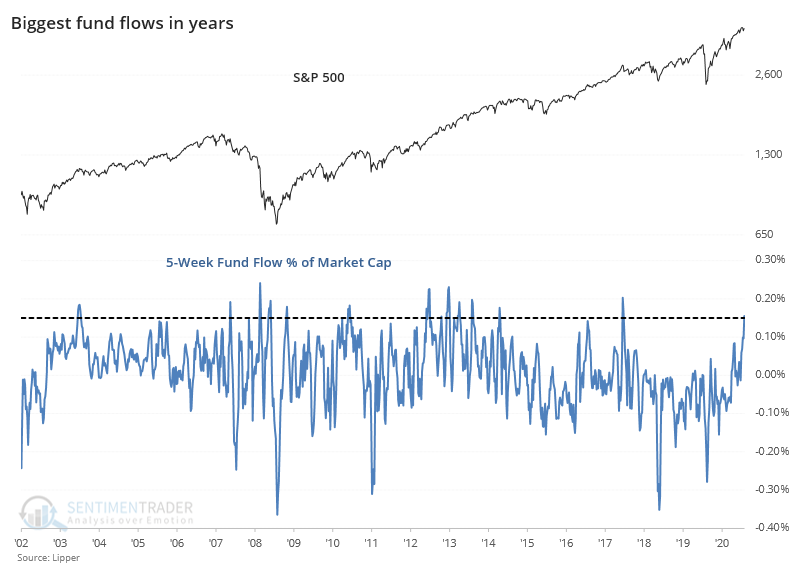
The pullback in stocks didn't deter fund investors. Over the past 5 weeks, they've shoveled more than $67 billion into equity mutual funds and ETFs, a record high. As a percentage of U.S. stock market cap, it's the 2nd-highest in 5 years.
Also a bit troubling is that Dean noted that on the snapback on Tuesday, breadth in the S&P 500 was unusually weak.
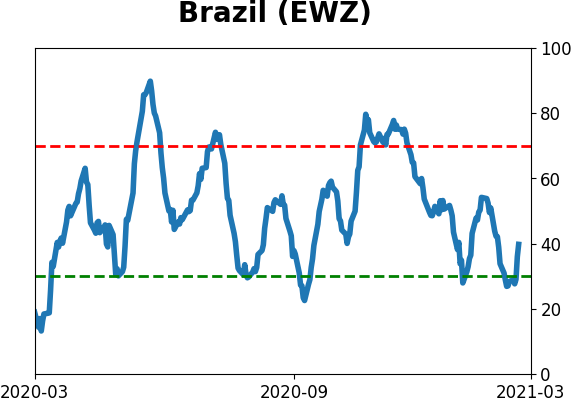
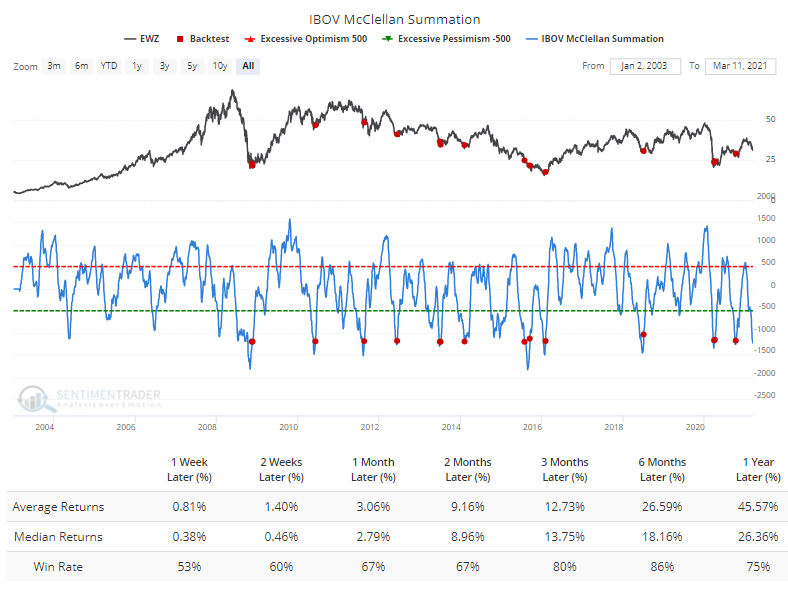
In other corners of the market, last week we touched on some oversold signals being generated in Brazil's Ibovespa index. Now that those stocks are recovering a bit, the McClellan Summation Index will likely curl up from below -1200, one of its most severe oversold readings in nearly 20 years.
This has been a very good medium- to long-term sign, with an average 6-month gain of more than 20% per the Backtest Engine.
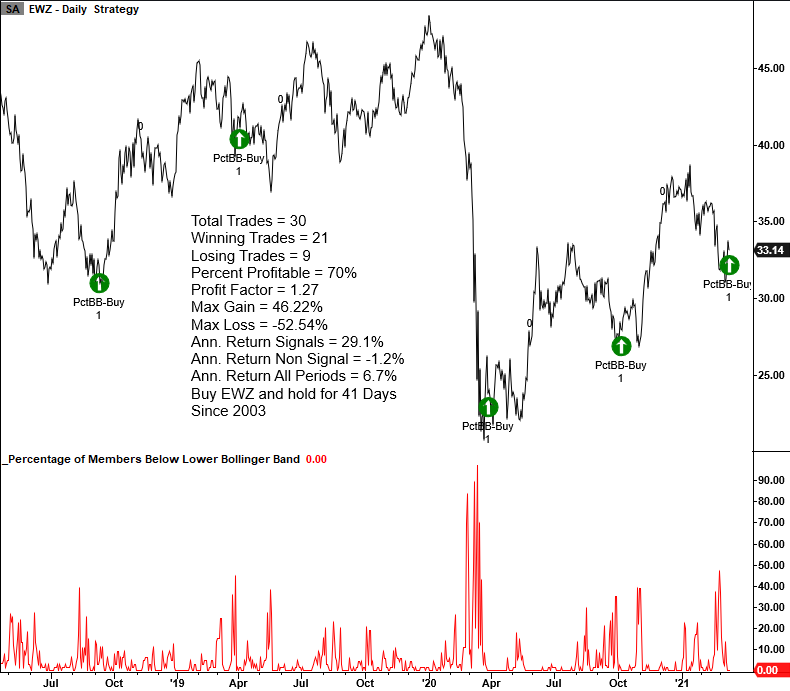
They also triggered a potential positive volatility band signal, like the Nasdaq did, but the success rate wasn't as good, Dean notes.
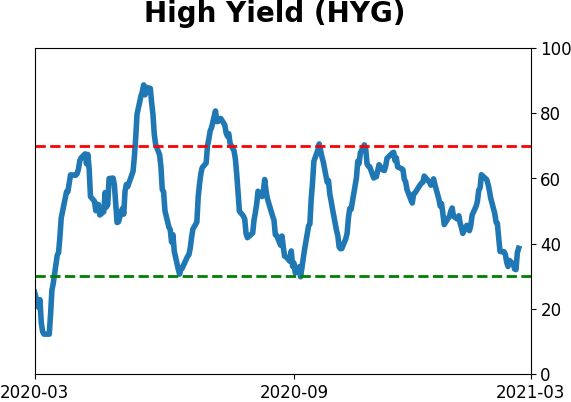
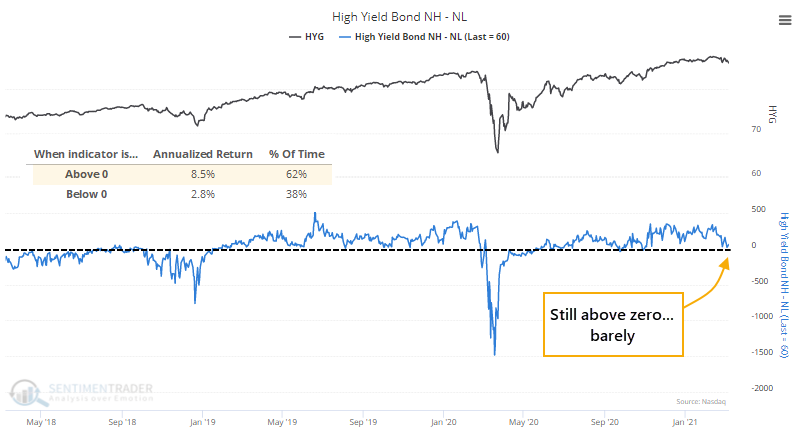
Bonds of all stripes had been getting hit in recent weeks, and the stress is starting to show in some of the measures we follow for the high-yield corner of the market.
One of the primary ways to determine the internal health of the junk bond market is simply whether more bonds are hitting 52-week highs or lows. A net New High - New Low reading above zero is good; below zero is bad. It's still good for now but has been flirting with that zero line.
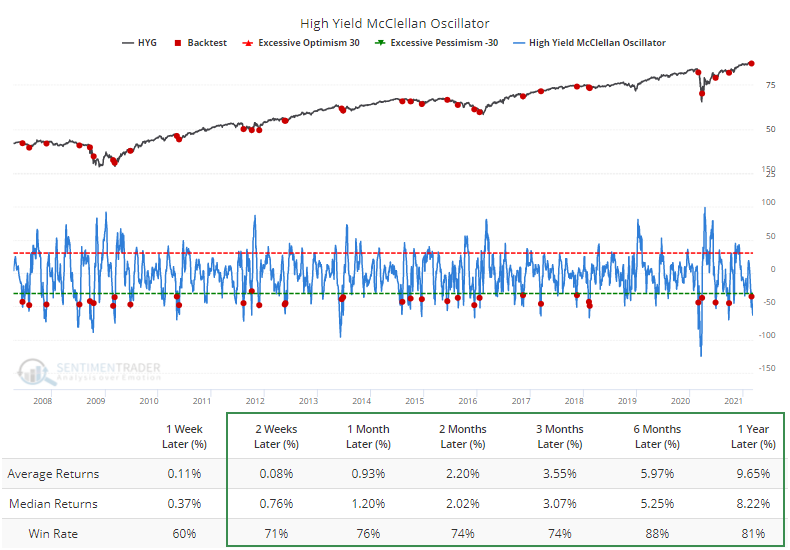
This internal selling pressure has pushed the McClellan Oscillator for high-yield bonds down to a very oversold level. Again, when this reverses up from a low level, the Backtest Engine shows that HYG has typically rallied further.
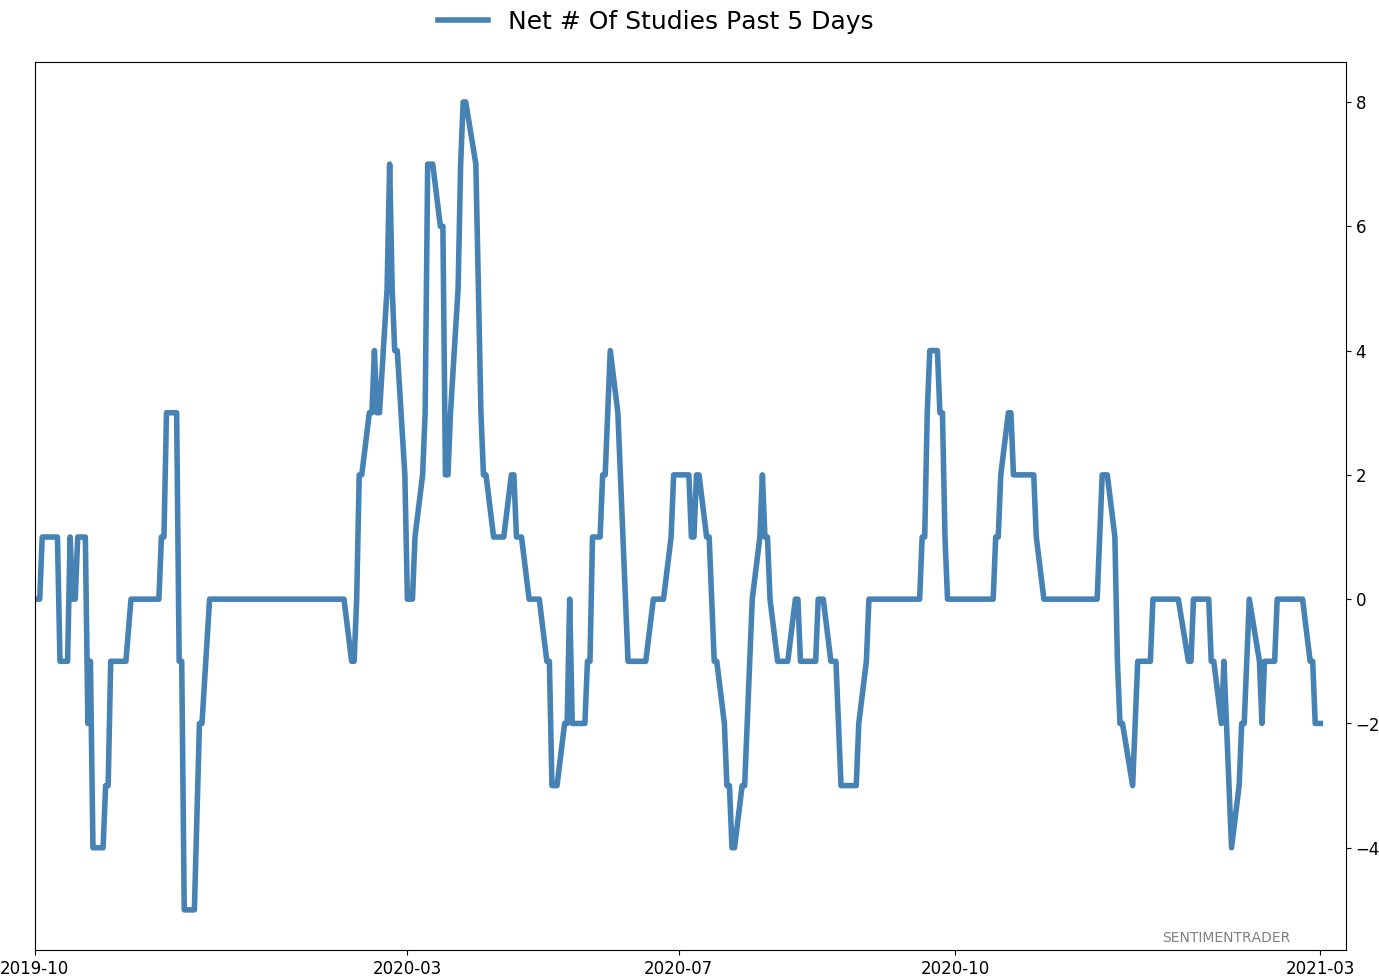
Active Studies
| Time Frame | Bullish | Bearish | | Short-Term | 0 | 0 | | Medium-Term | 2 | 9 | | Long-Term | 16 | 4 |
|
Indicators at Extremes
Portfolio
| Position | Description | Weight % | Added / Reduced | Date | | Stocks | RSP | 4.9 | Reduced 4% | 2021-02-09 | | Bonds | 30.0% BND, 8.8% SCHP | 38.8 | Added 15.1% | 2021-02-18 | | Commodities | GCC | 2.3 | Reduced 2.1%
| 2020-09-04 | | Precious Metals | GDX | 9.0 | Added 0.1% | 2021-02-18 | | Special Situations | 7.3% XLE, 4.8% PSCE | 12.1 | Reduced 5.6% | 2021-02-18 | | Cash | | 32.8 | | |
|
Updates (Changes made today are underlined)
With a market that has seen the kinds of broad participation and big breath thrusts like we did in the fall, it's hard to become too negative. Those kinds of conditions have consistently preceded higher returns over the next 6-12 months. It's the interim that's more of an issue. Even conditions like that haven't prevented some shorter-term pullbacks. And when we combine an environment where speculation is rampant and recent days have seen an increase in cracks under the surface of the indexes, it's enough to become more defensive over a short- to medium-term time frame. We still don't have much confirmation from the price action in the indexes, so those who are more conservative would likely wait before increasing cash levels. I've decreased risk exposure a bit more, mainly in terms of energy stocks and the ANGL fund, while adding more to the broader bond market. RETURN YTD: 7.3% 2020: 8.1%, 2019: 12.6%, 2018: 0.6%, 2017: 3.8%, 2016: 17.1%, 2015: 9.2%, 2014: 14.5%, 2013: 2.2%, 2012: 10.8%, 2011: 16.5%, 2010: 15.3%, 2009: 23.9%, 2008: 16.2%, 2007: 7.8%
|
|
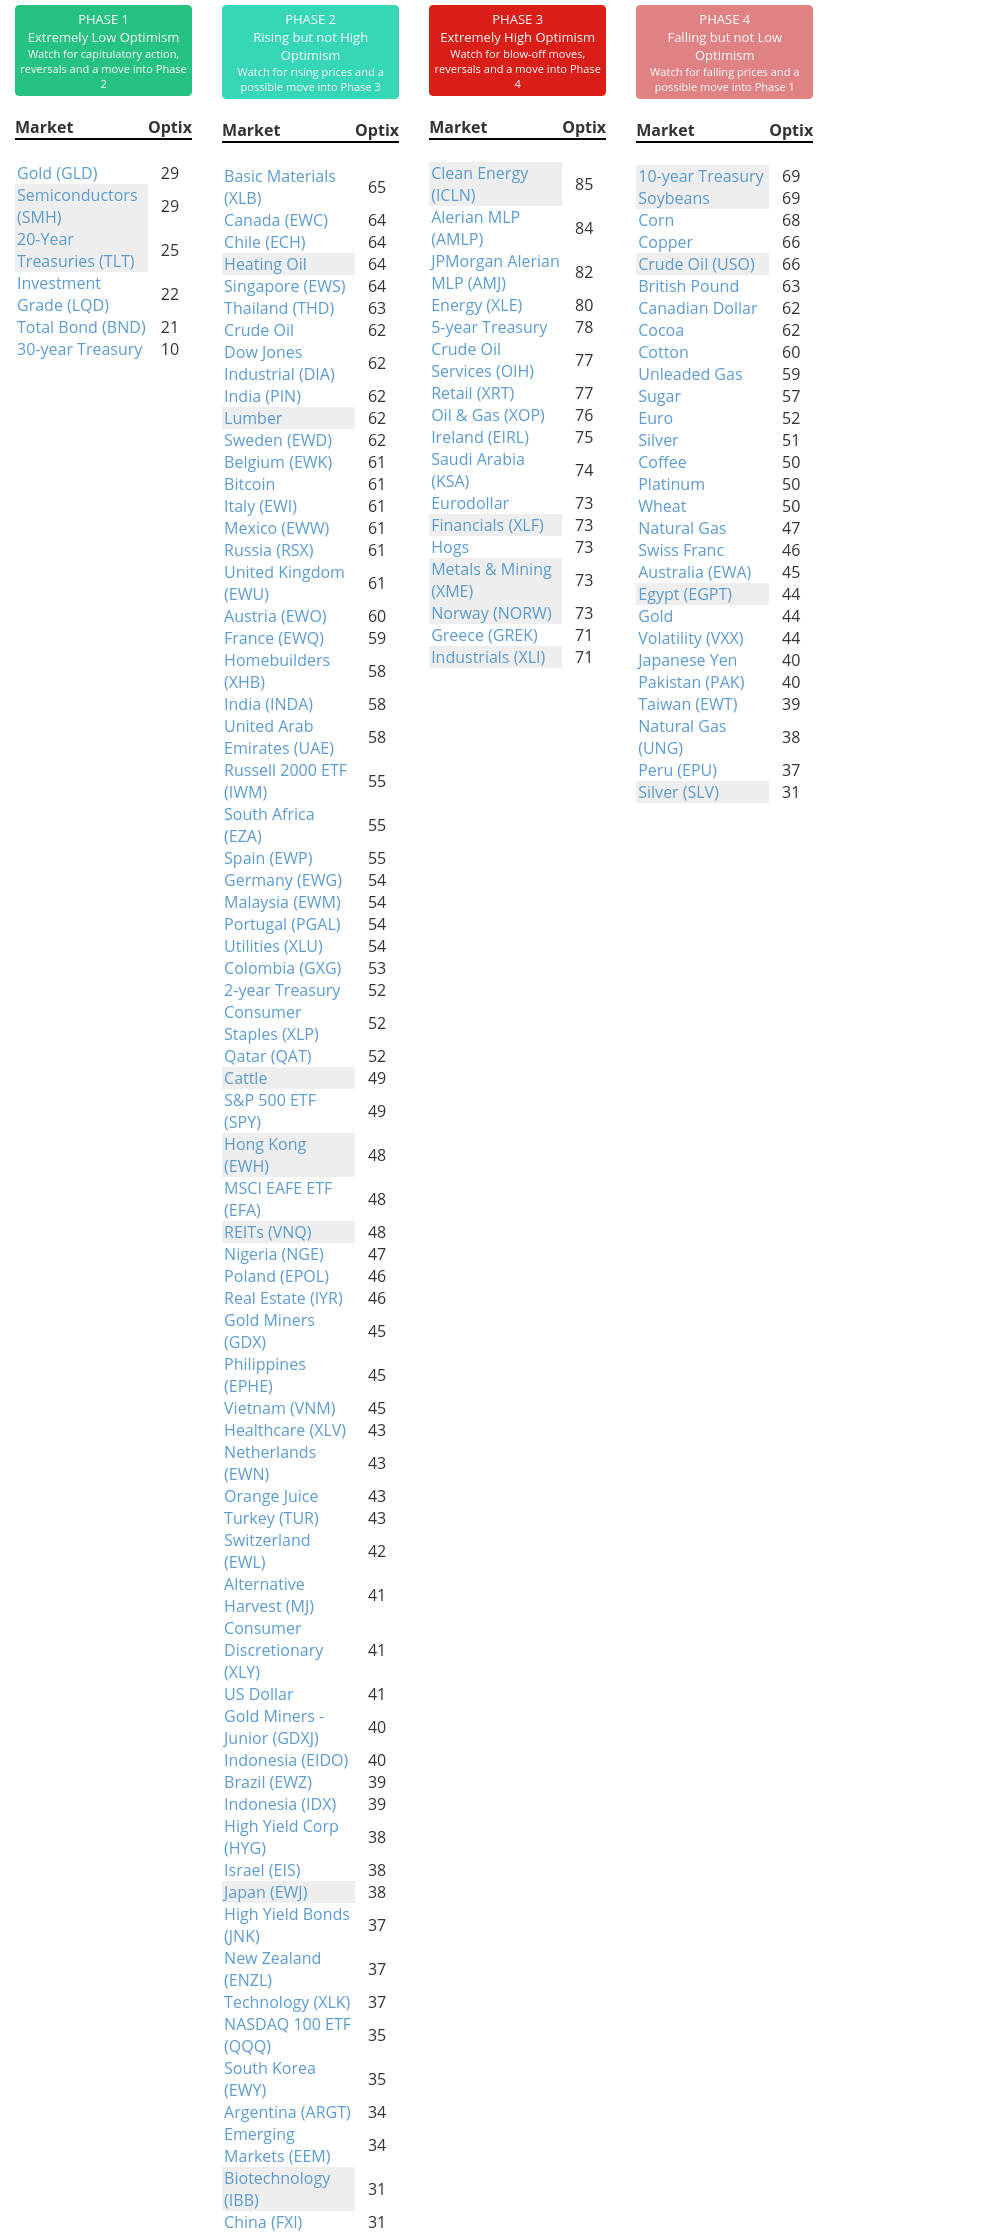
Phase Table
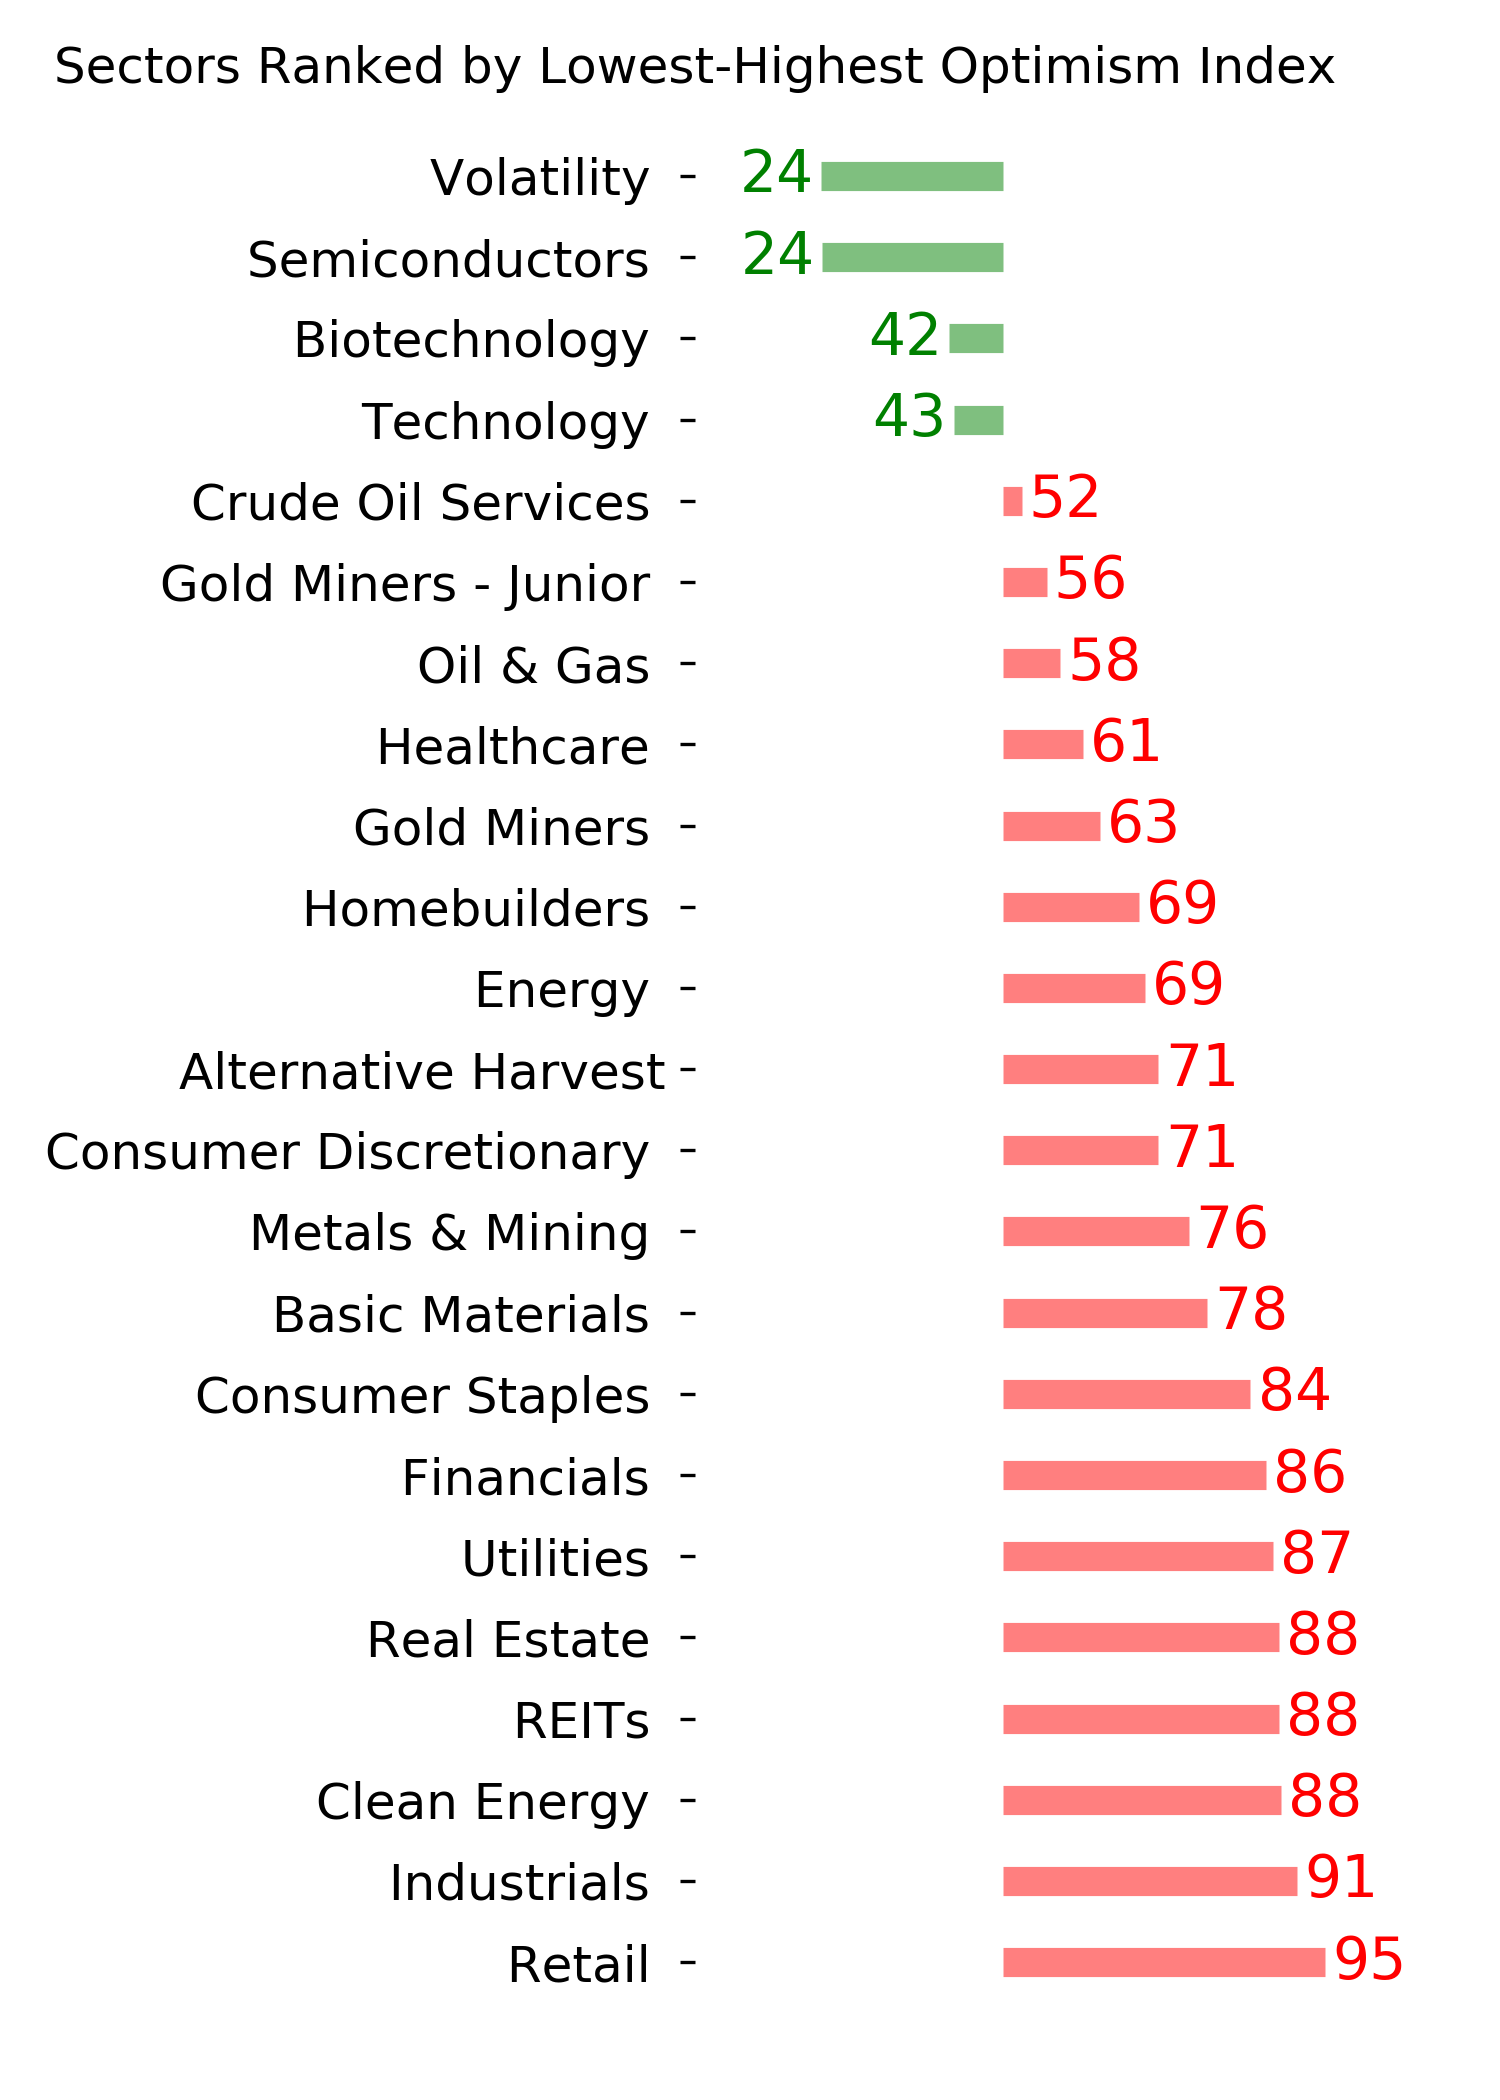
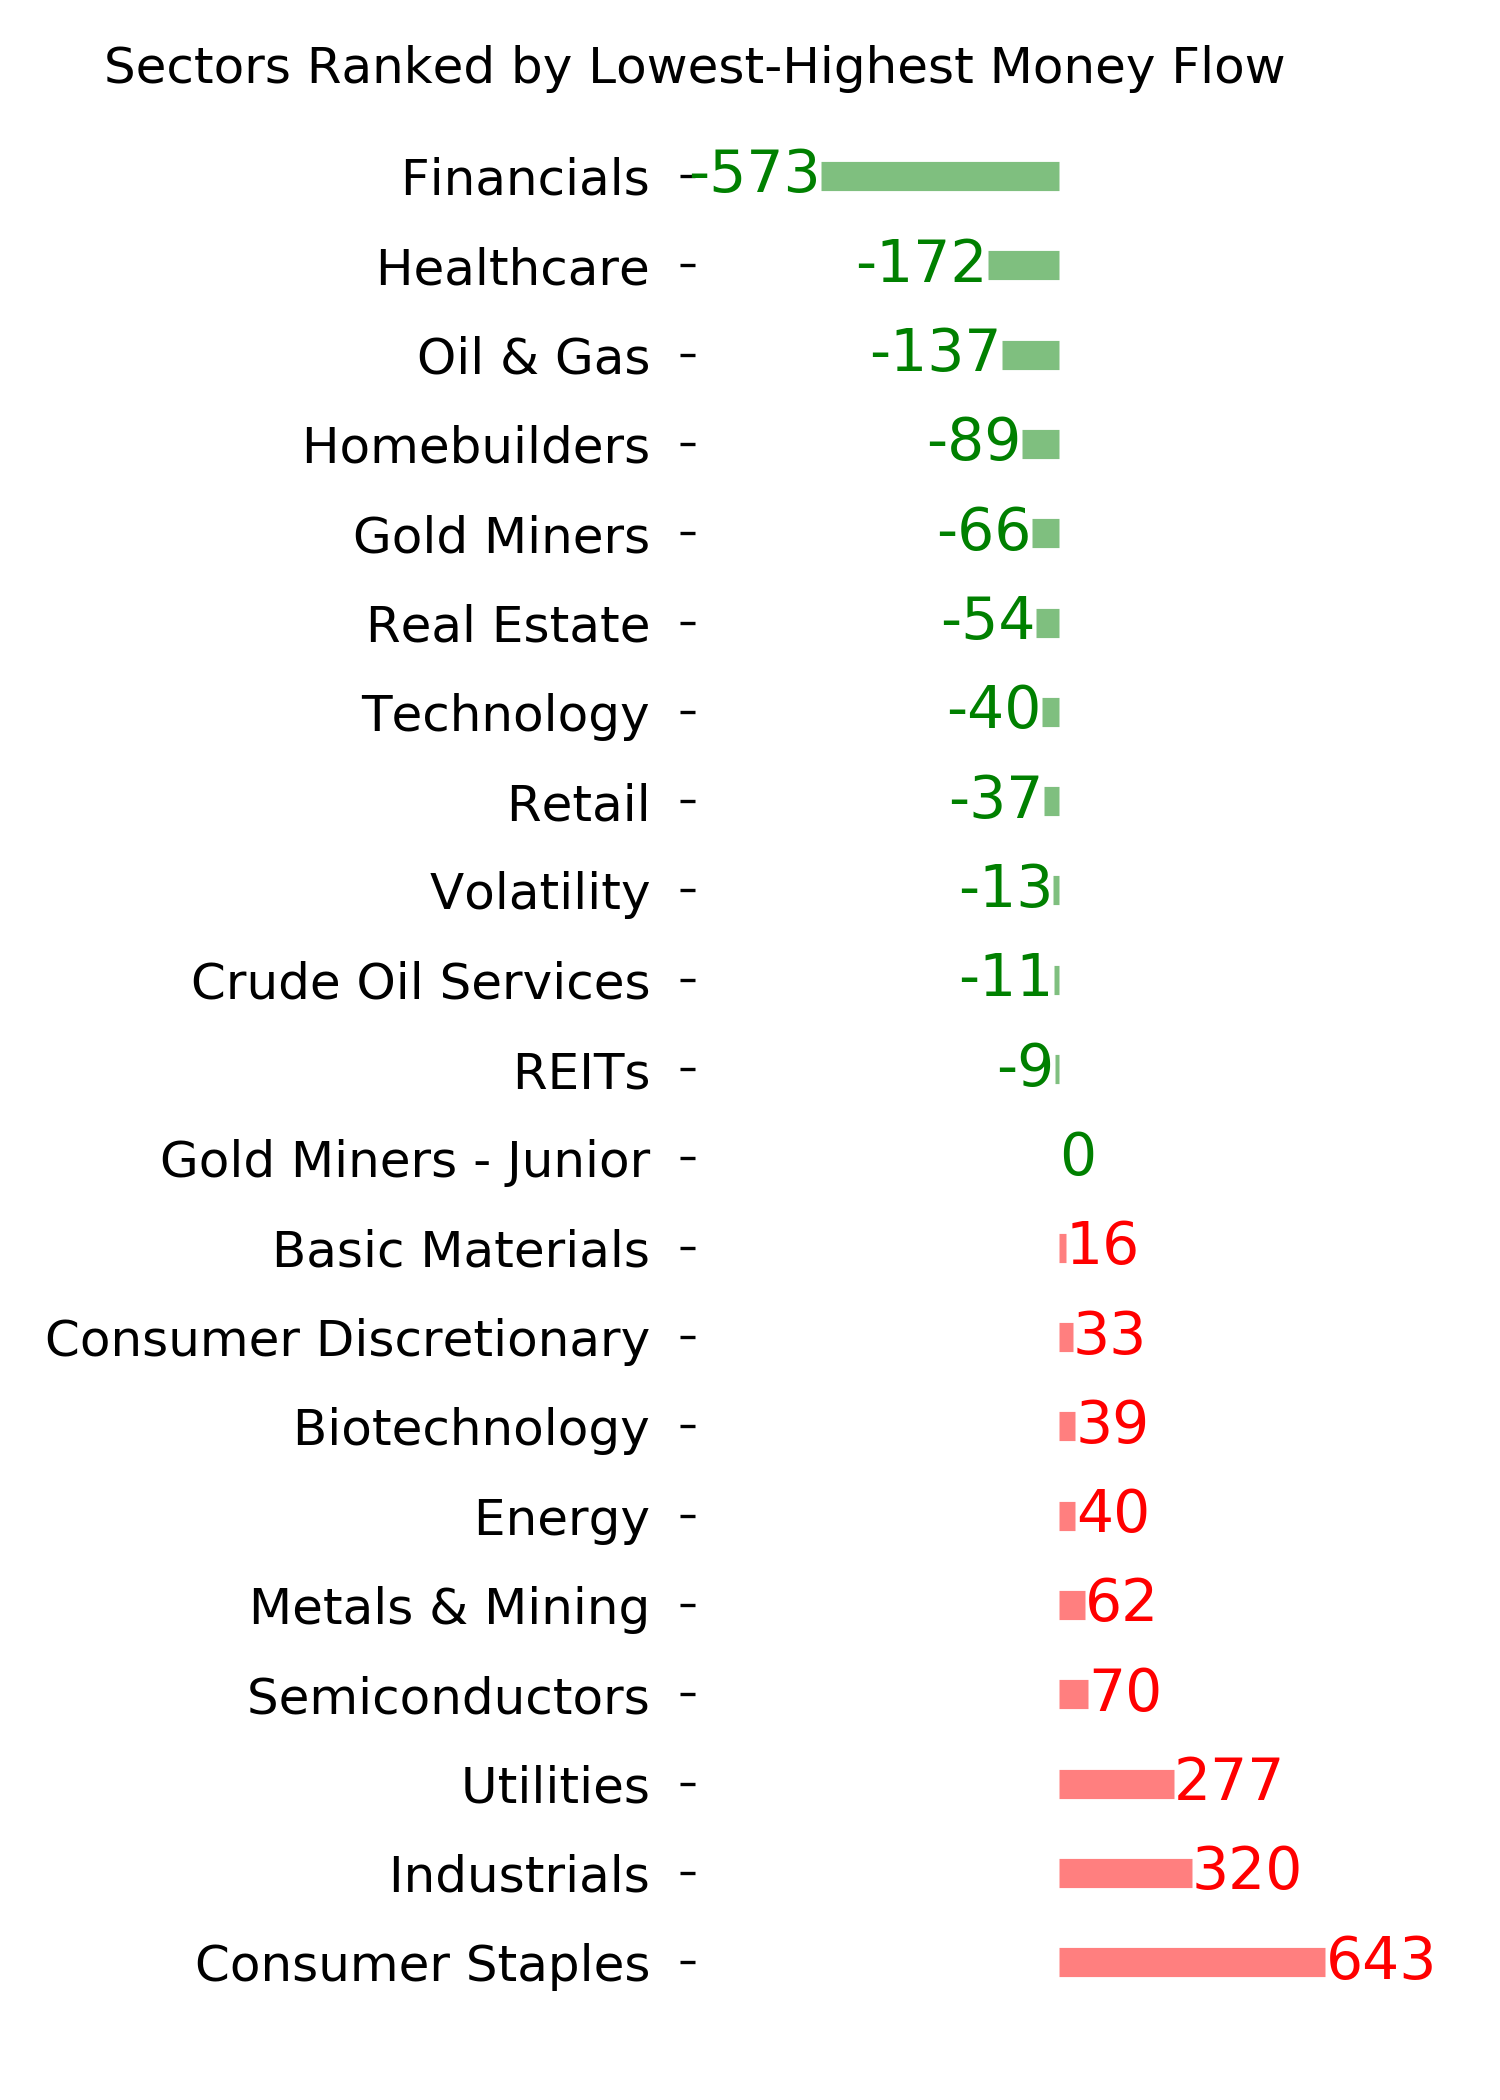
Ranks
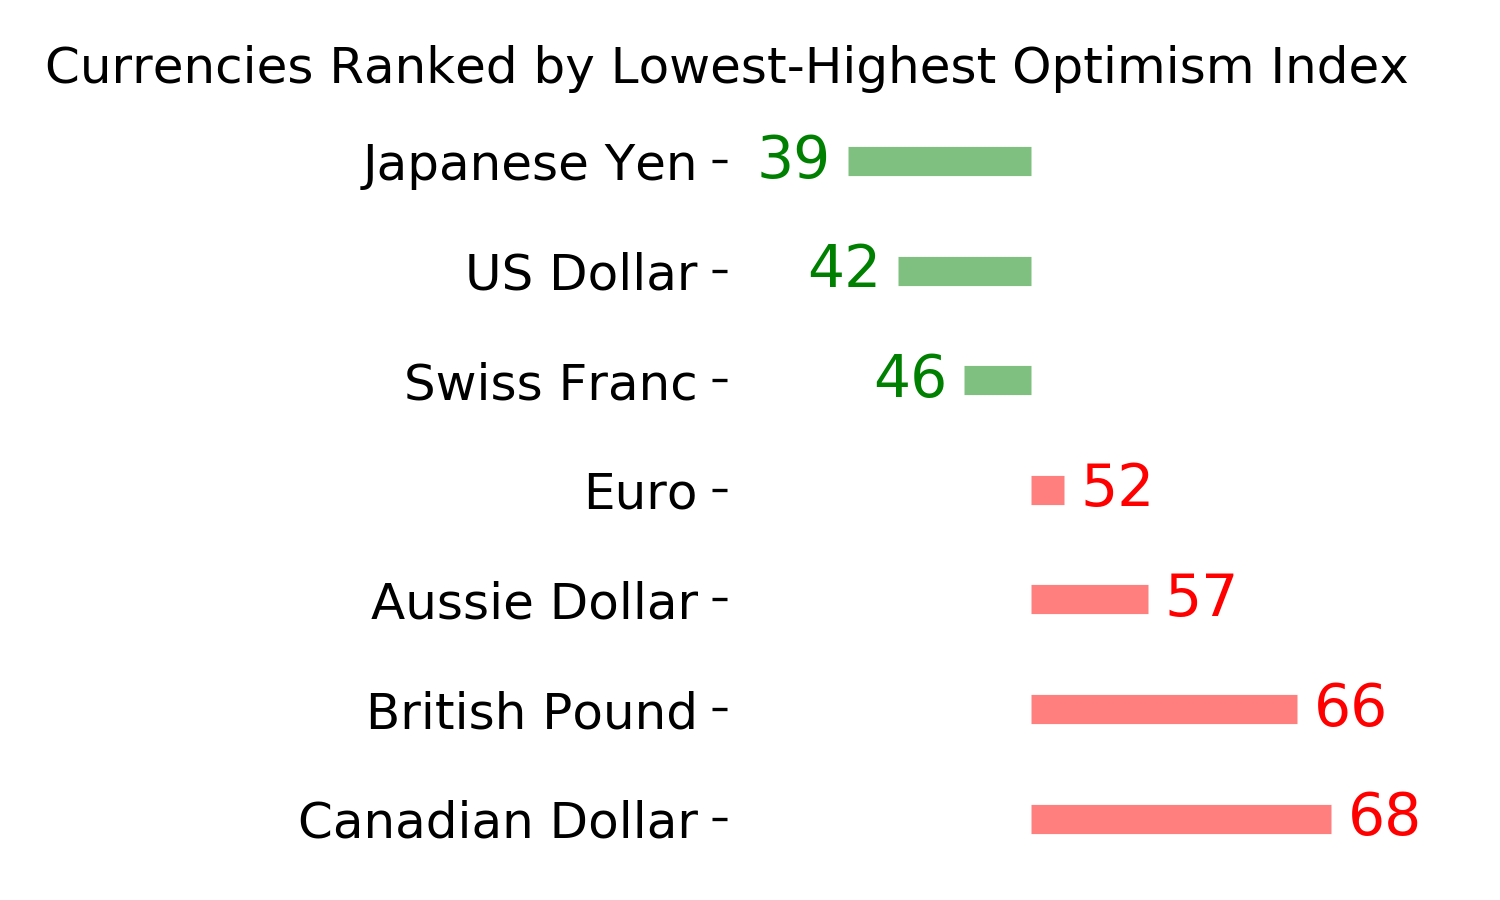
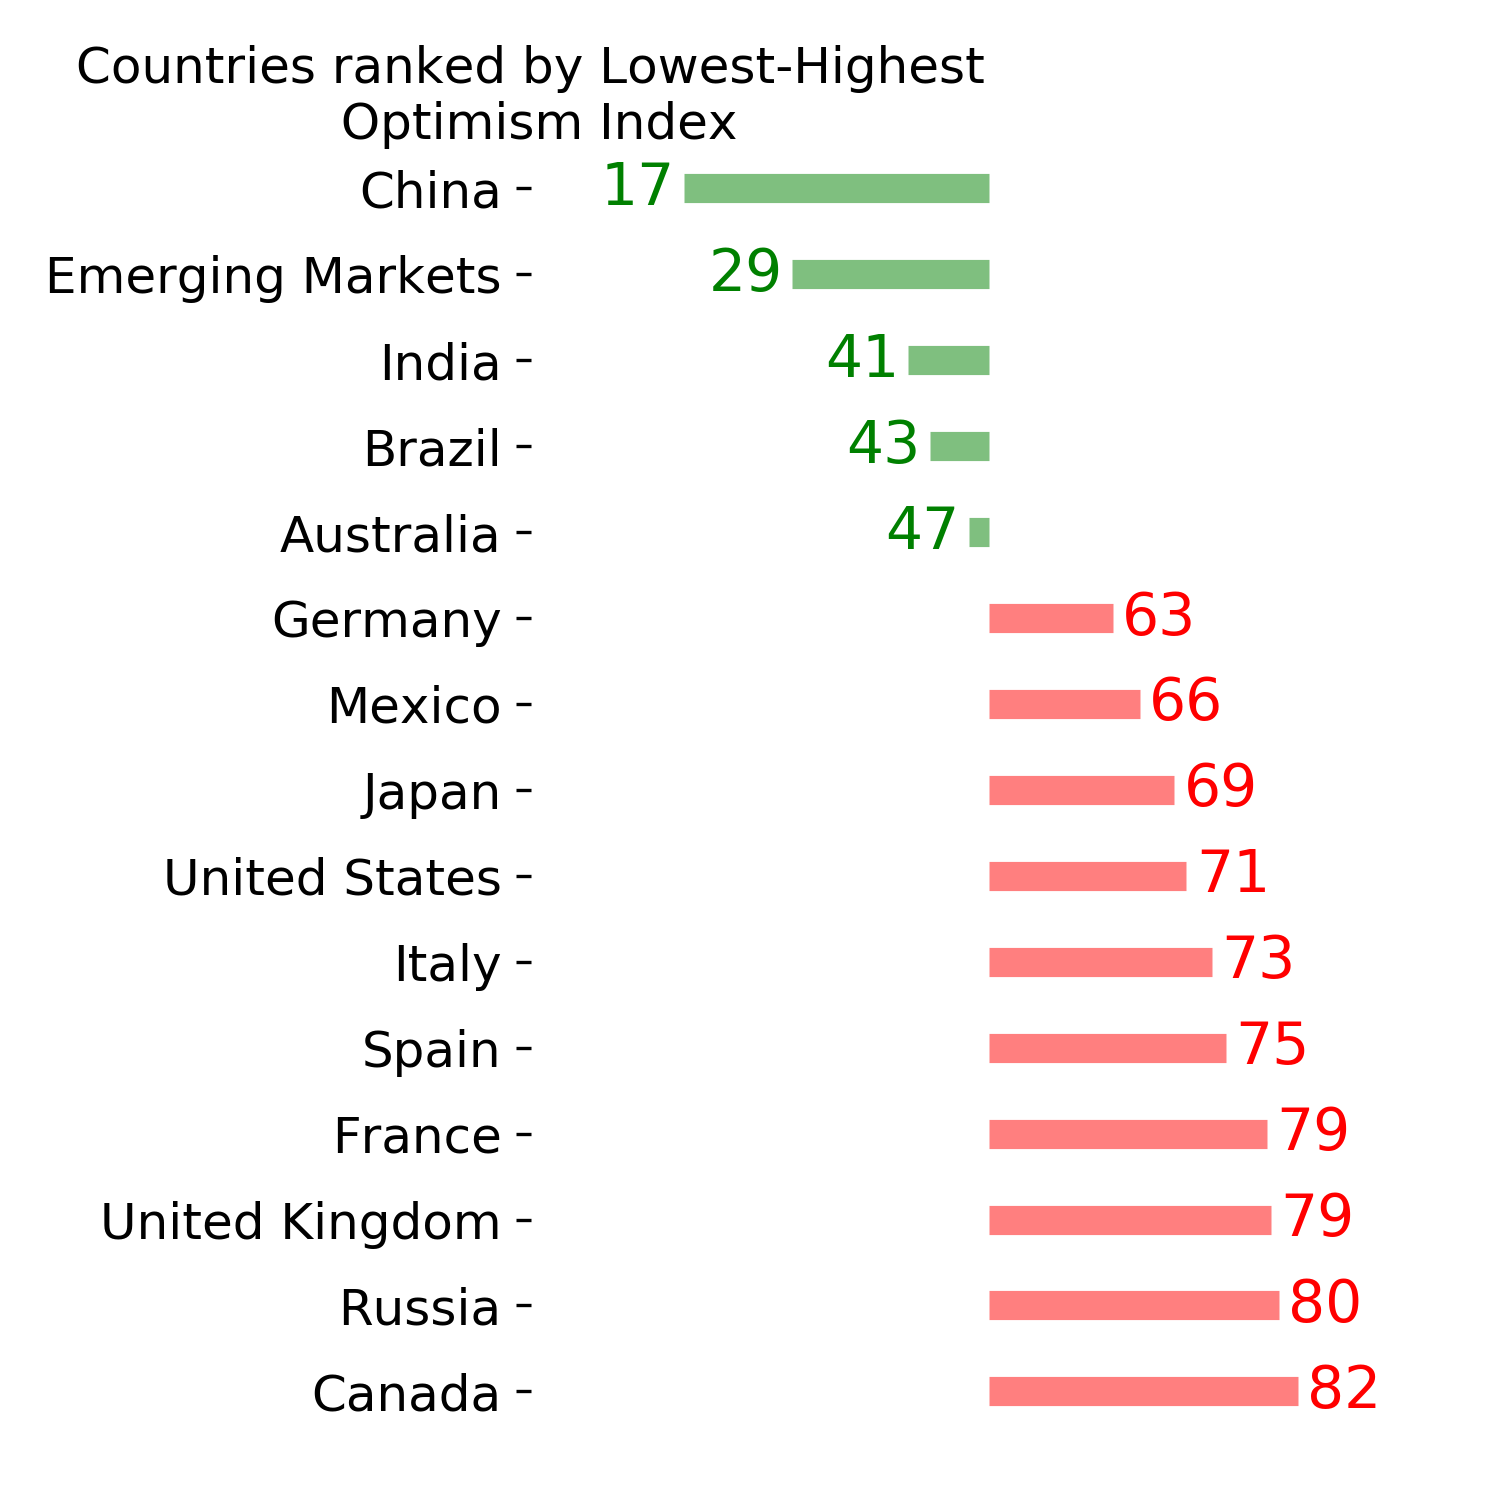
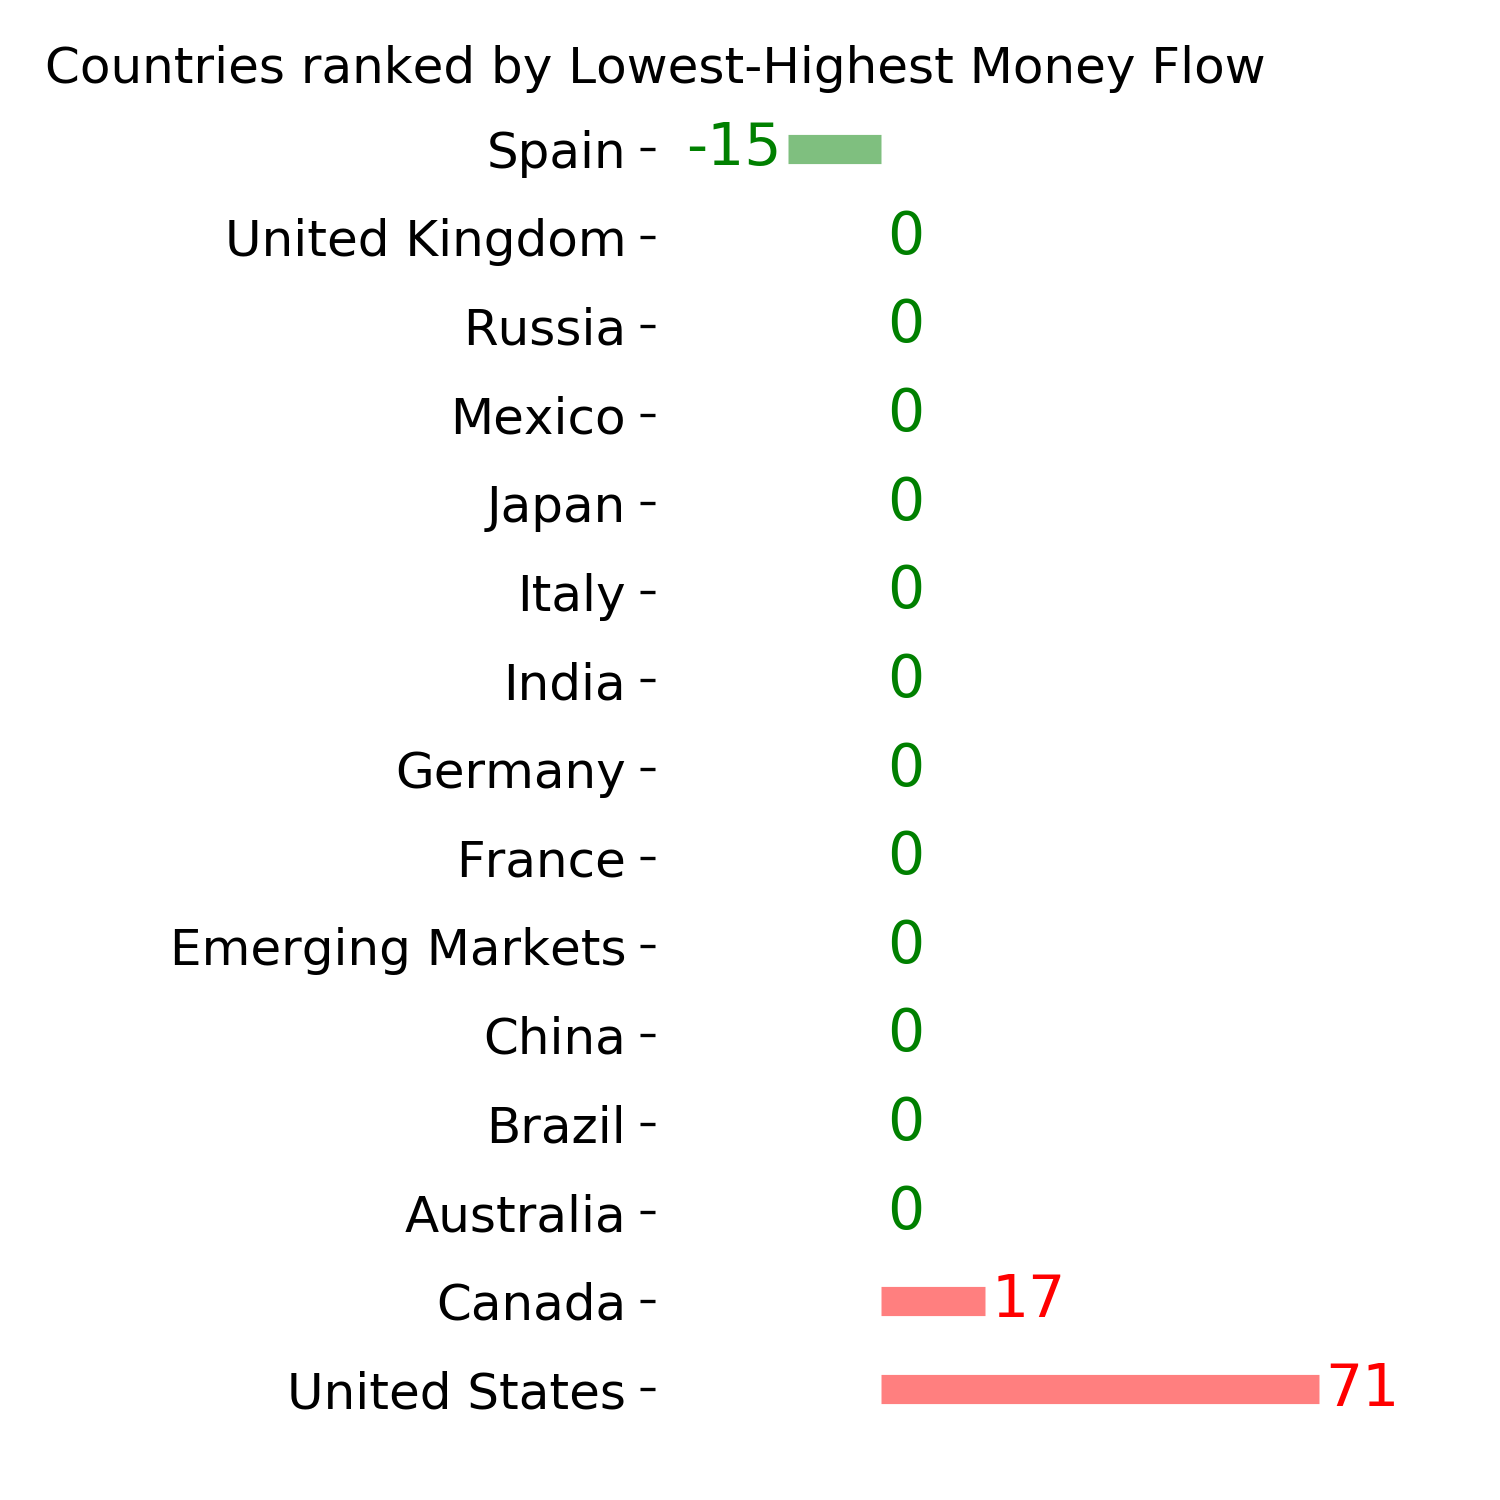
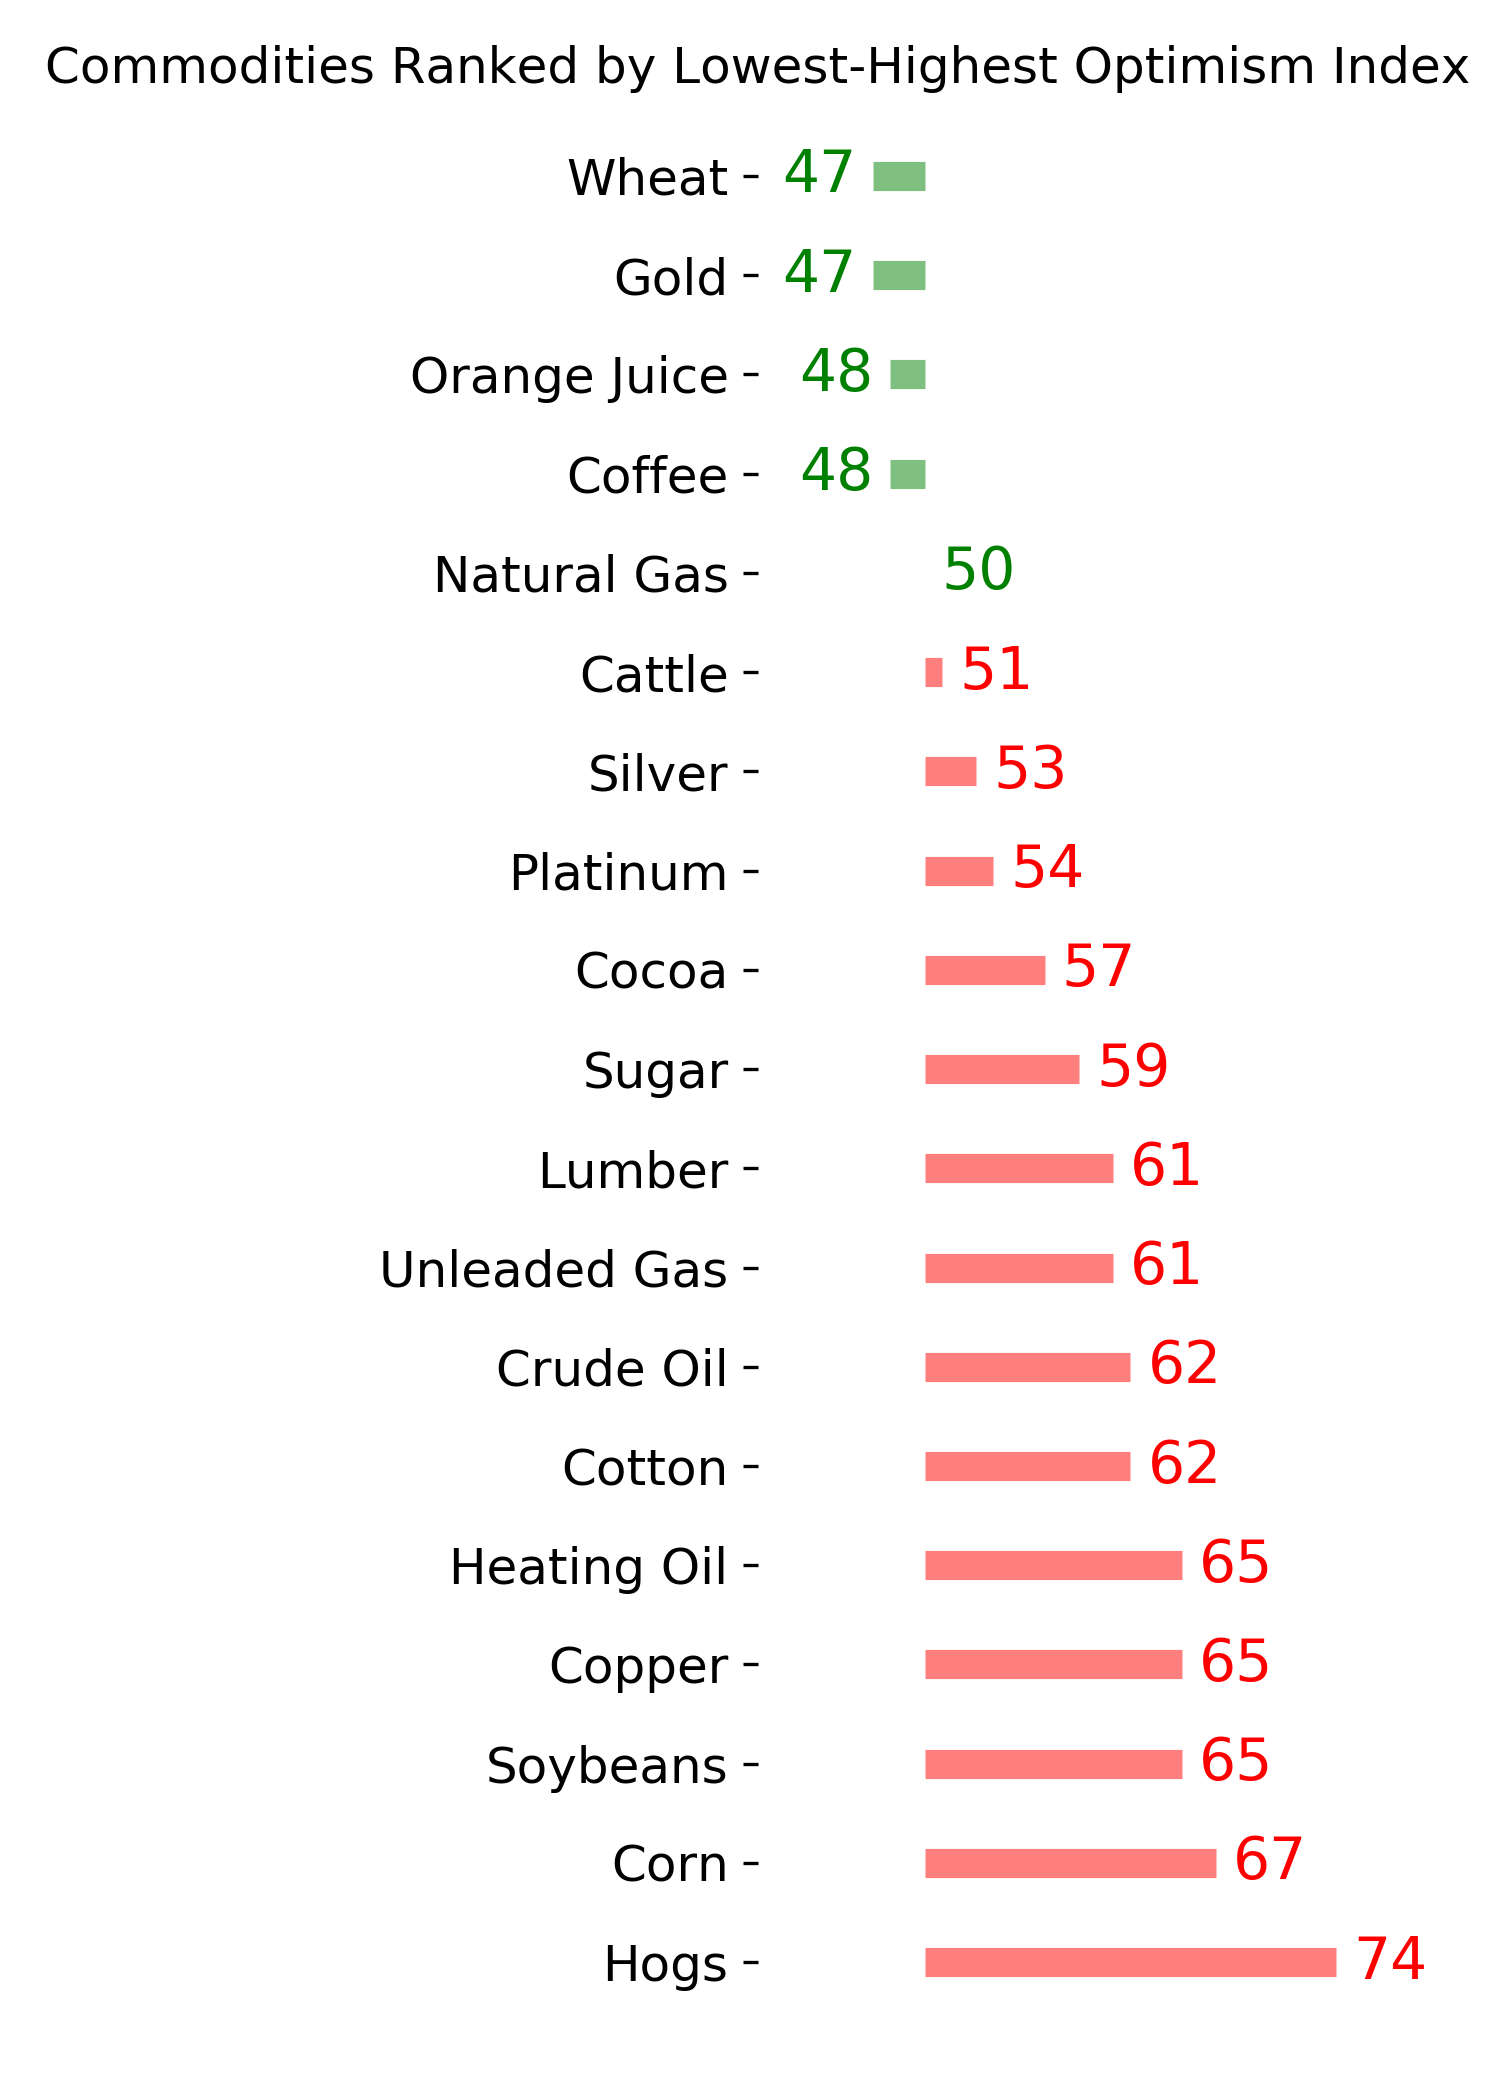
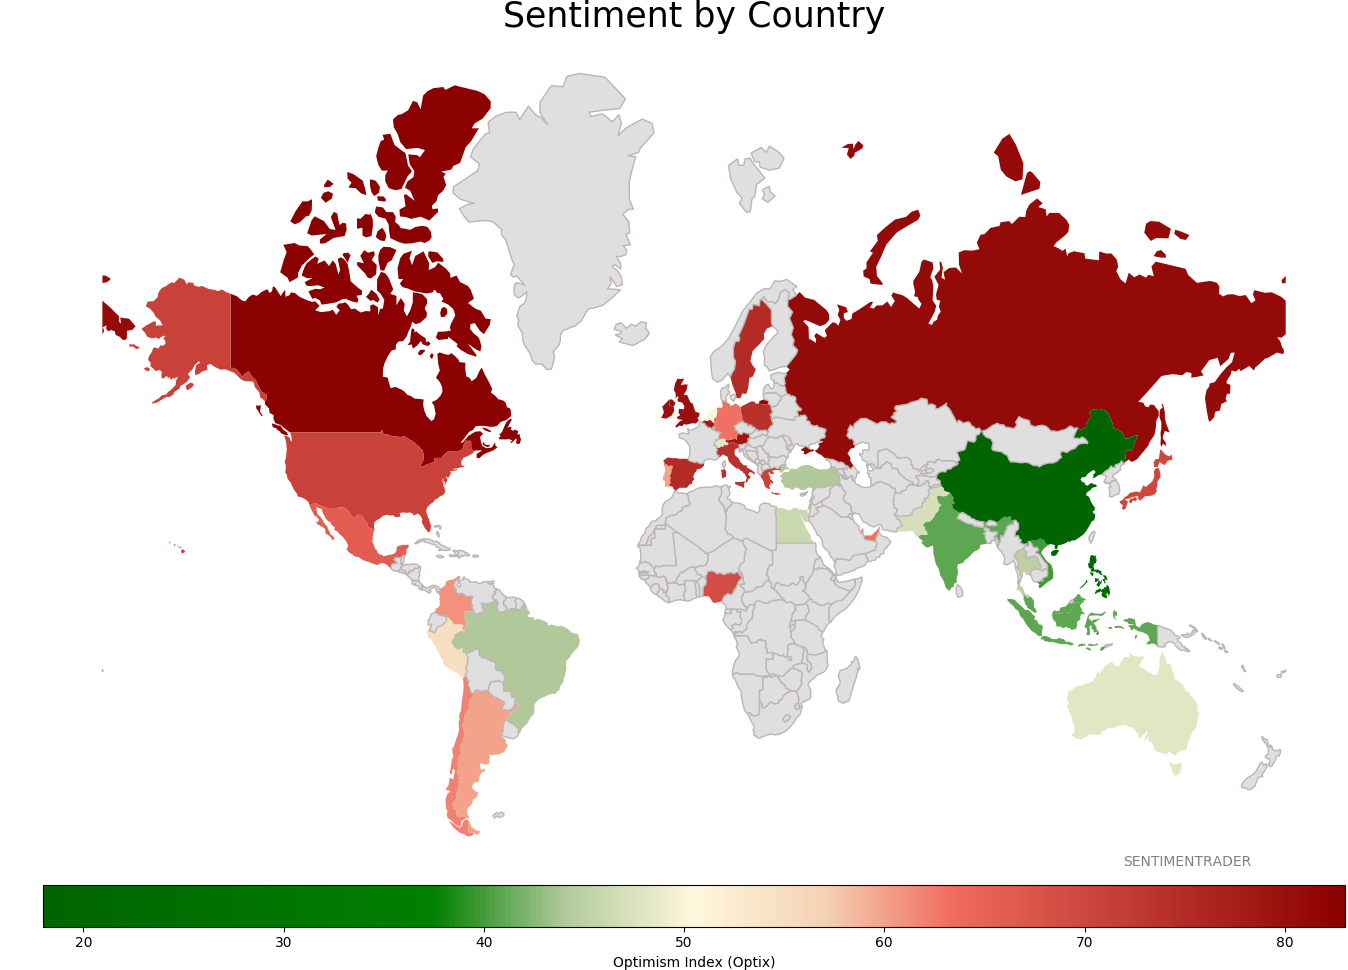
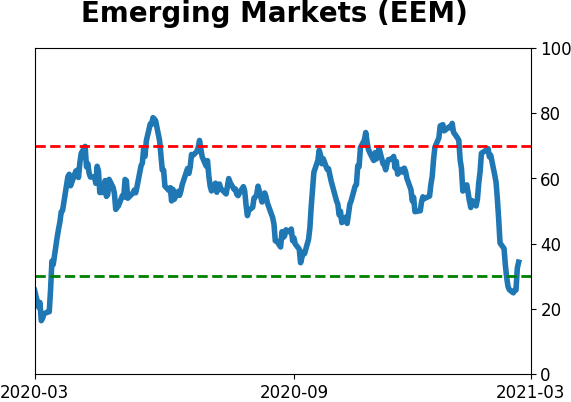
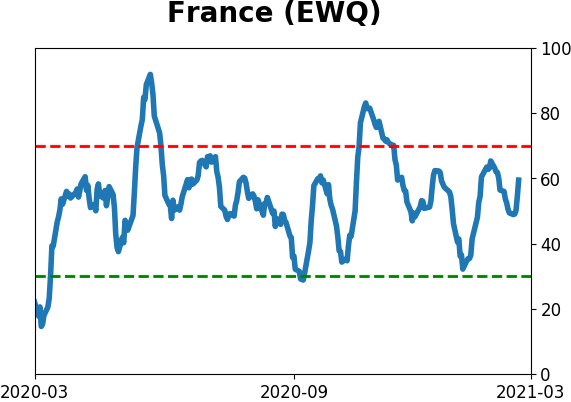
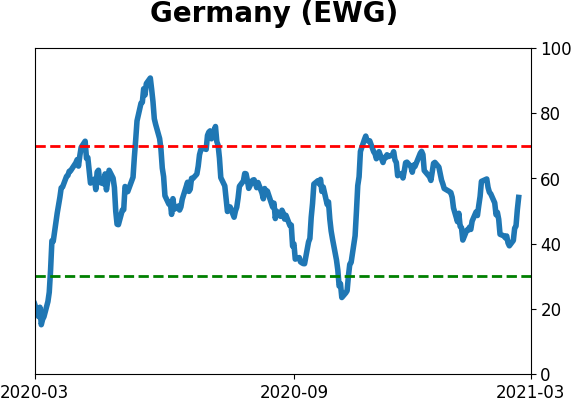
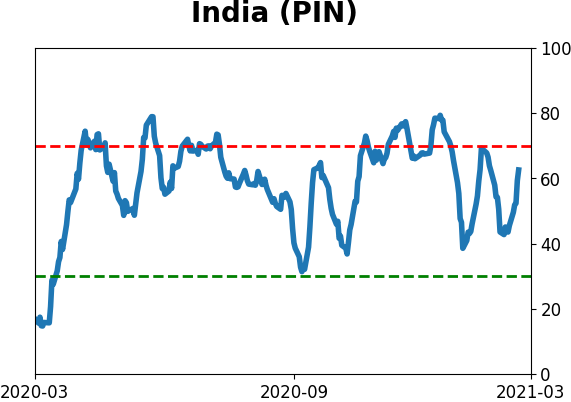
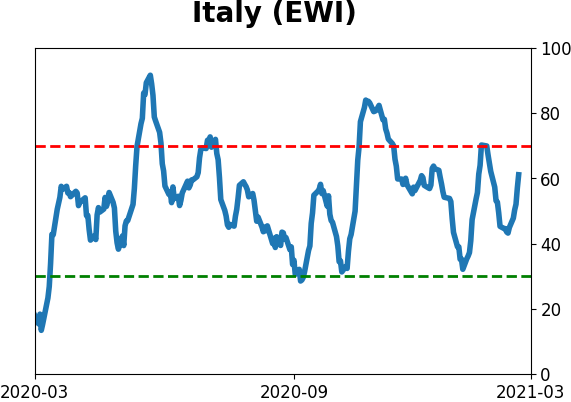
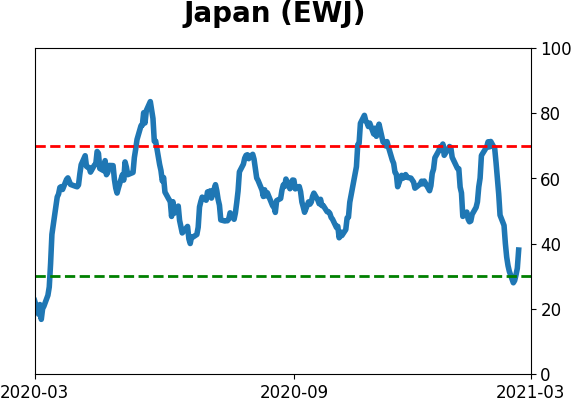
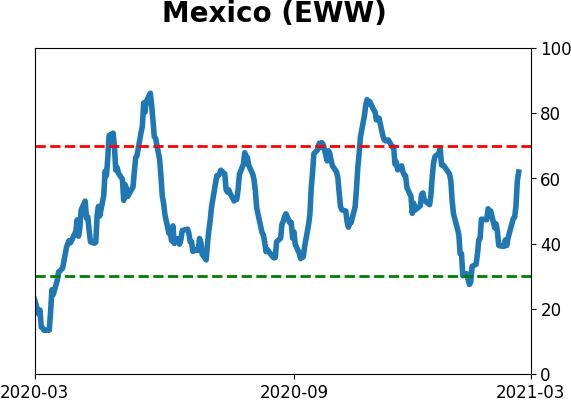
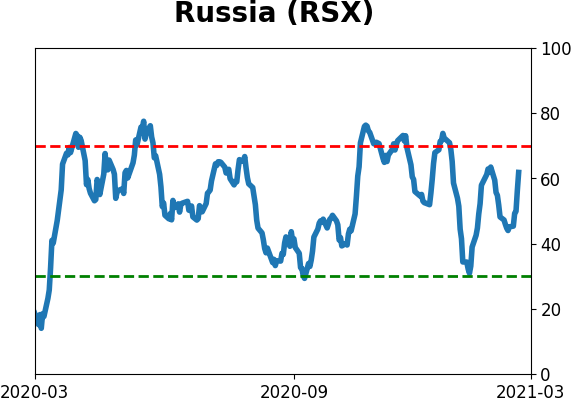
Sentiment Around The World
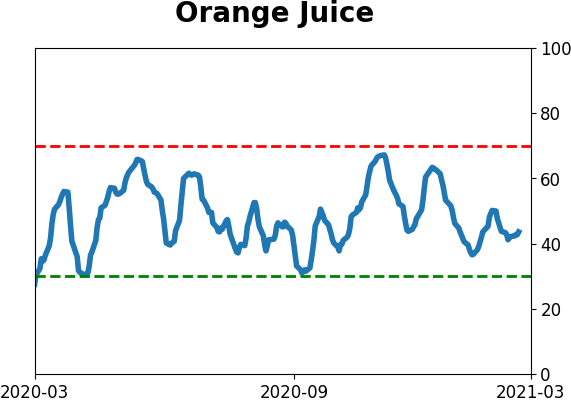
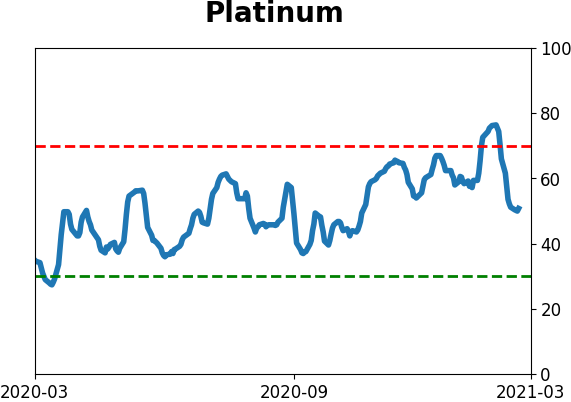
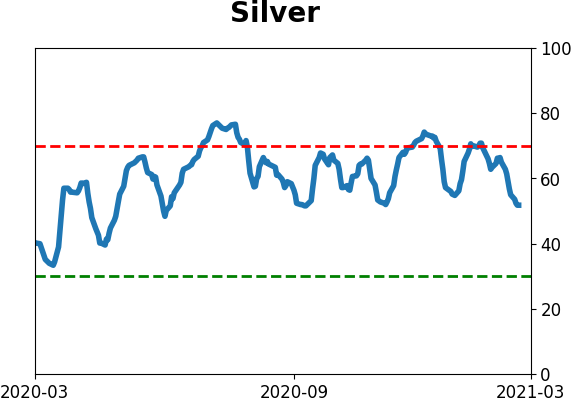
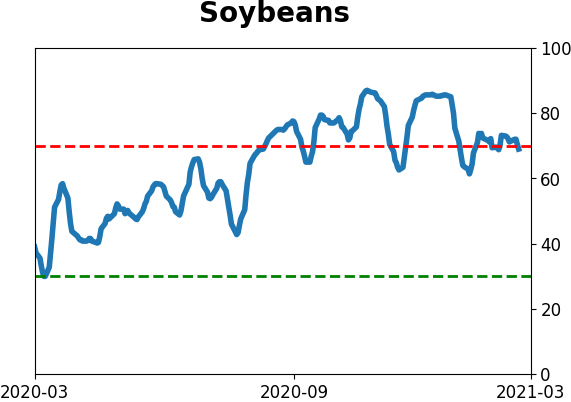
Optimism Index Thumbnails
|
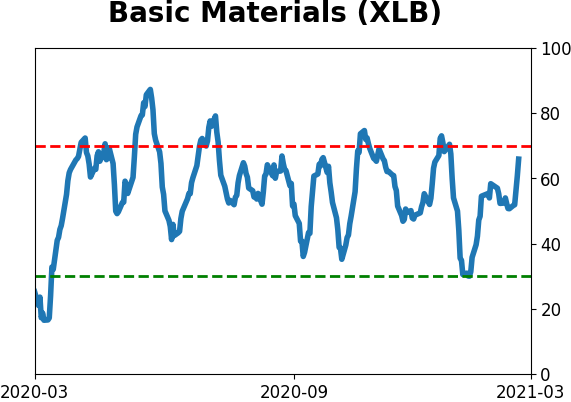
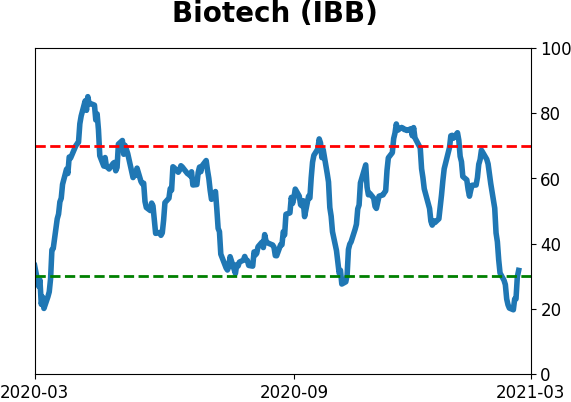
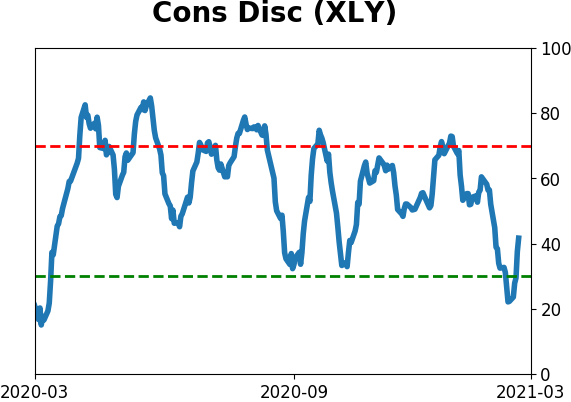
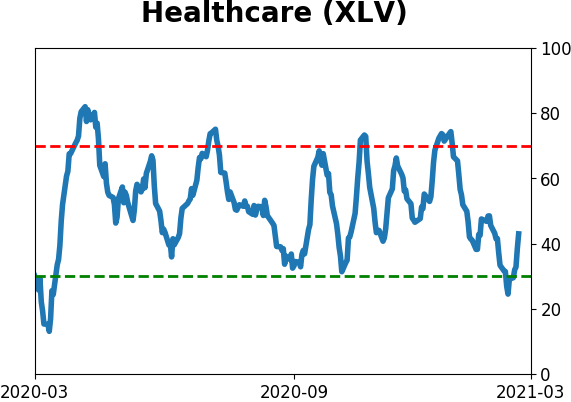
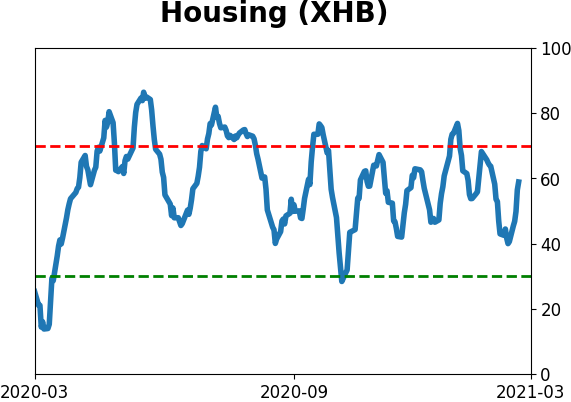
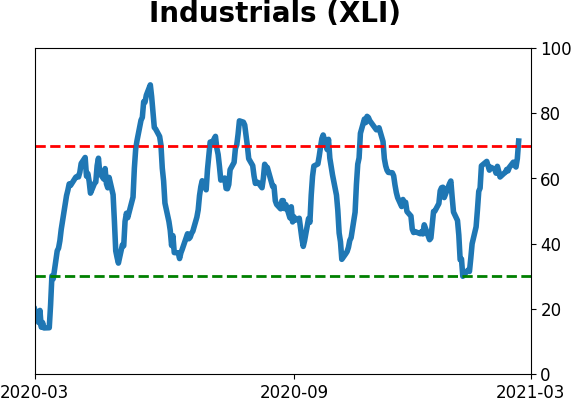
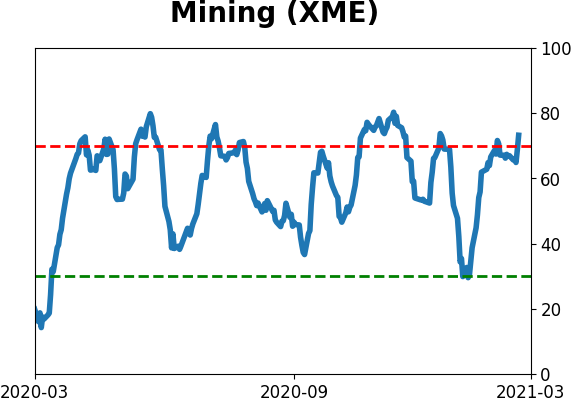
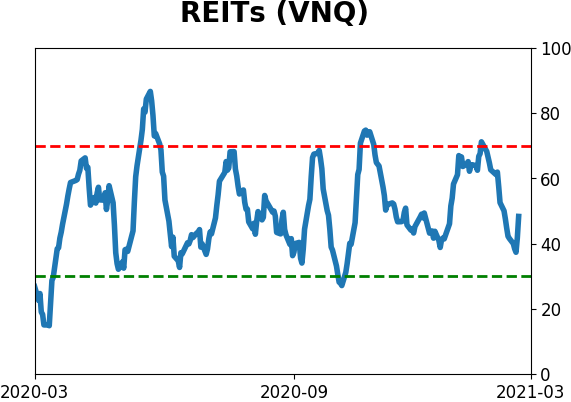
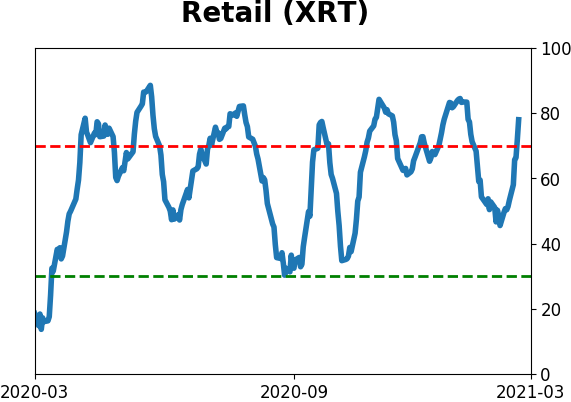
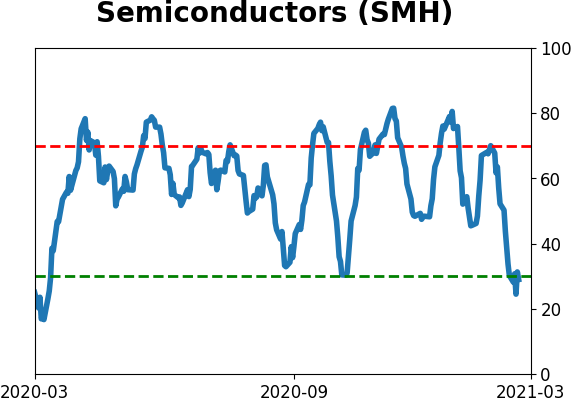
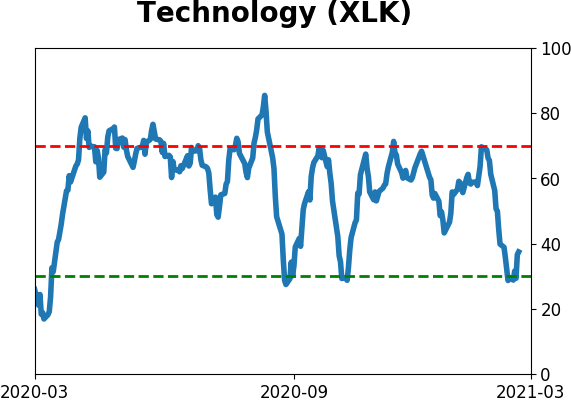
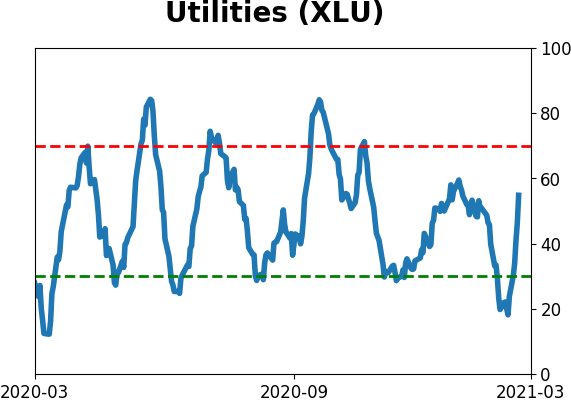
Sector ETF's - 10-Day Moving Average
|
|
|
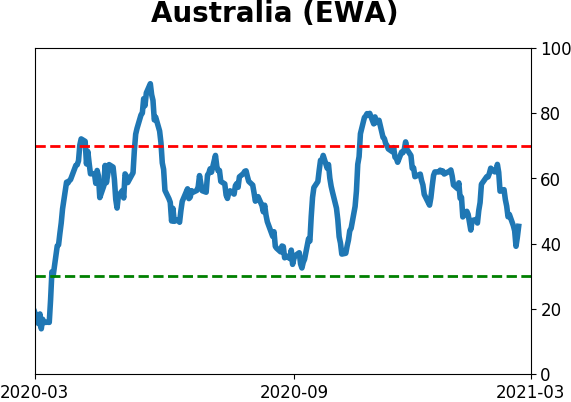
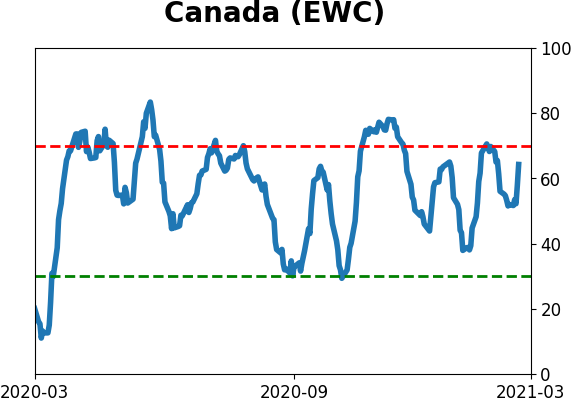
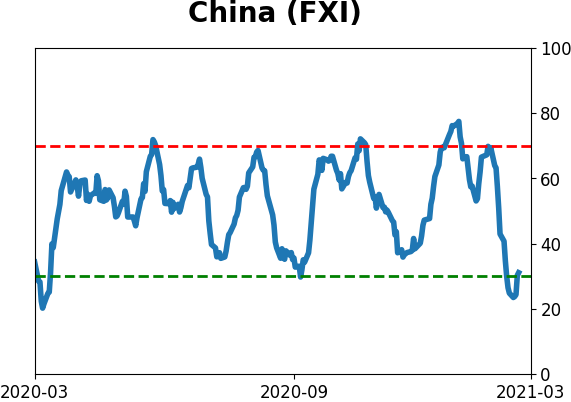
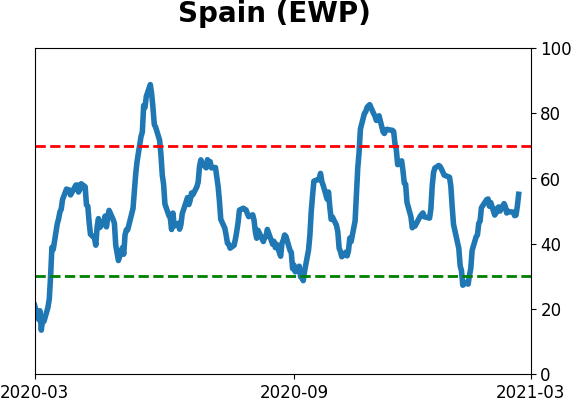
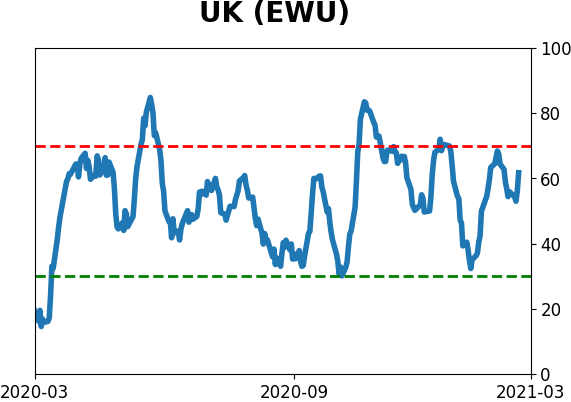
Country ETF's - 10-Day Moving Average
|
|
|
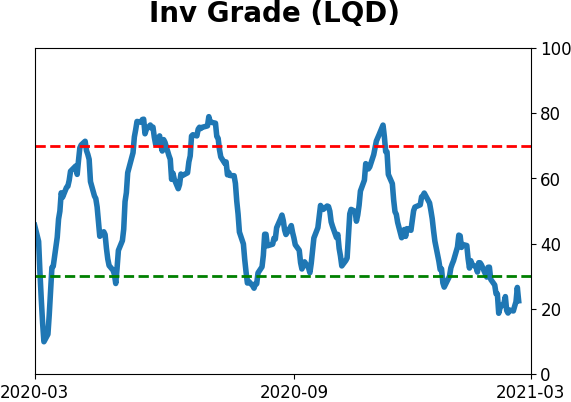
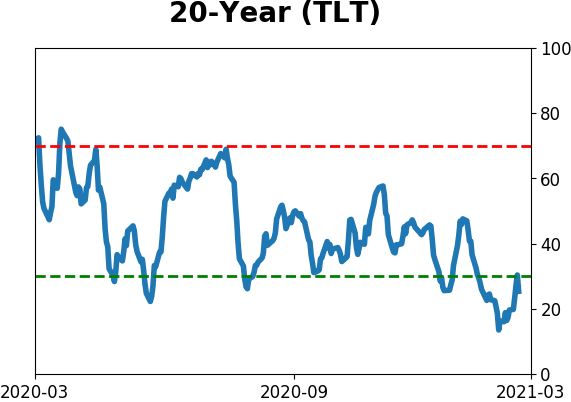
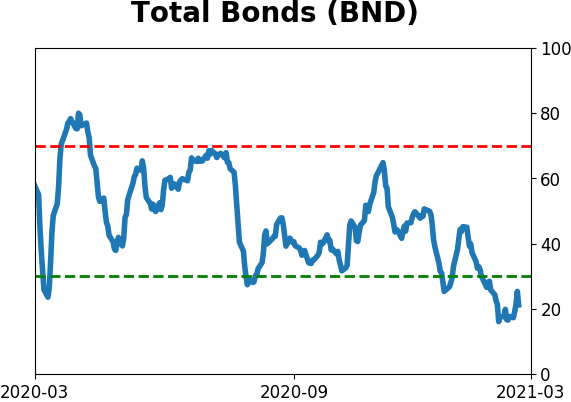
Bond ETF's - 10-Day Moving Average
|
|
|
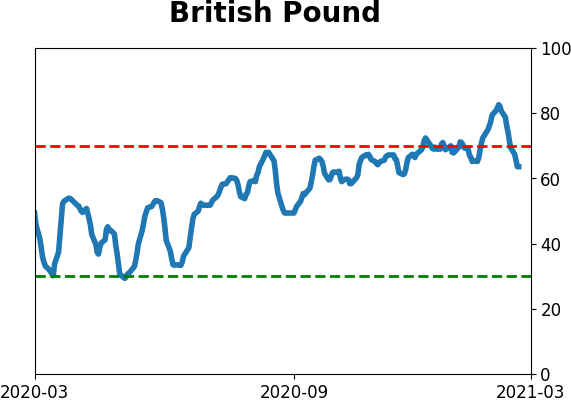
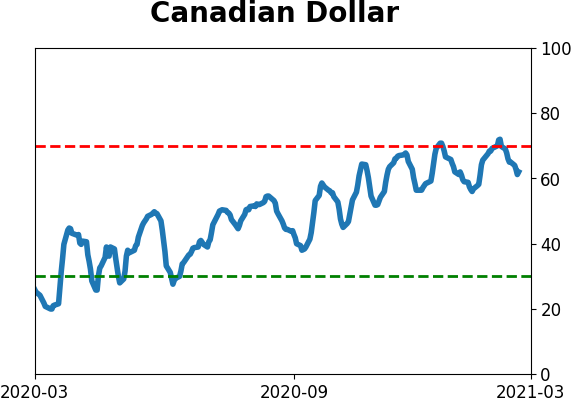
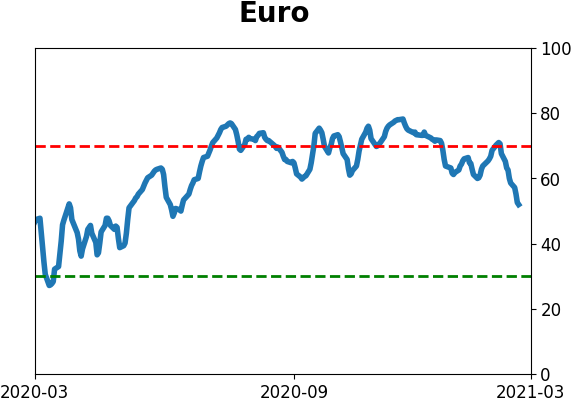
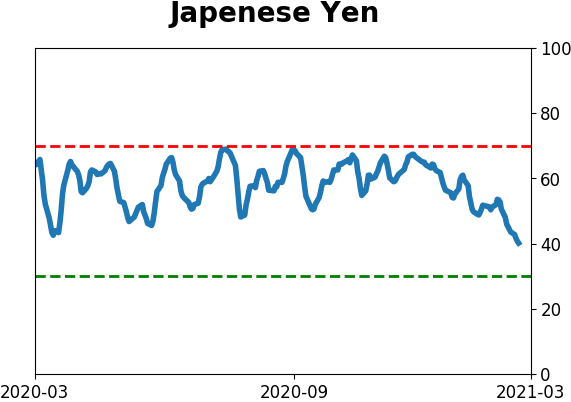
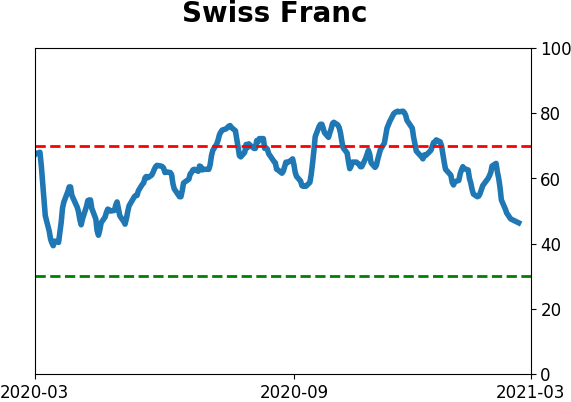
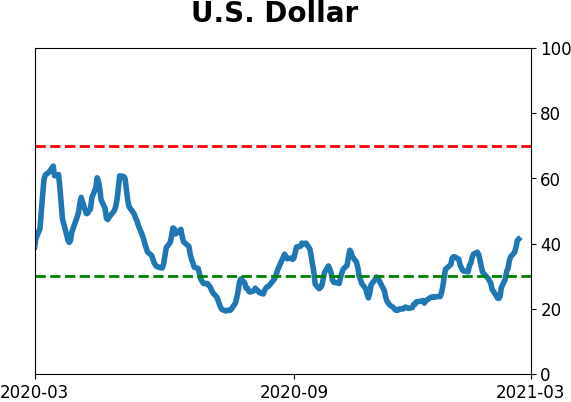
Currency ETF's - 5-Day Moving Average
|
|
|
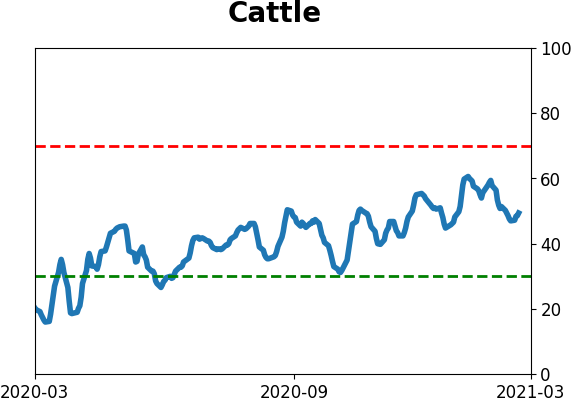
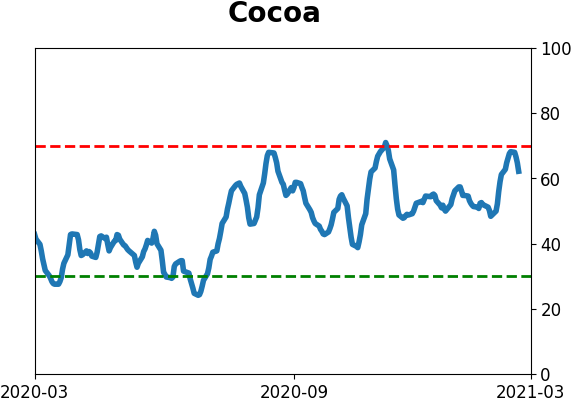
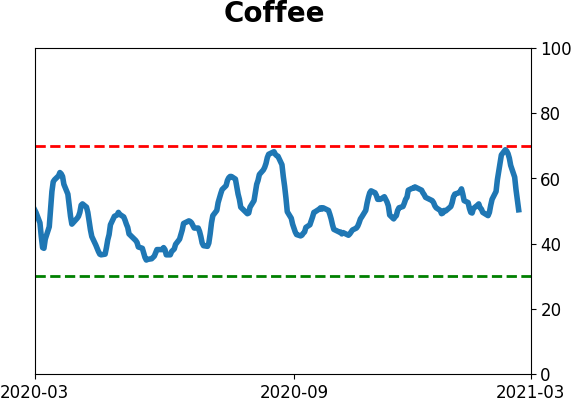
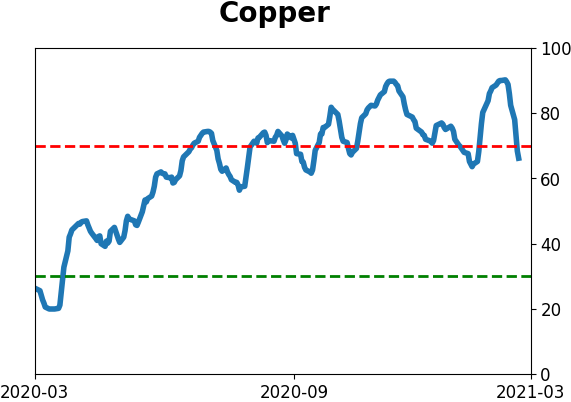
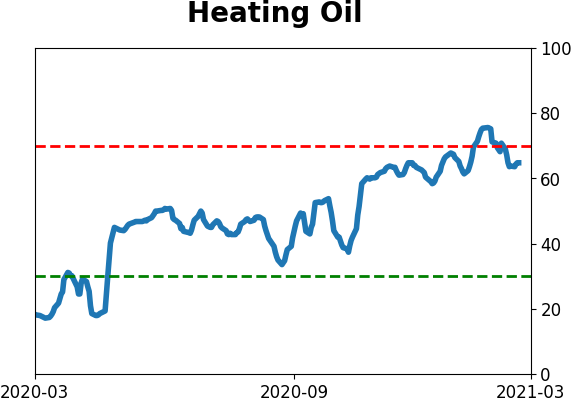
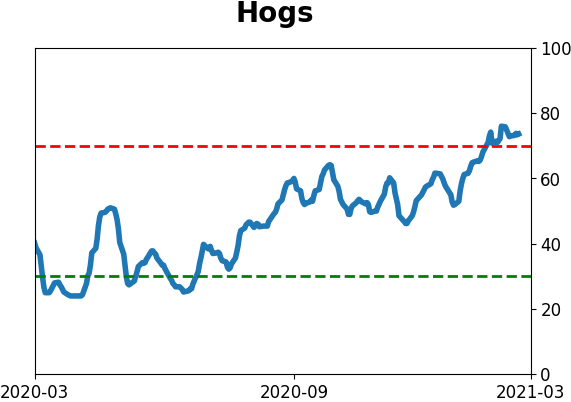
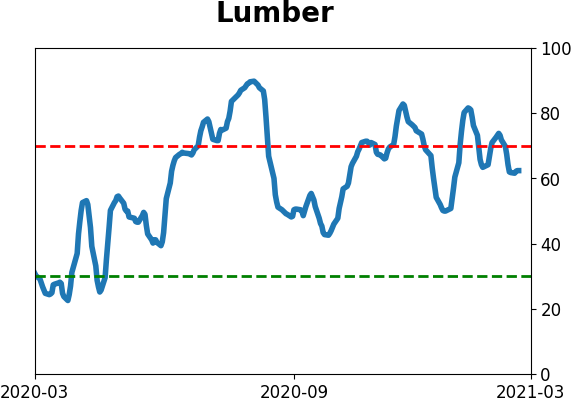
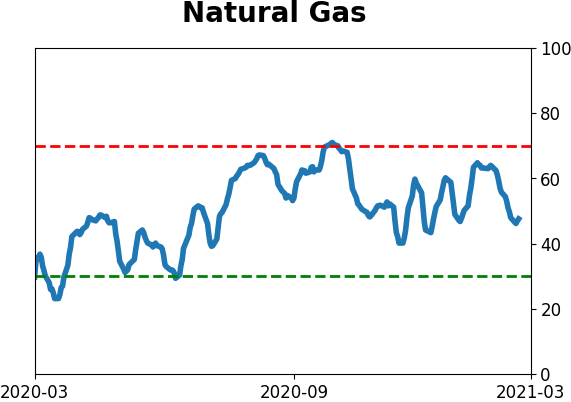
Commodity ETF's - 5-Day Moving Average
|
|