
Historic Energy Momentum

Energy stocks are surging on an absolute and relative basis. For only the 6th time since 1926, the 126-day rate of change for the energy sector crossed above 50% on Friday. Simultaneously, the 126-day rate of change spread versus the S&P 500 registered the highest reading in history.
Let's look at some charts and tables that would suggest that the current energy sector uptrend offers a better risk/reward profile than several false starts since the energy sector peak in 2014.
The following chart and tables use total return data.
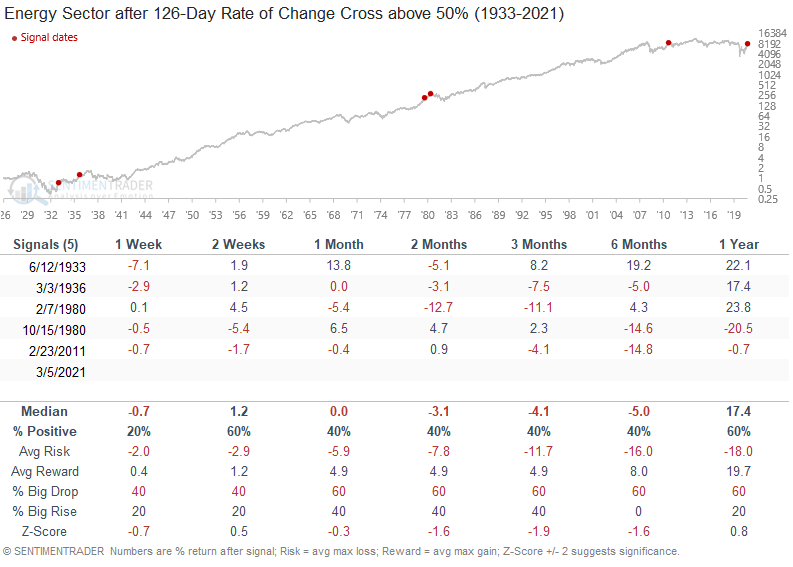
Energy Rate of Change Thrust
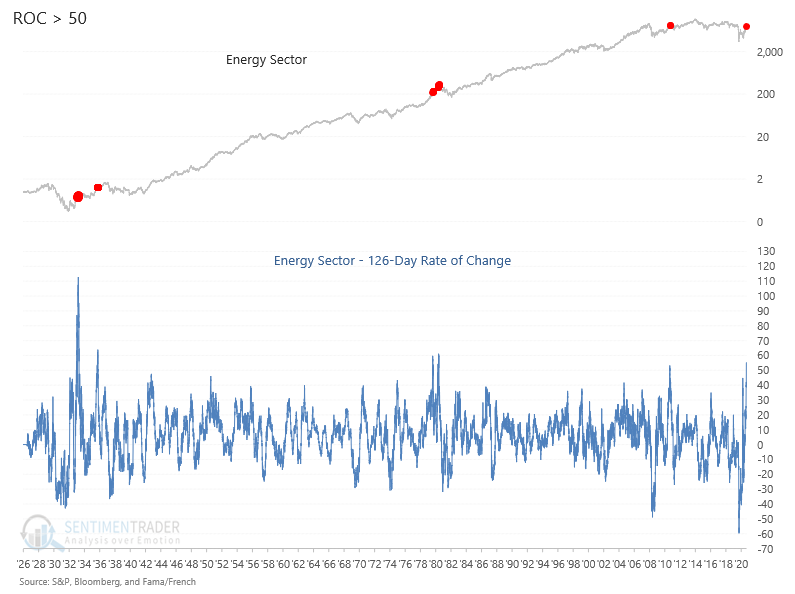
After other thrusts above 50%, forward returns were mixed to negative. Given the small sample size, it's hard to draw any conclusions.
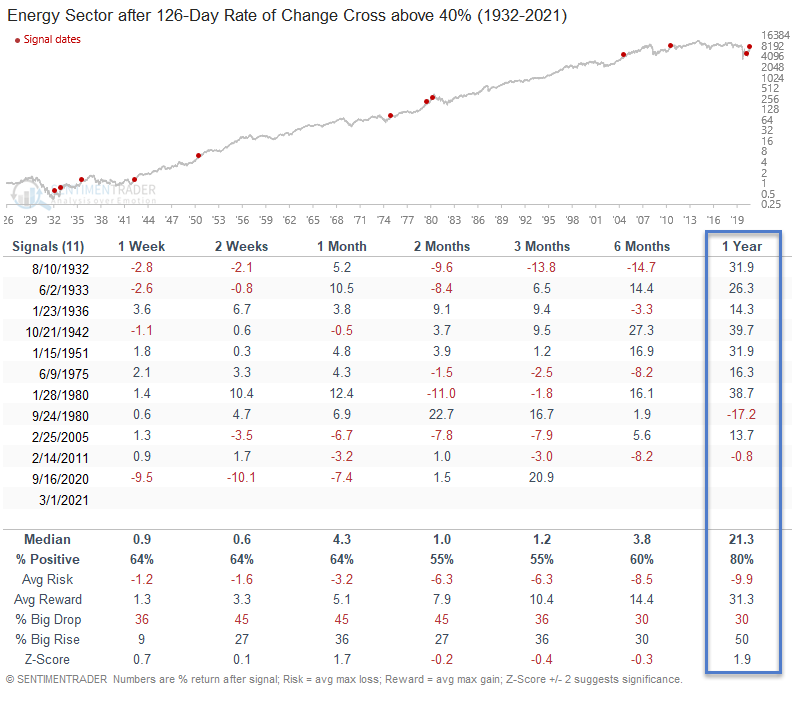
If I lower the 126-day rate of change threshold to a cross of 40%, the sample size increases to a level that provides a little more insight. The 1-year results look solid, though the 9/24/1980 instance represented a secondary signal near the tail end of the energy bull market.
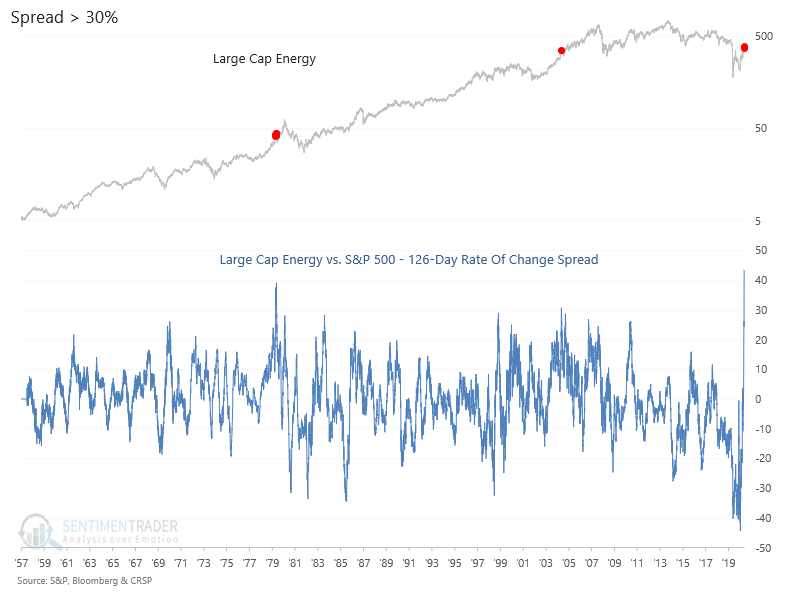
Energy Rate of Change Spread
The 126-day rate of change spread between large-cap energy and the S&P 500 registered a new all-time high with a cross above 40% on Friday. The two previous levels above 30% occurred in the 1974-80 and 2002-08 energy bull markets. This is using price-only data.
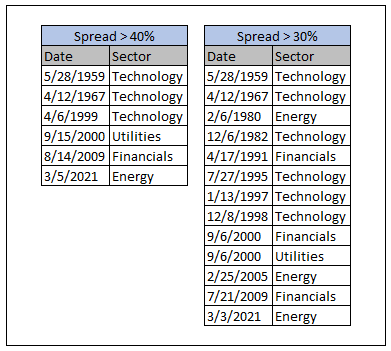
Historical 126-Day ROC Spread Signals
The following table highlights how a 126-day rate of change sector versus index spread reading of 40% is rare. Even if I lower the threshold to 30%, the instances remain low. If you look at the dates and sectors closely, one will notice that almost all instances represent major sector trends or sector rotation turning points.
The table below contains spread signal dates for instances in history when both the sector and the S&P 500 had a rate of change of greater than zero. By requiring a positive rate of change for both groups, I avoided instances in bear markets when defensive groups outperformed.
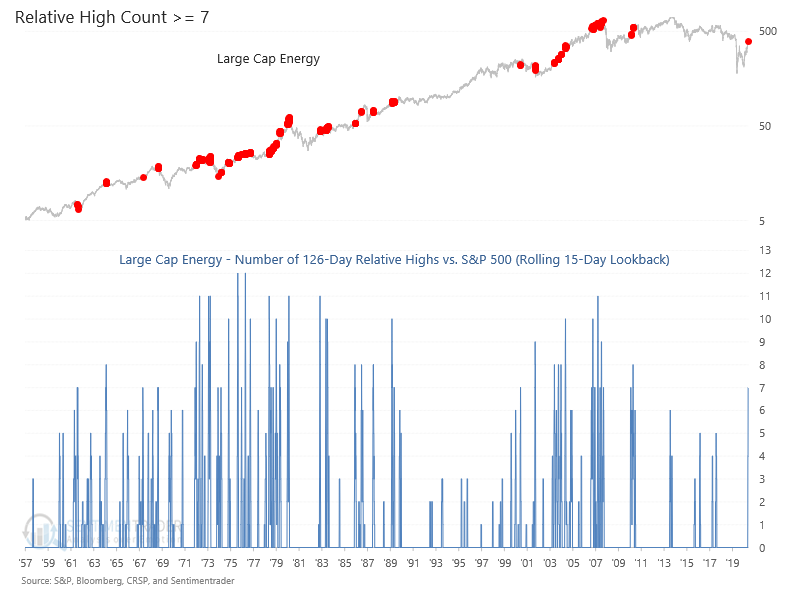
Energy Relative Highs
The following chart contains a count for the number of 126-day relative highs for large-cap energy versus the S&P 500 in a 15-day lookback period. The current count hit 7 on Friday and represents the highest level highest since 2011.
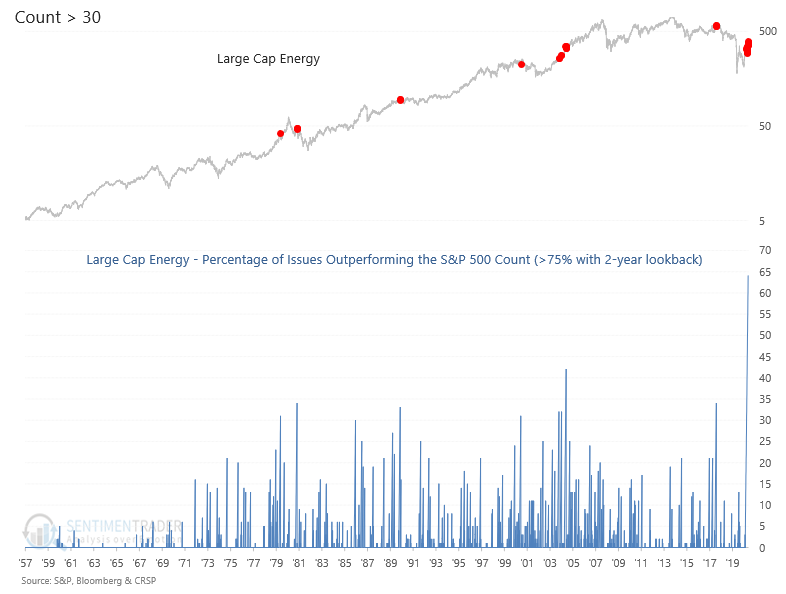
Energy Percentage of Issues Outperforming
The following chart contains the percentage of large-cap energy members outperforming the S&P 500 Index on a rolling 3-month basis and a count for when the indicator is above 75. The current count hit 64 days on Friday. As the next chart shows, that's historic.
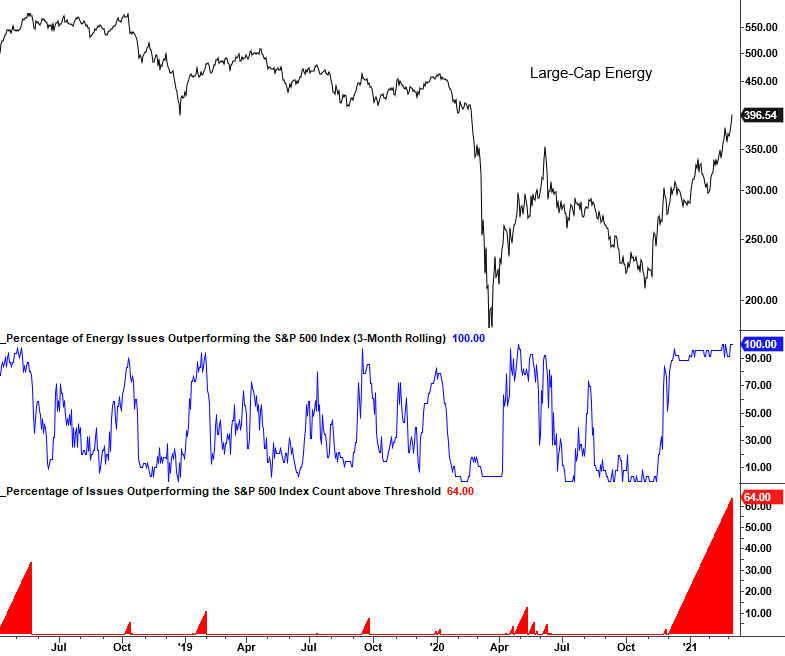
Energy Percentage of Issues Outperforming
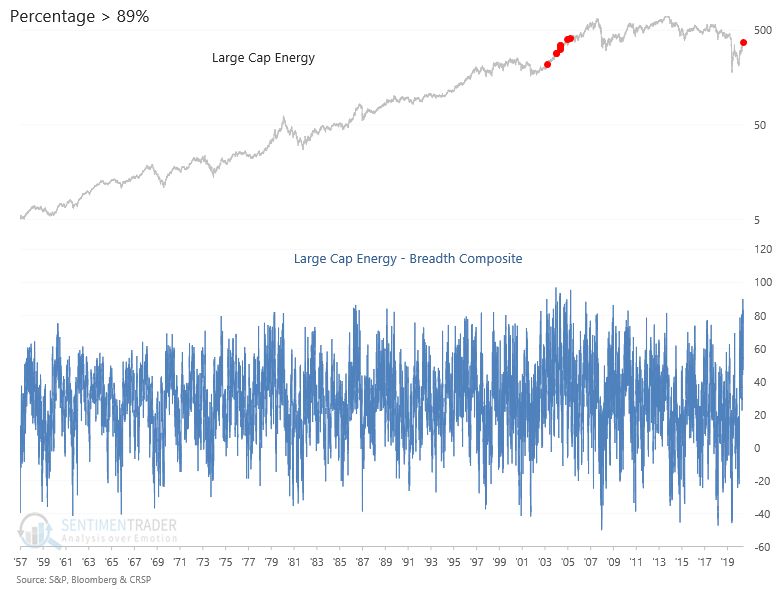
Energy Internal Participation/Momentum
A breadth composite model for large-cap energy issues recently registered the highest reading since 2006.
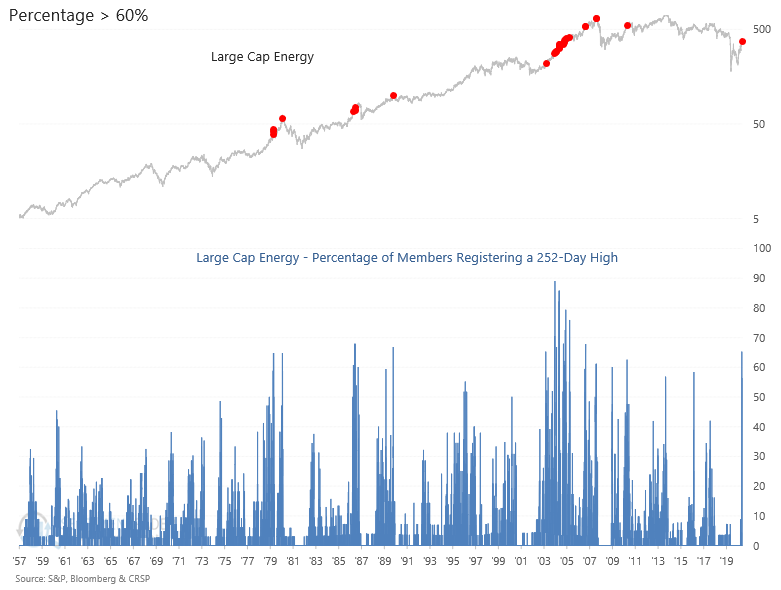
Energy New Highs
New Highs recently registered the highest reading since 2006.
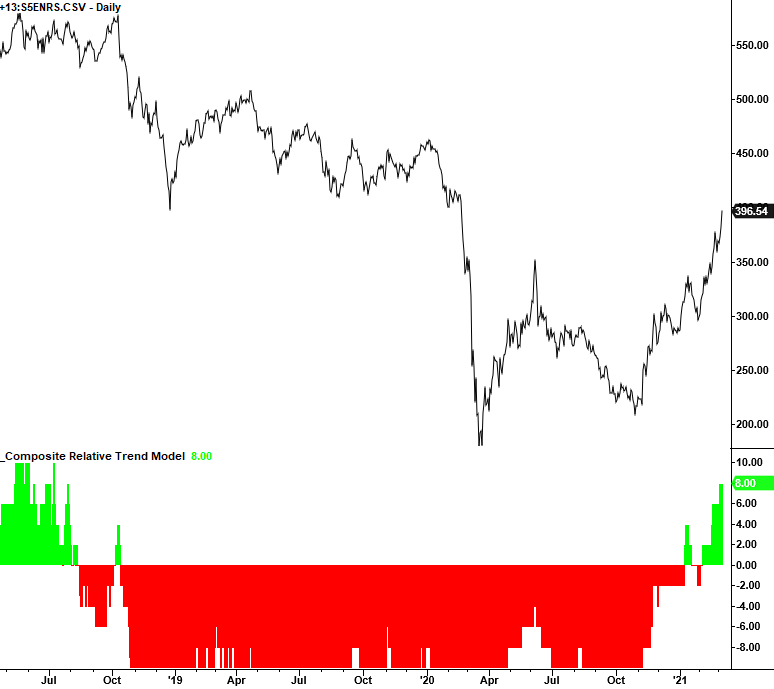
Composite Relative Strength Trend Model
A composite relative strength trend model shows 8/10 components with a positive profile.
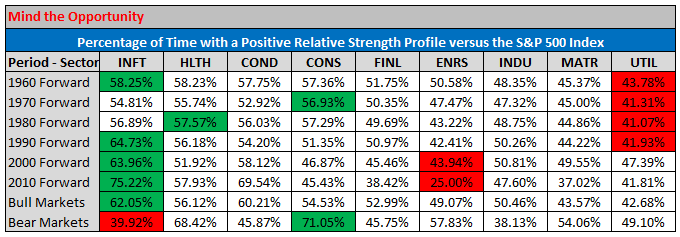
Composite Relative Strength
The following table measures the percentage of days when the composite relative trend model (see above chart) has a count of zero or greater through time. As one can see, energy does not have a great track as compared to other sectors. Sectors with political or commodity price risk are difficult to navigate as exogenous variables are often challenging to model.
Conclusion: The energy sector is exhibiting strong absolute and relative performance with one of the better risk/reward profiles in a long time. Should one choose to allocate to the energy group, I would give careful consideration to position sizing. The group is extremely volatile.