Headlines
|
|
Weekly Wrap for Mar 5 - Stocks crack along with most everything else:
This week saw some air being let out of the stock bubble, as investors rotated into financials and out of technology. This helped trigger a wide split among winners and losers. Bond and gold markets flashed more minor signs of oversold conditions.
Commitments of Traders and a big reversal: The 3-Year Min/Max Screen shows that "smart money" hedgers didn't establish any new extremes last week. Most of the moves were small and there was nothing really of note in the report. It does seem notable that indexes reversed so hard from the selling this week, especially the Nasdaq Composite. That index suffered an intraday loss of at least 1% for 4 straight days, culminating in another on Friday before reversing to close in positive territory. While it looks pretty on a chart, other times it carved out a similar pattern, it continued to gain over the next 2 weeks only 7 out of 27 times, averaging a return of -3.8%. Single-day reversals are a shaky leg upon which to lean.
Bottom Line:
See the Outlook & Allocations page for more details on these summaries STOCKS: Weak sell
The extreme speculation registered in January and February is starting to get wrung out. Internal dynamics have mostly held up, so a return to neutral sentiment conditions would improve for the forward risk/reward profile substantially. BONDS: Weak buy
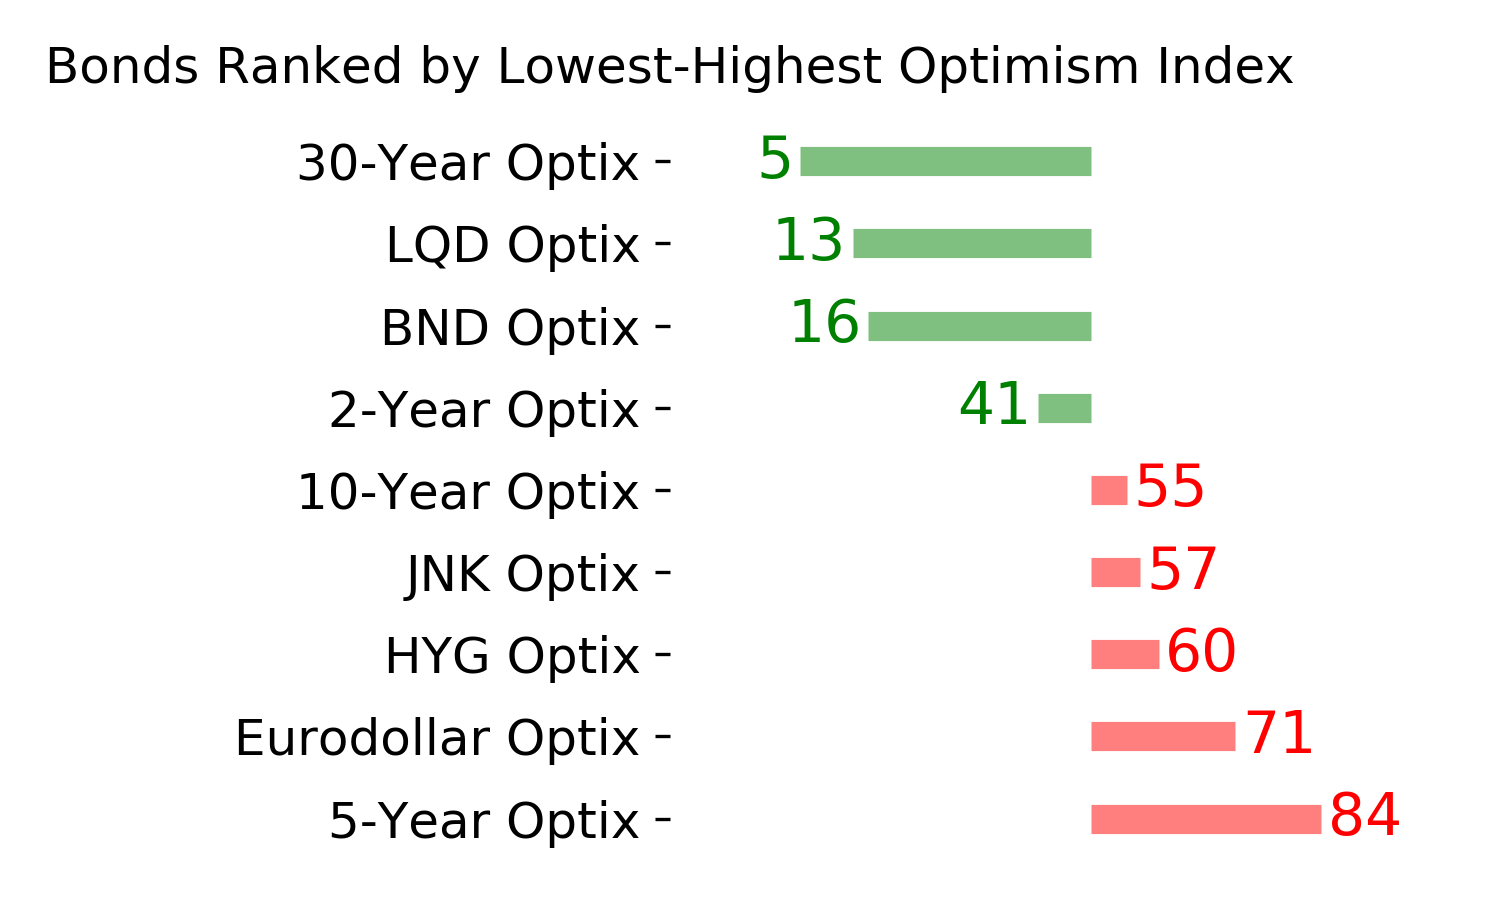
Various parts of the market have been hit in recent weeks, with mild oversold conditions. The Bond Optimism Index is now about as low as it gets during healthy bond market environments. Fixed income isn't responding well, so that needs to be monitored in case its transitioning to a longer-term negative market environment. GOLD: Weak buy
A dollar trying to rebound from a severe short position has weighed on gold and miners. The types of signals they've given in recent weeks, within the context of their recent surge, have usually resulted in higher prices over a medium- to long-term time frame. Like bonds, gold and miners aren't responding very well, and this needs to be monitored.
|
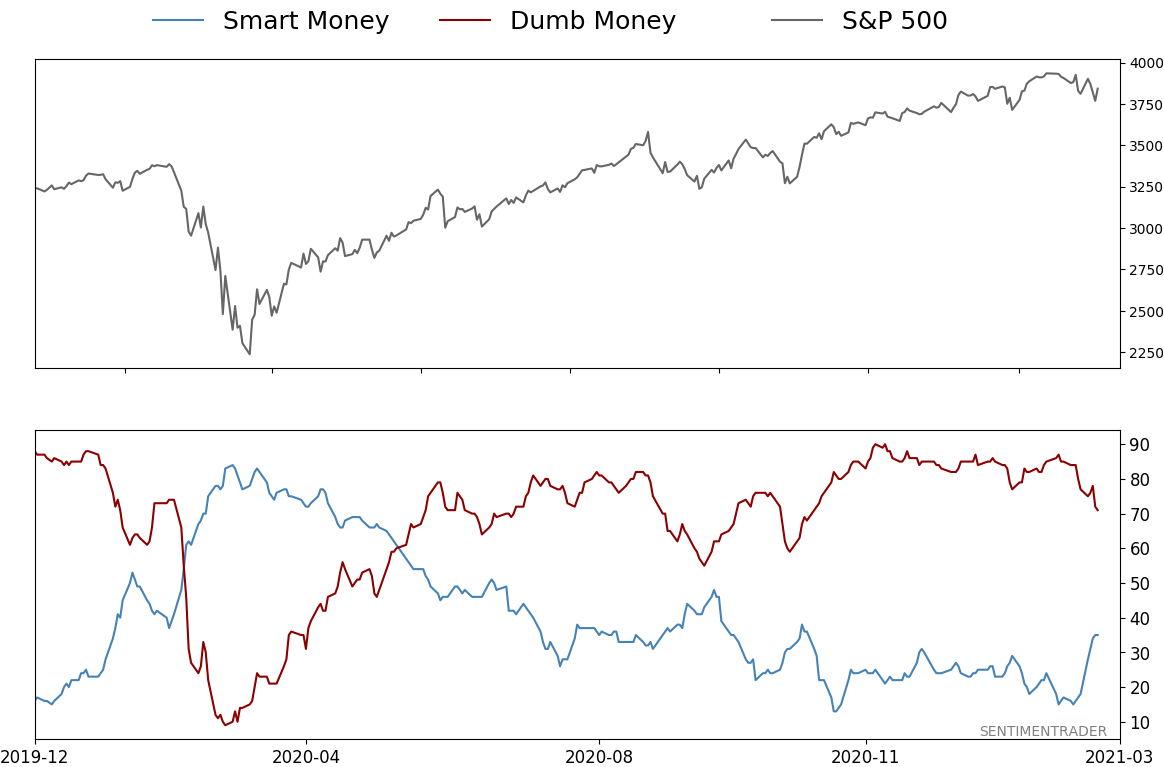
Smart / Dumb Money Confidence
|
Smart Money Confidence: 35%
Dumb Money Confidence: 71%
|
|
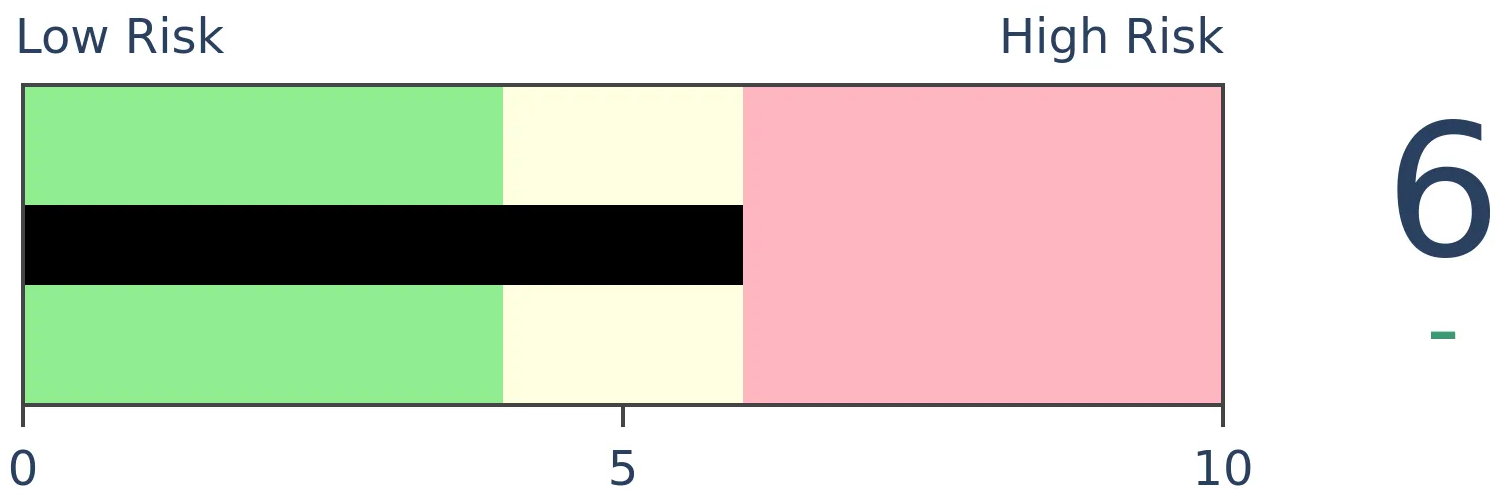
Risk Levels
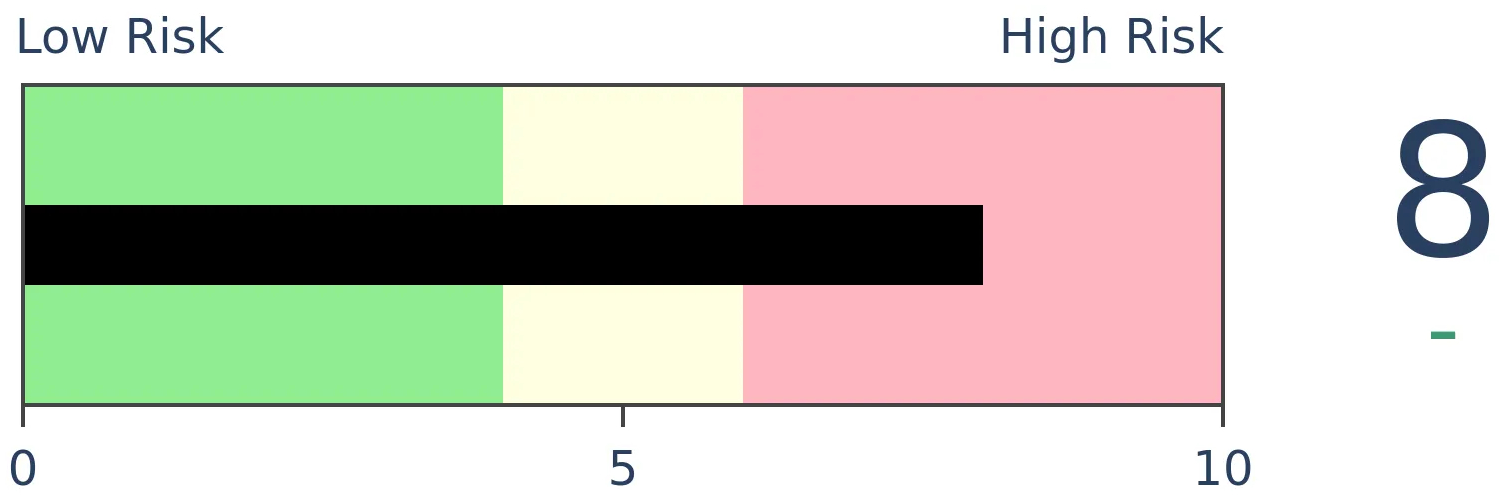
Stocks Short-Term

|
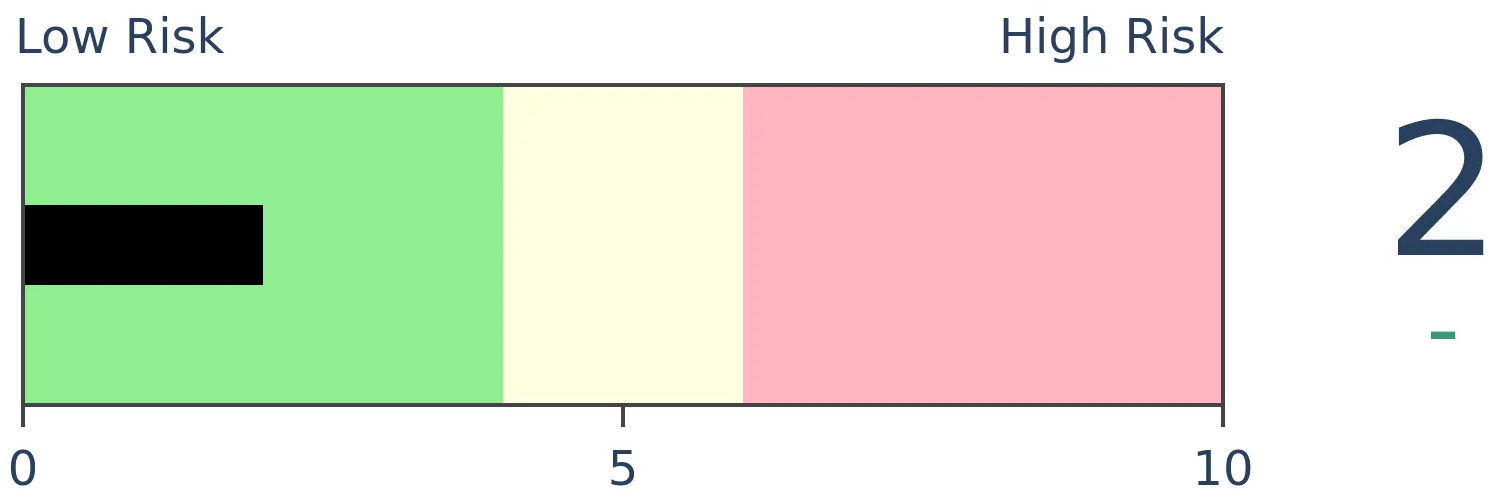
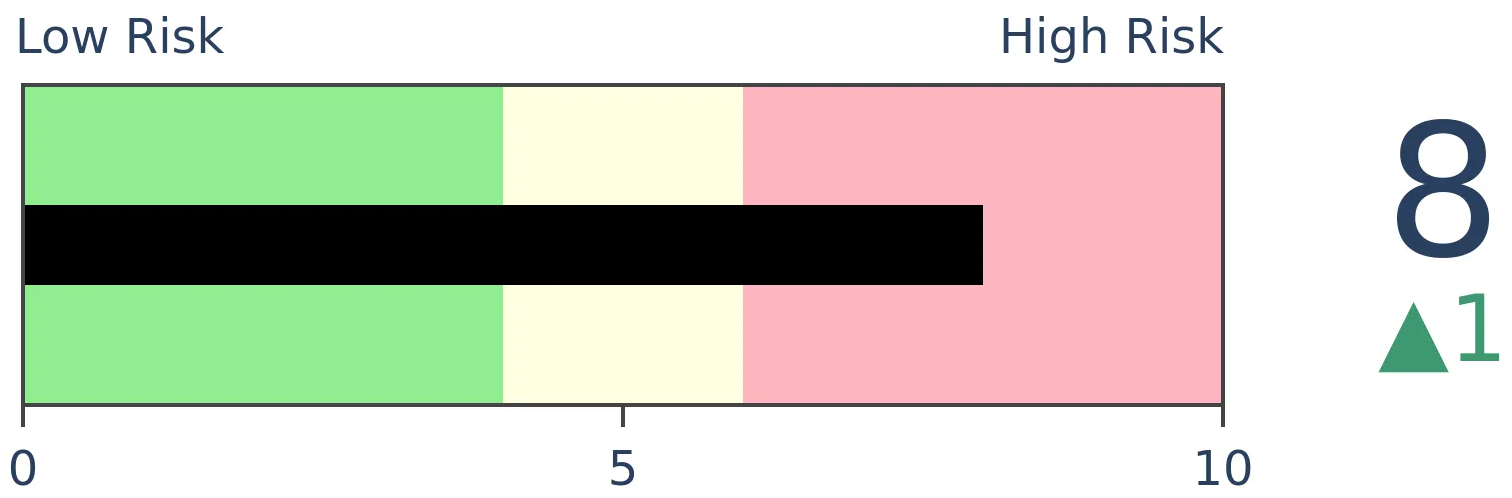
Stocks Medium-Term
|
|
Bonds
|
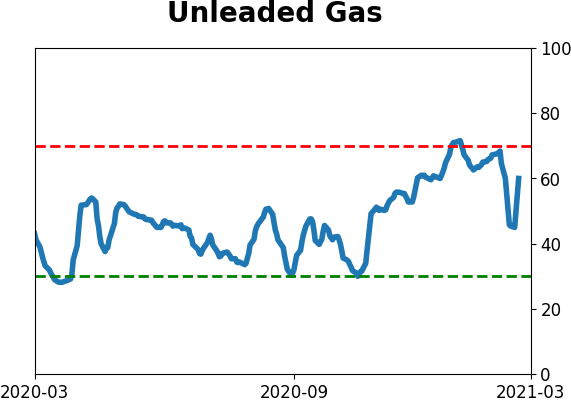
Crude Oil
|
|
Gold

|
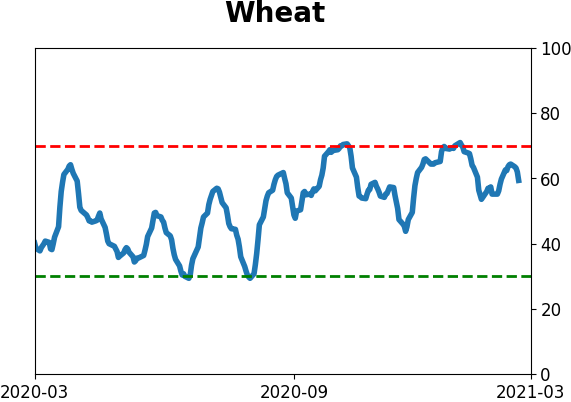
Agriculture
|
|
Research
BOTTOM LINE
This week saw some air being let out of the stock bubble, as investors rotated into financials and out of technology. This helped trigger a wide split among winners and losers. Bond and gold markets flashed more minor signs of oversold conditions.
FORECAST / TIMEFRAME
None
|
The goal of the Weekly Wrap is to summarize our recent research. Some of it includes premium content (underlined links), but we're highlighting the key focus of the research for all. Sometimes there is a lot to digest, with this summary meant to highlight the highest conviction ideas we discussed. Tags will show any related symbols and time frames related to the research.
| STOCKS |
 |
|
|
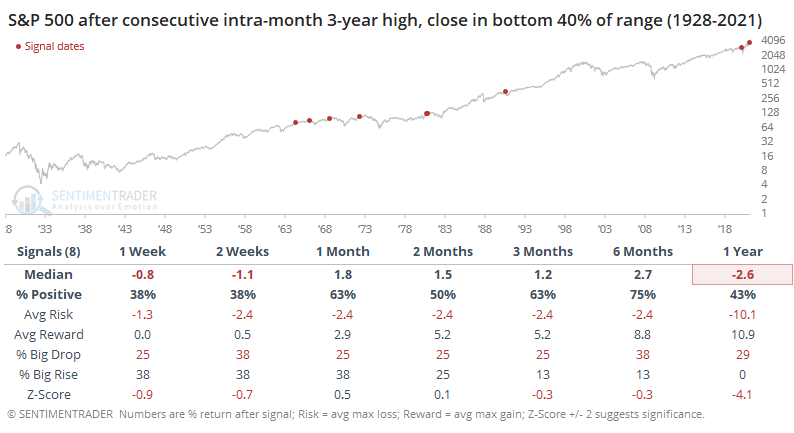
With another month in the books, stocks looked tired once again in February. Despite shooting to record highs during the month, the S&P 500 fell near month-end to close in the bottom 40% of its range just like it did in January.
While a single month showing exhaustion isn't all that unusual, it is to see it on consecutive months. When we look at similar periods, there weren't many, but returns were fairly weak.
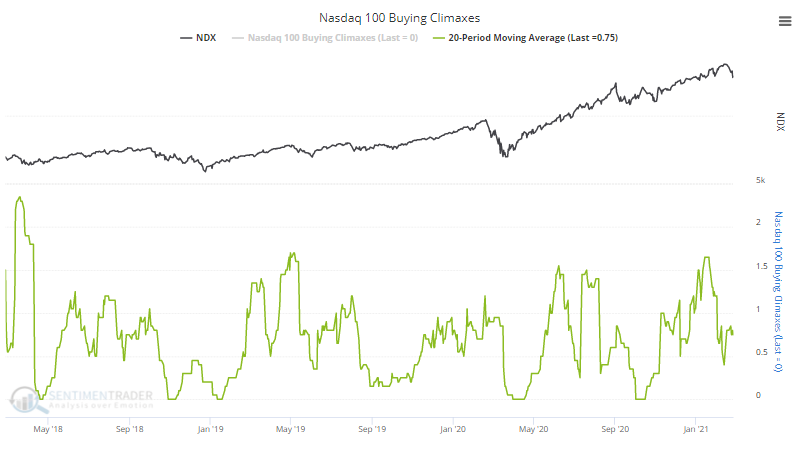
Among members of the Nasdaq 100, buying climaxes have been coming down from a fairly high level, so it was more of a concern among big tech heading into this week. We likely won't see the opposite - selling climaxes - unless tech stocks fall much further.
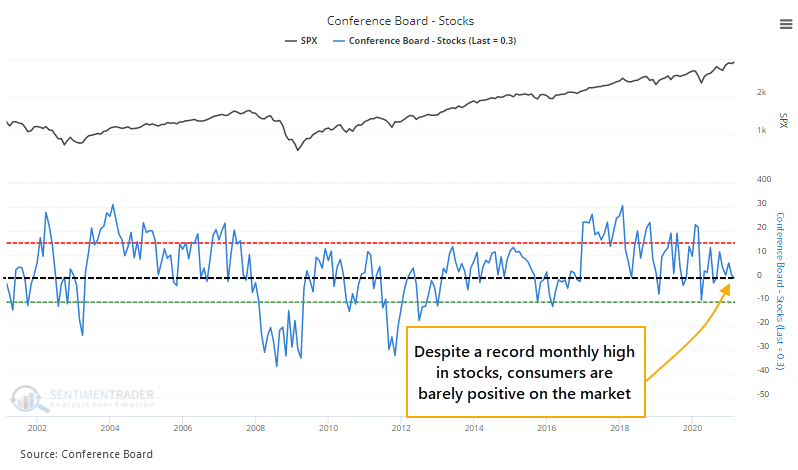
There are definite signs of speculative froth, even unbridled euphoria, among investors, but "investors" don't necessarily overlap with "consumers." The latest survey from the Conference Board showed that explicitly.
The latest results showed that almost as many consumers expect stocks to fall this year as to rise.
That has had only a middling impact on forward returns, but it's in danger of tipping into risk-off territory. Eric created a Risk-On / Risk-Off page that aggregates a broad cross-section of indicators with clear risk-on / risk-off thresholds.
He also aggregated all of the measures into one master Risk-On / Risk-Off Indicator. This is simply the percentage of indicators on that page that are currently showing risk-on behavior. Anything above 50% tends to coincide with risk-taking behavior. When it drops below 50%, that's when stocks tend to consistently struggle. Even with the selling this week, it hasn't dropped much.
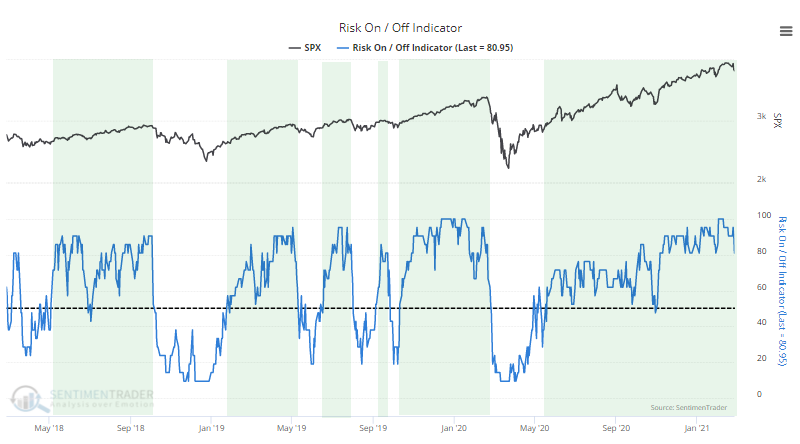
Like we've seen with so many measures lately, about the only negative here is that things have been so positive for so long, that they're less likely to lead to large, sustained gains. This aggregate has been in risk-on mode for 80 consecutive days, among the longest stretches in 20 years. It's still in risk-on mode, though, which means that if sentiment subsides enough, investors should still have a buy-the-dip mentality.
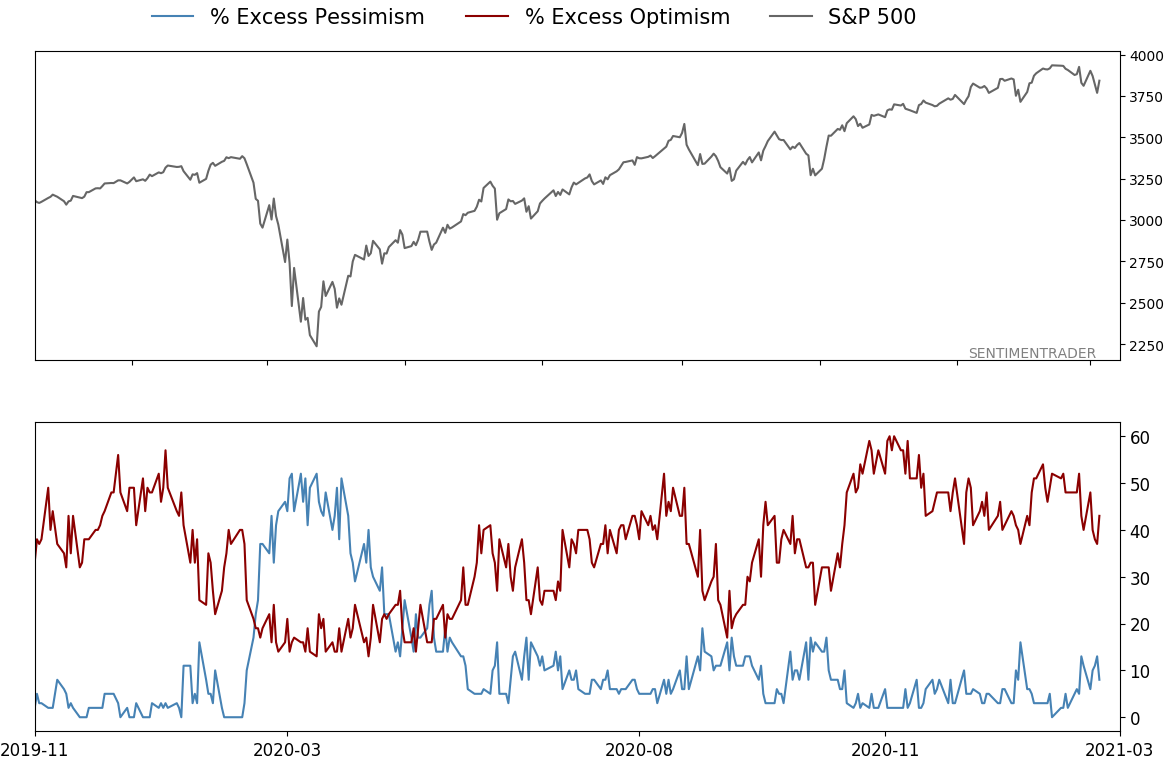
At various times over the years, we've looked at bouts of relative sentiment extremes between stocks and supposed safe havens like bonds and gold. This one sticks out as being among the most severe.
Over the past 10 days, the Medium-Term Optimism Index (Optix) for stocks has been more than 35 points above the average Optix for bonds and gold. This is the widest spread in 4 years.
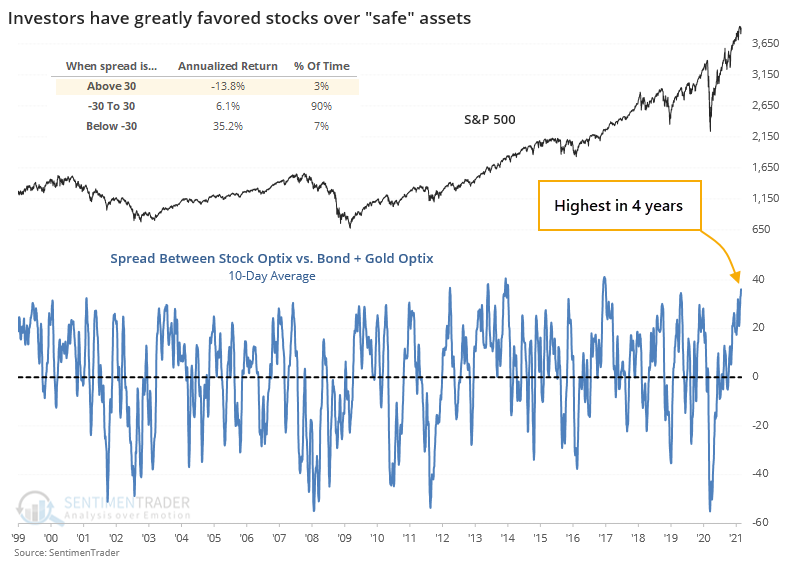
This was even more consistent than the ratio of stocks to bonds. Against gold, the S&P declined more consistently over the medium-term.
Jay highlighted another warning sign, the big split between new highs and new lows on the Nasdaq. In the most general terms possible:
- A lot of stocks making new highs and few making new lows = Bullish
- A lot of stocks making new lows and few making new highs = Bullish
- A lot of stocks making new highs and a lot of stocks making new lows = Bearish
The latter scenario suggests that the market is churning, typically an important warning sign of a market in transition from bull to bear. While the indexes may continue to move sideways to slightly higher, under the hood things are deteriorating.
The HiLo Logic Index was developed by Norman Fosback and was based on the NYSE. It's spiking there, too, but rose especially high on the Nasdaq. On that exchange, the HiLo Logic Index spiked to 4%, meaning that a minimum of 4% of issues were at either a 52-week high or a 52-week low.
The chart below displays those times when the indicator registered a 1-day reading in excess of 4%.
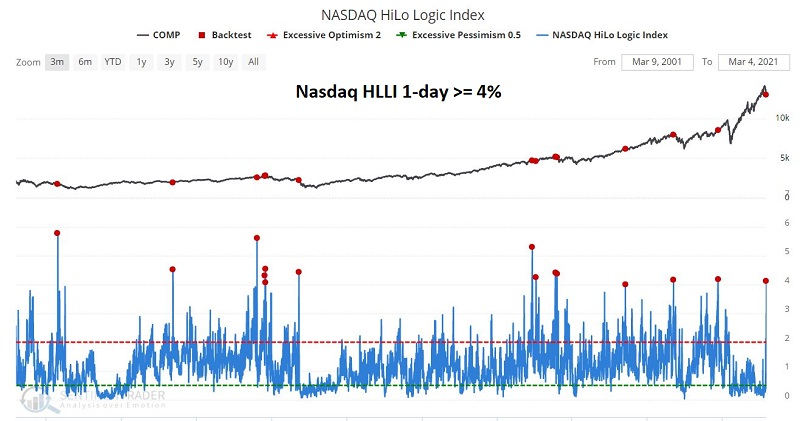
The table below shows that average forward results after a 1-day reading above 4% have been negative across every time frame. To run this test, click here.
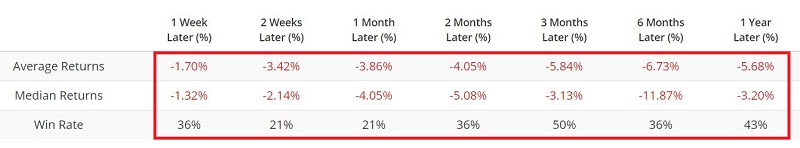
It got even worse on Thursday, with a minimum of more than 3.5% of issues on both the NYSE and Nasdaq hitting either a 52-week high or low.
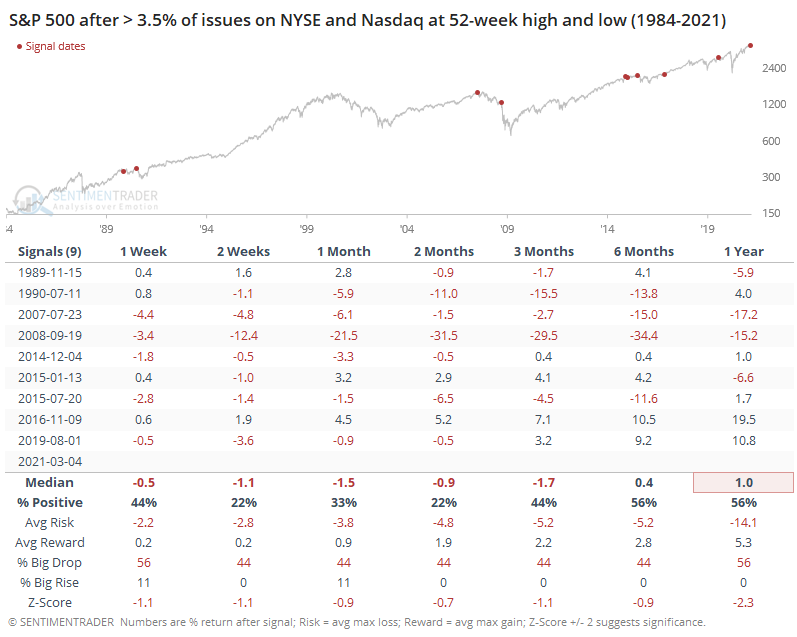
A lot of the 52-week lows were SPACs, but there is always an excuse when we see a split like this. We could excuse other periods because "it's only energy stocks" or "it's only rate-sensitive issues" but we've never had much success trying to consistently outsmart the indicators.
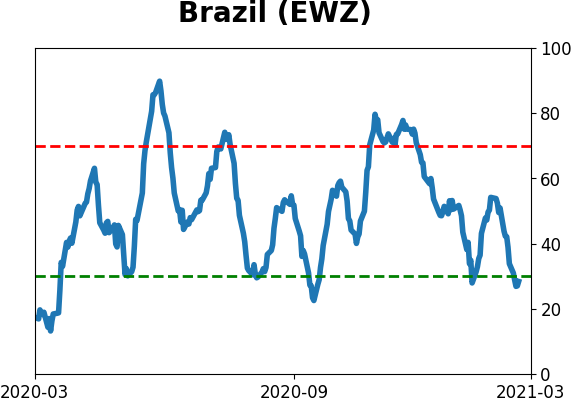
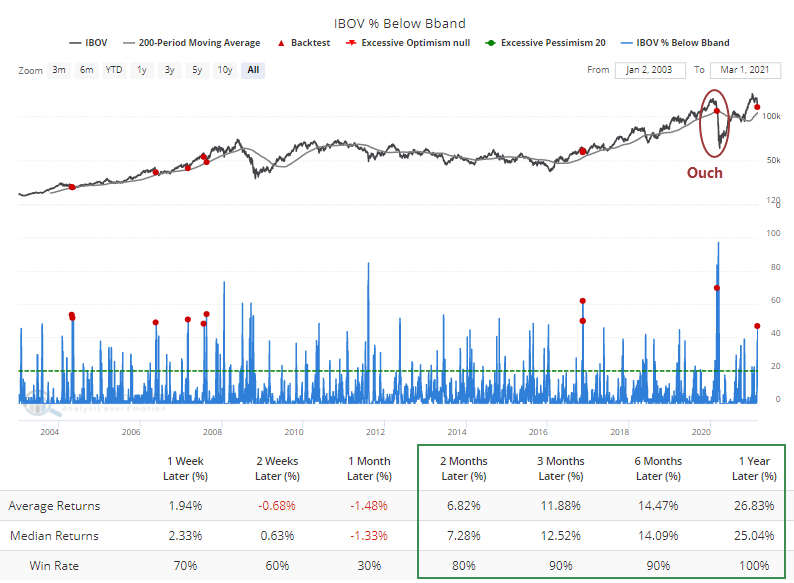
Among sectors or other funds, the EWZ fund tried to stage a reversal after some intense selling pressure.
By Monday, enough stocks within the Ibovespa had suffered selling that nearly 30% of them were oversold. That's almost the most in nearly 20 years when the index was still trading above its 200-day average. The Backtest Engine shows that the 2 other signals preceded medium- to long-term gains.
The quick decline was also enough to push more than 40% of them outside of their lower volatility bands. Again, one of the most we've seen during an uptrend, though the last one triggered right before a very painful dip-buying experience. Out of the 10 signals, 9 of them led to gains over the next 3 months per the Engine.
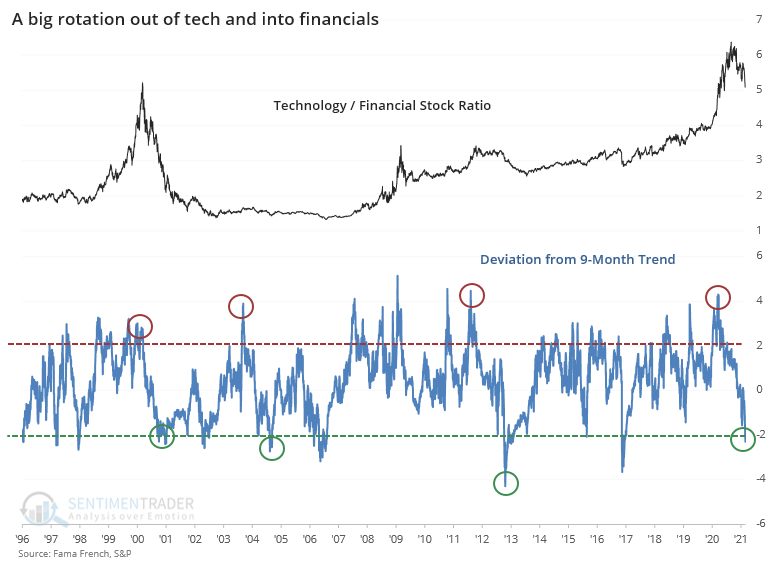
Thanks to investors resetting their view on interest rates, there has been a swift and meaningful rotation out of technology stocks and into financials. It has only increased in intensity in recent days.
When looking at the ratio between the two sectors, it has now cycled from being more than 2 standard deviations above its 9-month trend to 2 standard deviations below.
Forward returns for the S&P were fine, even a bit above random over the medium-term. Nothing much to see here.
It was more consistent as an indicator for the ratio between the sectors, as tech stocks tended to keep underperforming relative to financials when there were similar resets.
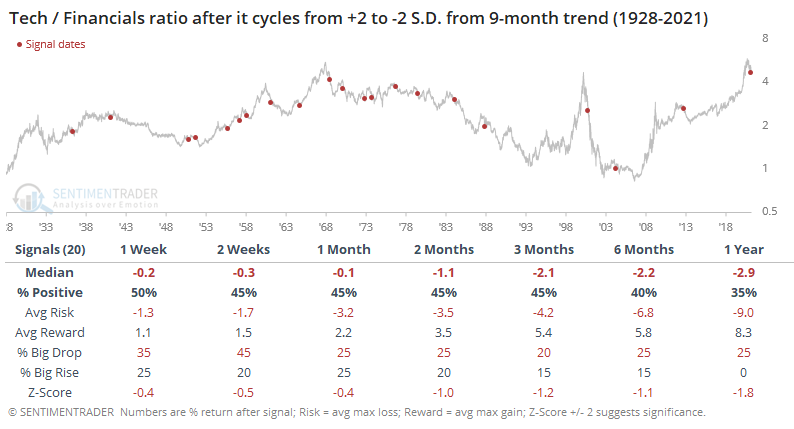
This suggests that the underlying fundamental shift that has triggered this reset in expectations is much more likely to keep going, favoring financial stocks over technology-related stocks, than it is to revert to its prior trend.
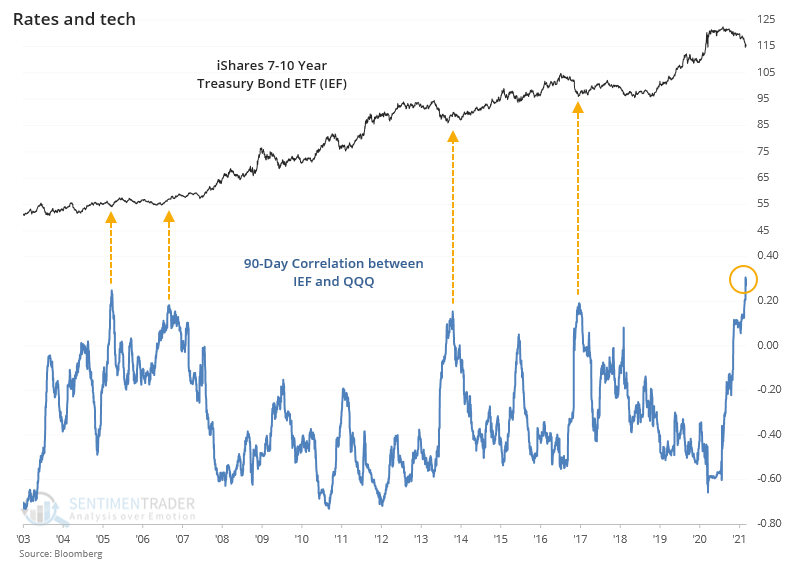
The Daily Shot newsletter highlighted the recent theme of tech stocks being driven by moves in intermediate-term Treasuries. He noted that the 90-day correlation between daily changes in QQQ and IEF had spiked to a recent high.
Indeed, it's the highest since the inception of the fund nearly 20 years ago. While most would like to use this heightened correlation as a sign for tech stocks, it was more consistent as a sign for IEF, which rallied after other extremely high correlations.
| COMMODITIES |
|  |
|
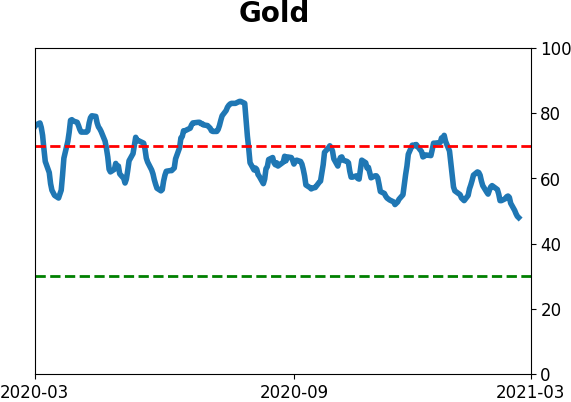
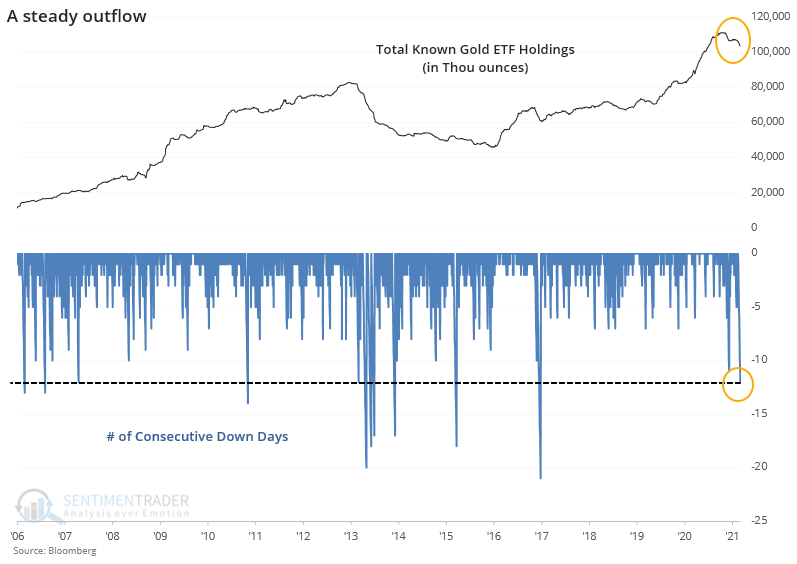
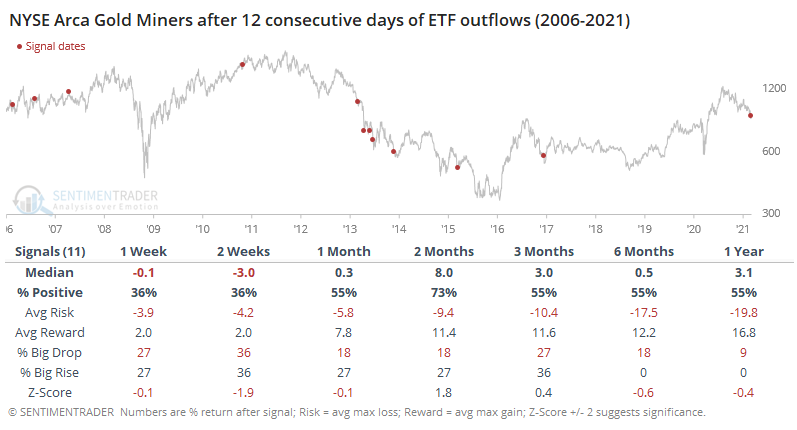
Gold just keeps getting hammered, it can't hold a rally, and traders are getting fed up. For the past 12 consecutive sessions, they've pulled assets from gold funds. That's the longest streak of outflows in several years.
Miners tend to be volatile, and that showed in the returns. Shorter-term returns were weaker, but over the next couple of months, miners performed better, with some great gains seen after the most recent signals.
Jay noted a seasonal tendency in the British pound.
In the chart below:
- The blue line displays the average annual seasonal tendencies for the British Pound
- The dark red line displays the price action for the pound so far this year
- The red box highlights trading day of Year #39 through #50
- The green box highlights trading day of Year #50 through #86
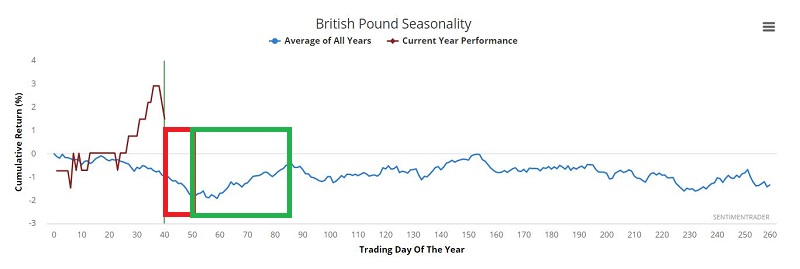
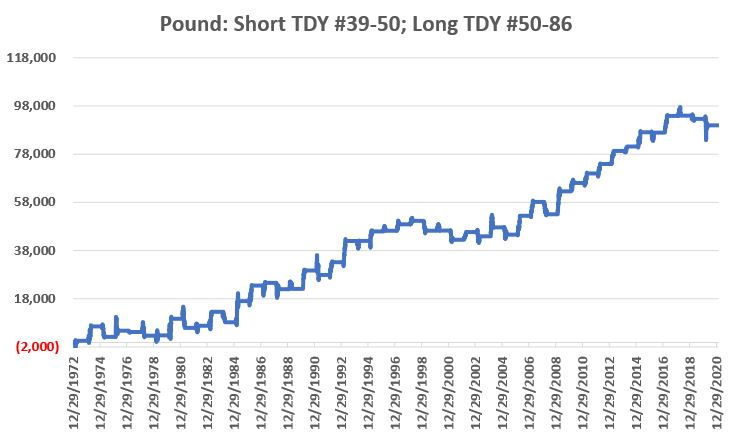
The long-term tendency is clear - the pound tends to show weakness during the first period, then "boomerangs" to move higher during the second period. To further illustrate this, let's test the following strategy (TDY = Trading Day of the Year):
- Short 1 British Pound futures from TDY #39 through TDY #50
- Long 1 British Pound futures from TDY #50 through TDY #86
The chart below displays the hypothetical cumulative dollar gain or loss achieved by holding a short 1-lot of pound futures during the first period and a long 1-lot position of pound futures during the second period every year since 1973.
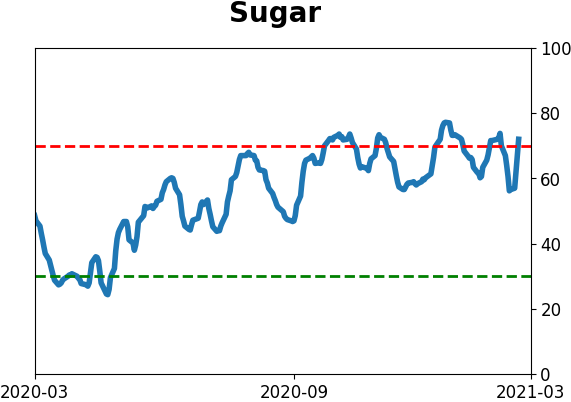
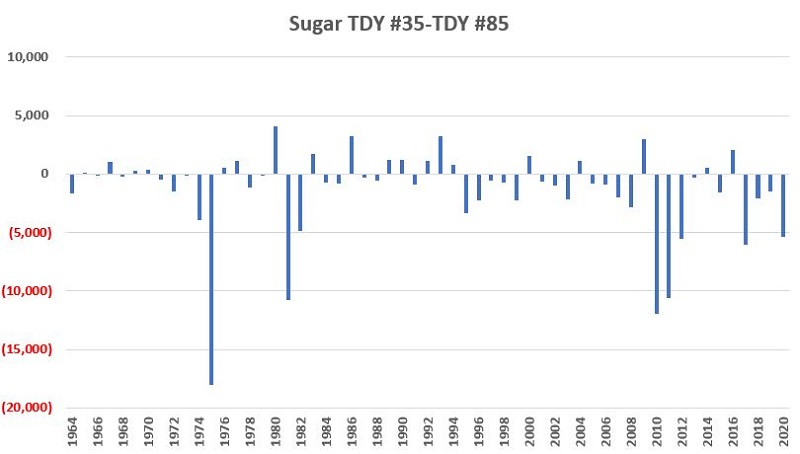
He also pointed out the seasonal tendency in sugar.
The period between Trading Day of the Year #35 and Trading Day of the Year #86 has historically been a period of weakness for sugar prices. While sugar futures have been quite strong so far in 2021, they appear to have topped out right on schedule. Whether a further decline is in the offing this time around remains to be seen. But the results below suggest that the long-term odds favor the more bearish trader.
The chart below displays the hypothetical $ +(-) achieved by holding a long 1-lot position in sugar futures ONLY during this seasonally unfavorable period each year since 1964.
Active Studies
| Time Frame | Bullish | Bearish | | Short-Term | 0 | 0 | | Medium-Term | 2 | 8 | | Long-Term | 16 | 3 |
|
Indicators at Extremes
Portfolio
| Position | Description | Weight % | Added / Reduced | Date | | Stocks | RSP | 4.9 | Reduced 4% | 2021-02-09 | | Bonds | 30.0% BND, 8.8% SCHP | 38.8 | Added 15.1% | 2021-02-18 | | Commodities | GCC | 2.3 | Reduced 2.1%
| 2020-09-04 | | Precious Metals | GDX | 9.0 | Added 0.1% | 2021-02-18 | | Special Situations | 7.3% XLE, 4.8% PSCE | 12.1 | Reduced 5.6% | 2021-02-18 | | Cash | | 32.8 | | |
|
Updates (Changes made today are underlined)
With a market that has seen the kinds of broad participation and big breath thrusts like we did in the fall, it's hard to become too negative. Those kinds of conditions have consistently preceded higher returns over the next 6-12 months. It's the interim that's more of an issue. Even conditions like that haven't prevented some shorter-term pullbacks. And when we combine an environment where speculation is rampant and recent days have seen an increase in cracks under the surface of the indexes, it's enough to become more defensive over a short- to medium-term time frame. We still don't have much confirmation from the price action in the indexes, so those who are more conservative would likely wait before increasing cash levels. I've decreased risk exposure a bit more, mainly in terms of energy stocks and the ANGL fund, while adding more to the broader bond market. RETURN YTD: 6.7% 2020: 8.1%, 2019: 12.6%, 2018: 0.6%, 2017: 3.8%, 2016: 17.1%, 2015: 9.2%, 2014: 14.5%, 2013: 2.2%, 2012: 10.8%, 2011: 16.5%, 2010: 15.3%, 2009: 23.9%, 2008: 16.2%, 2007: 7.8%
|
|
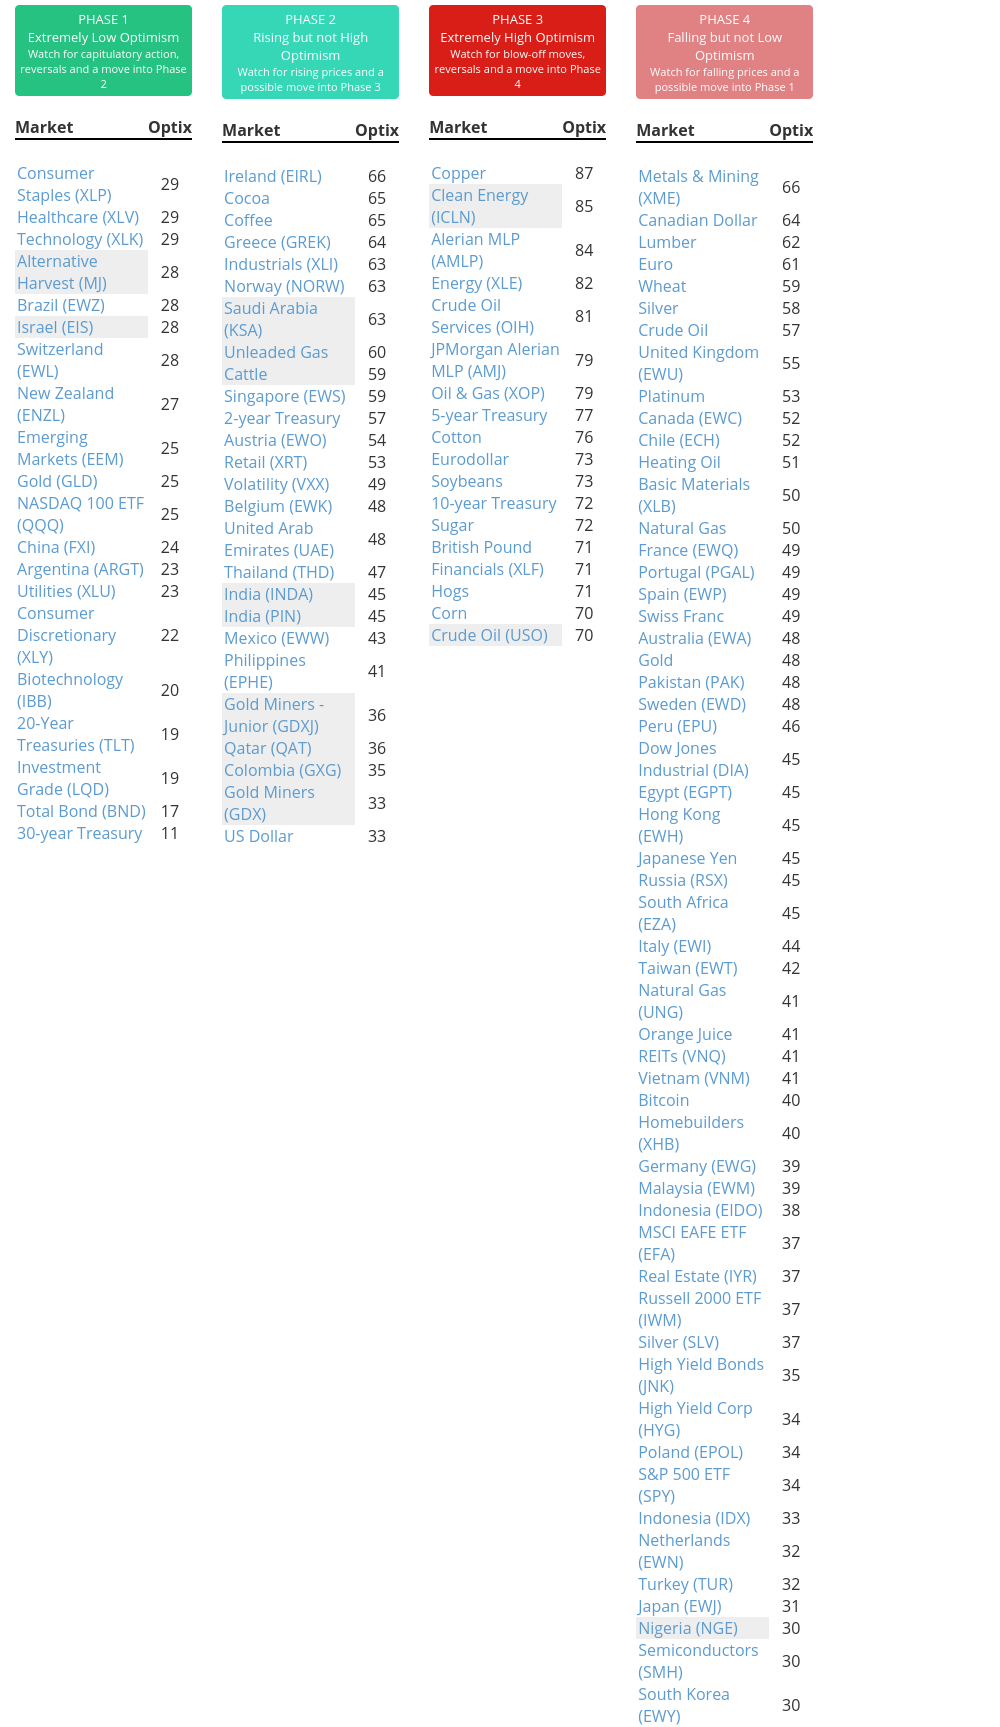
Phase Table
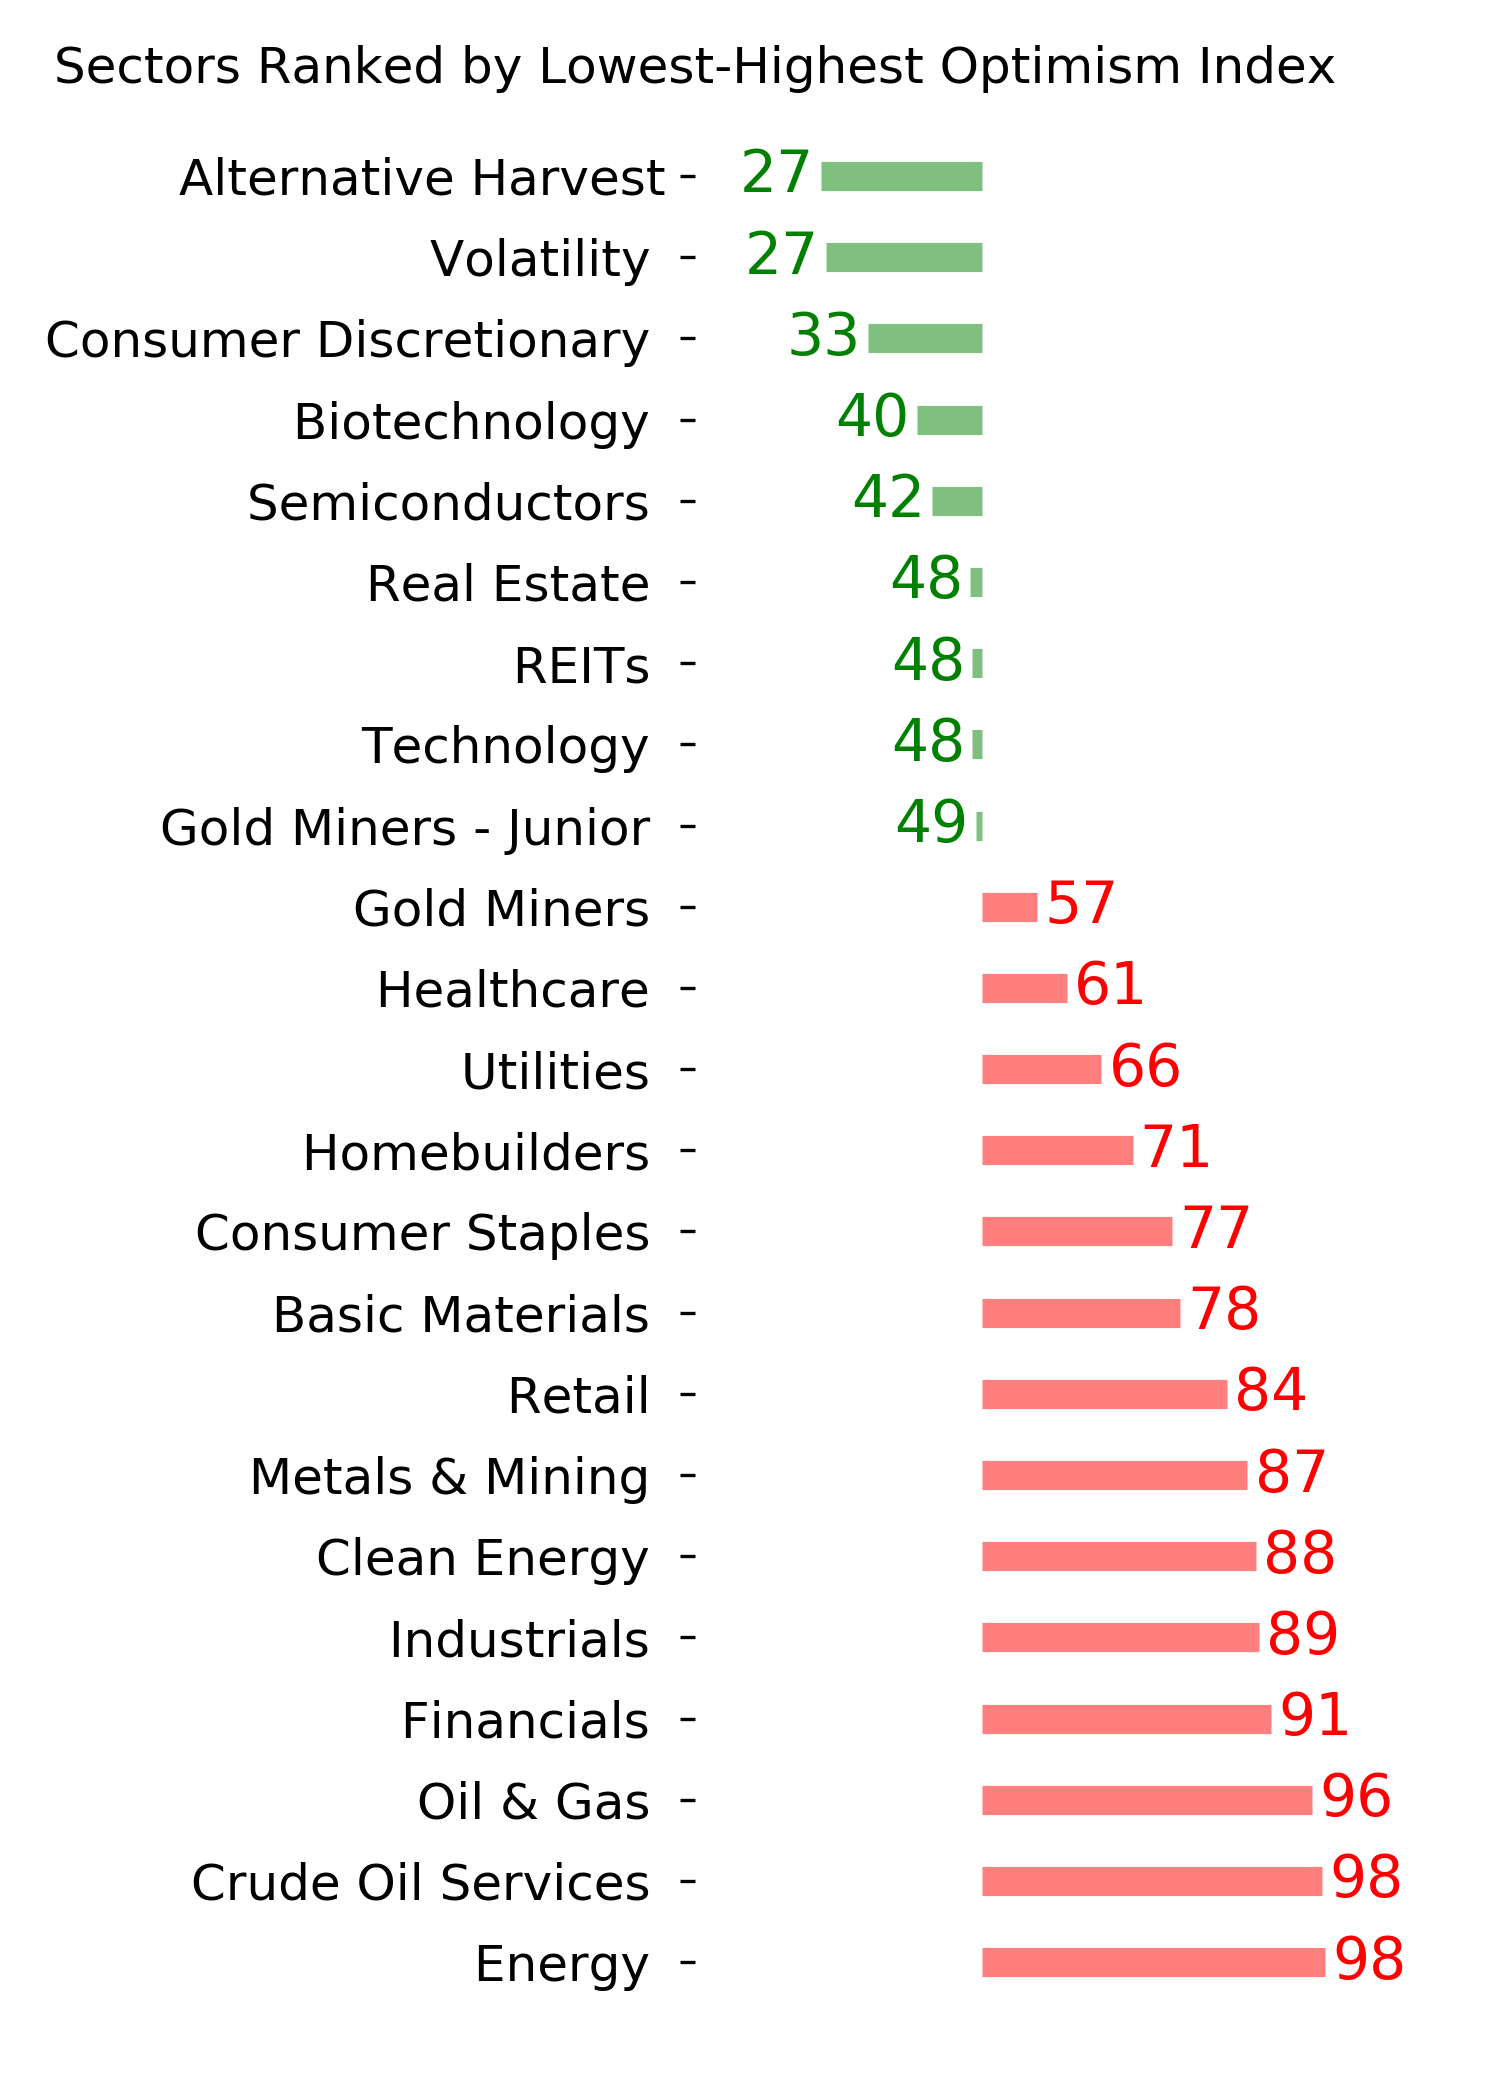
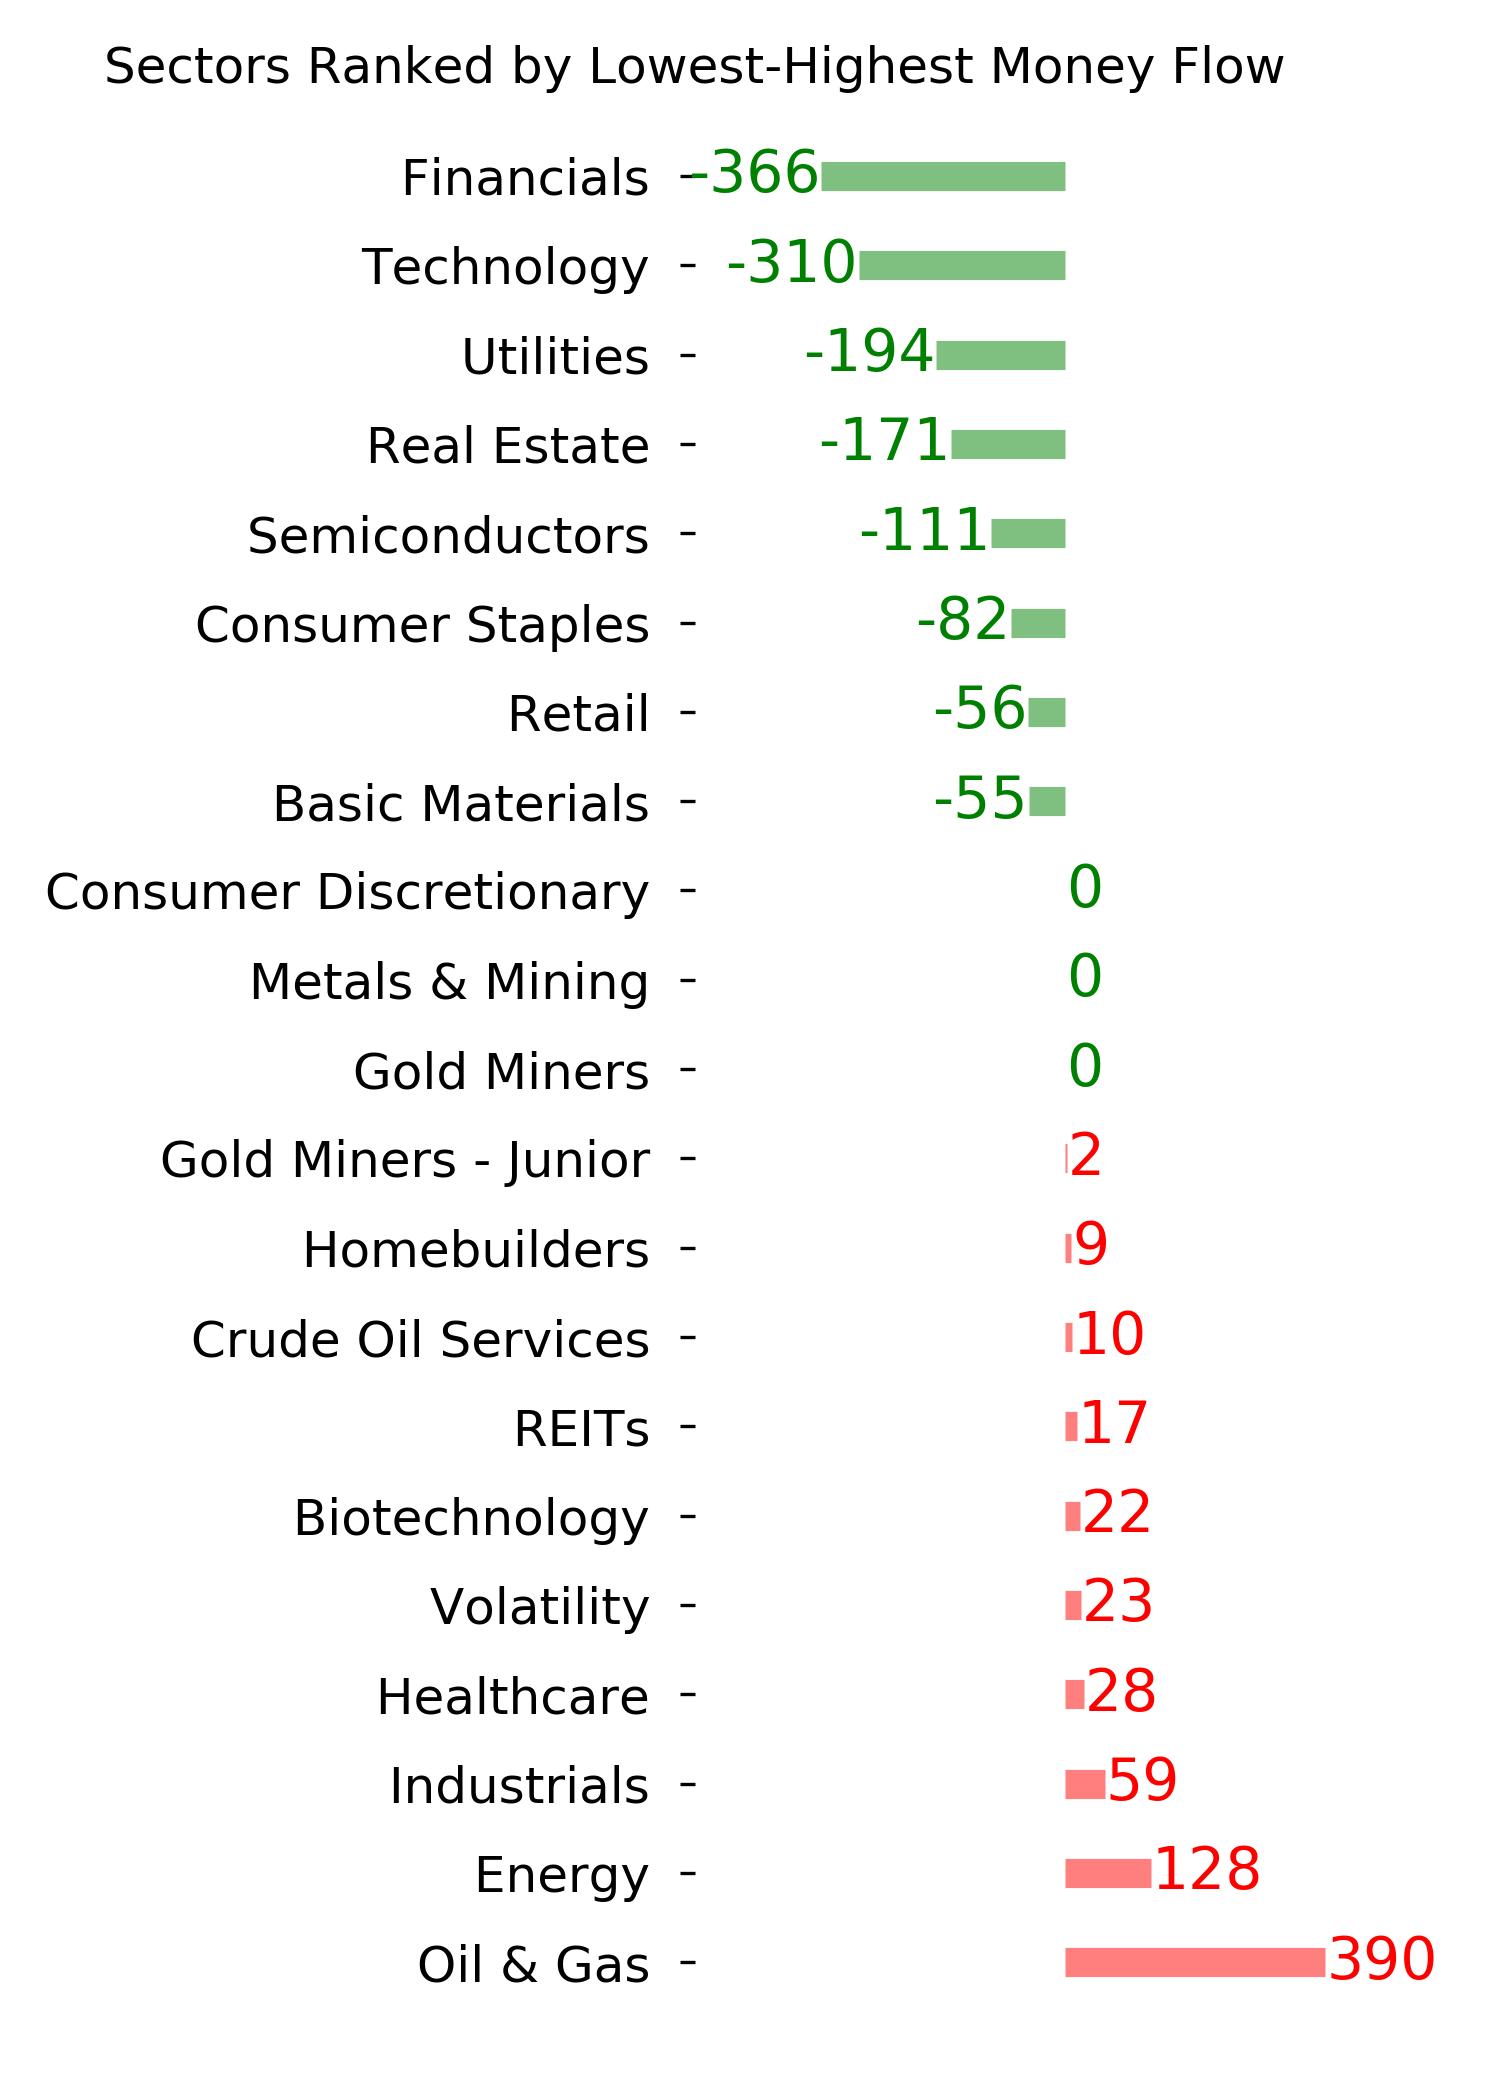
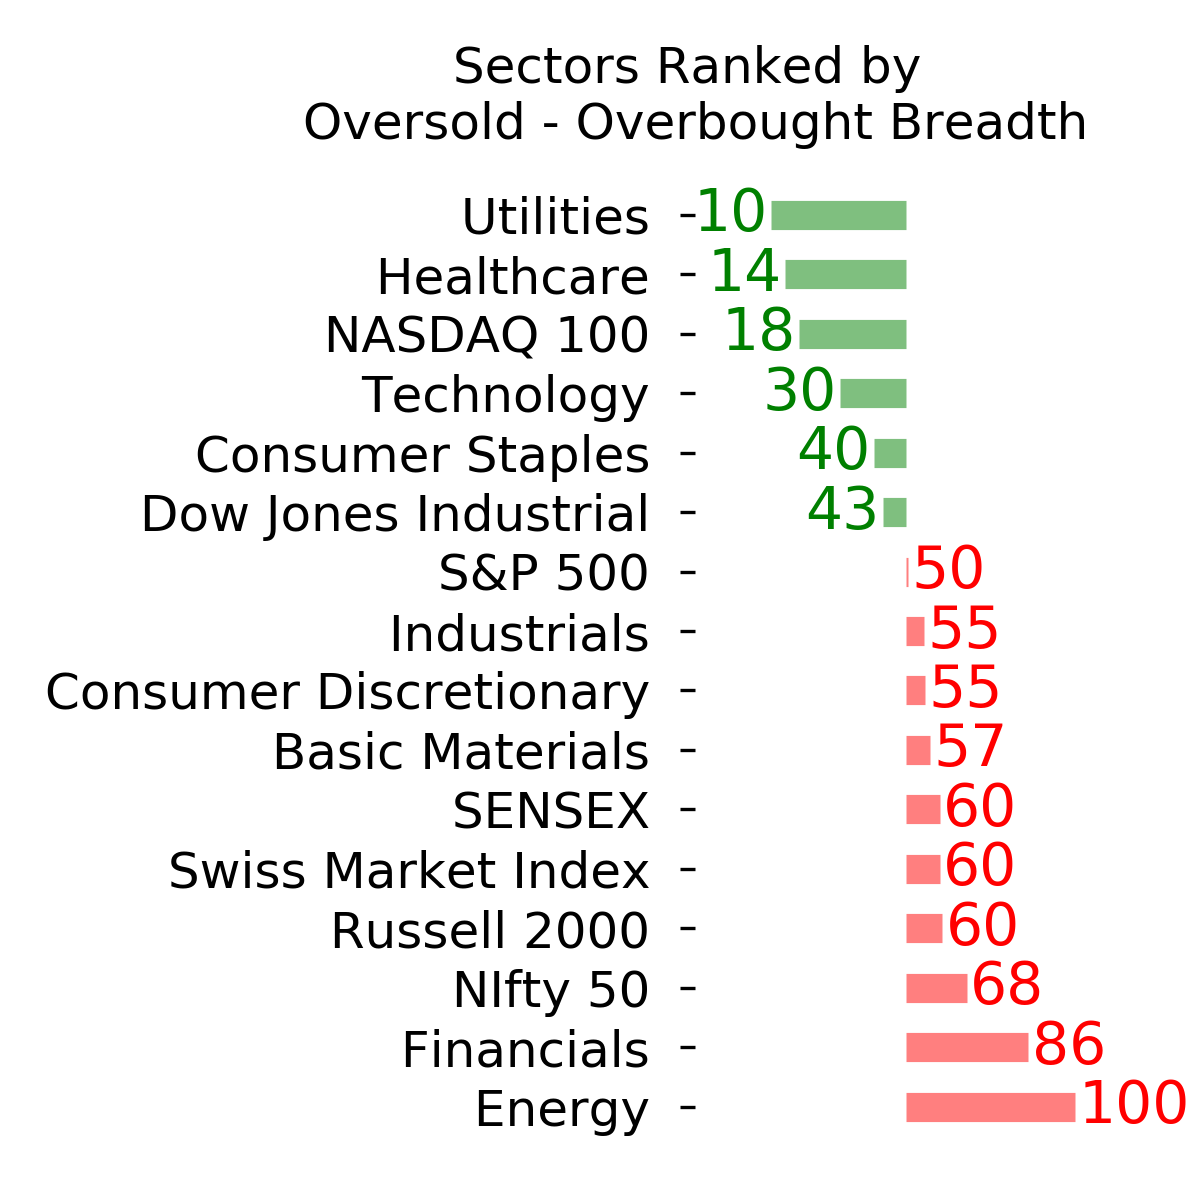
Ranks
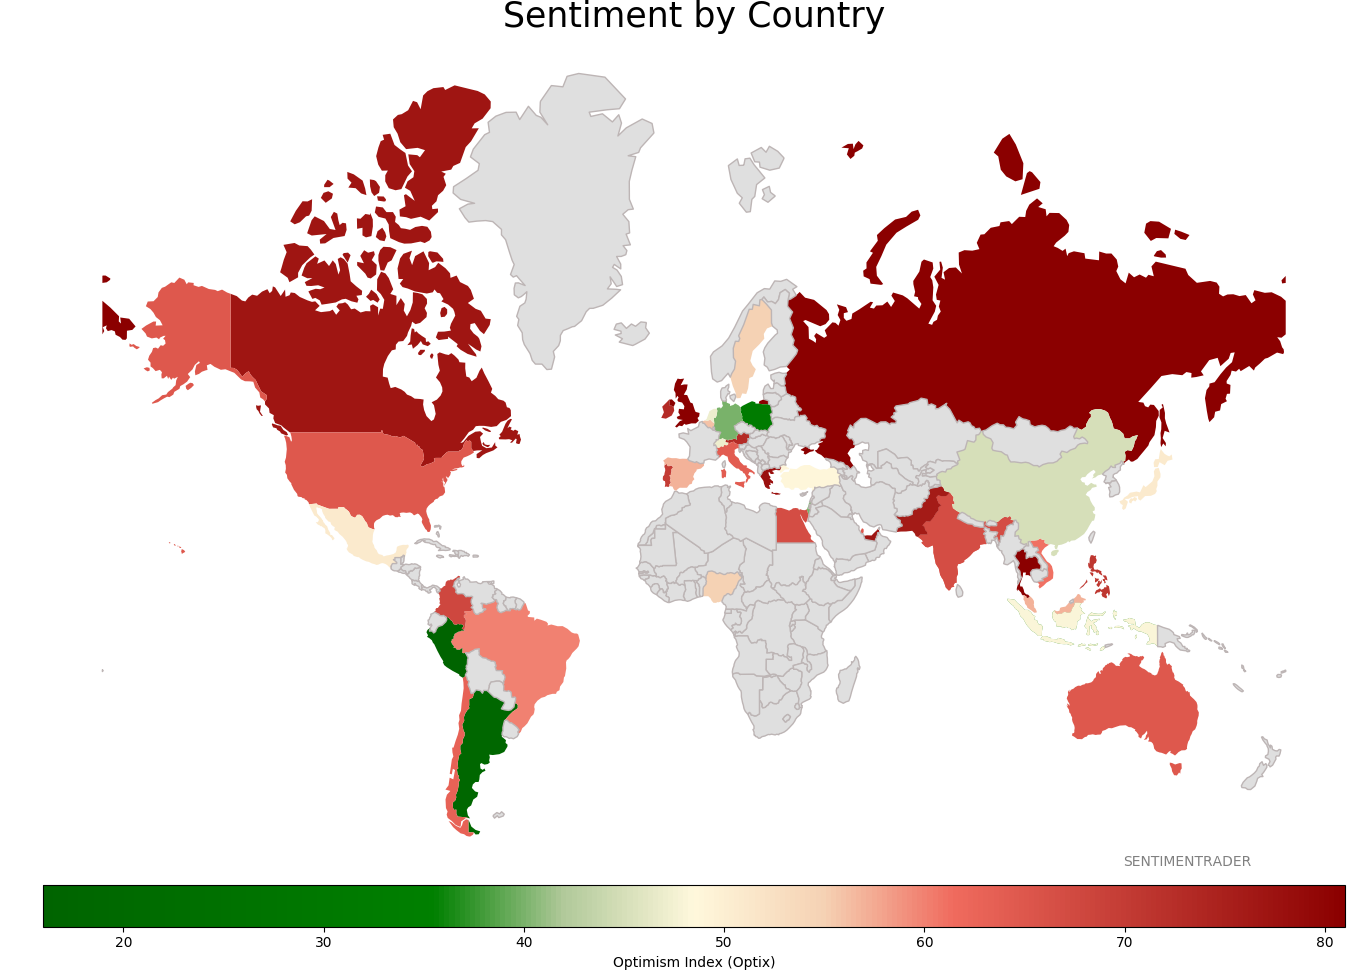
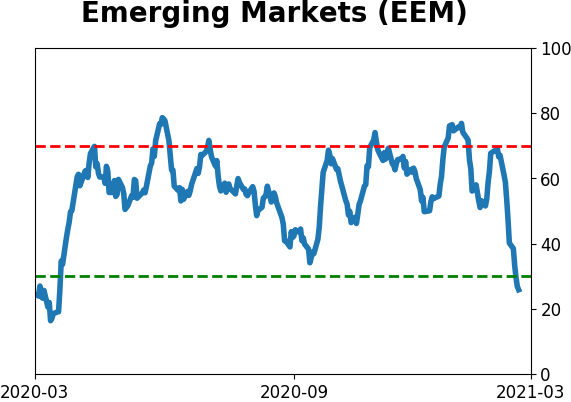
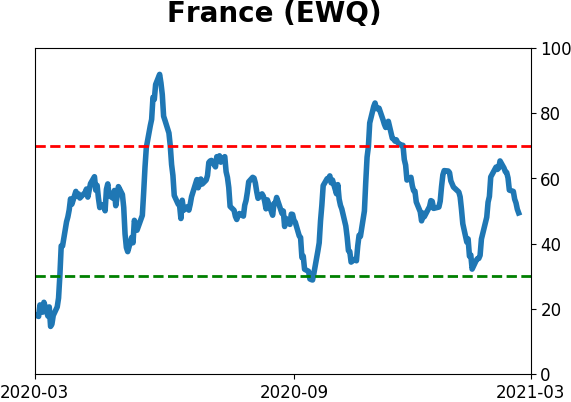
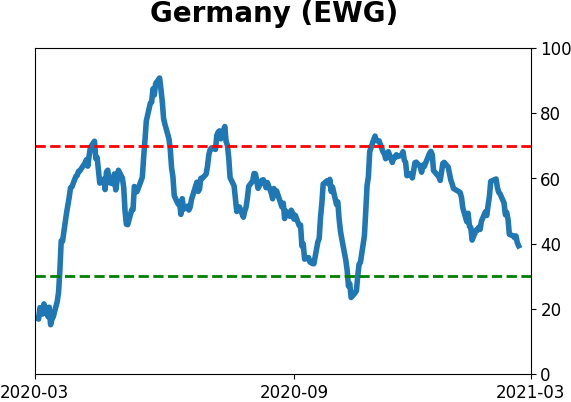
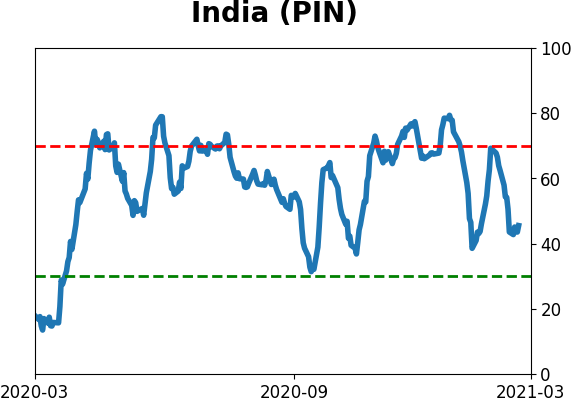
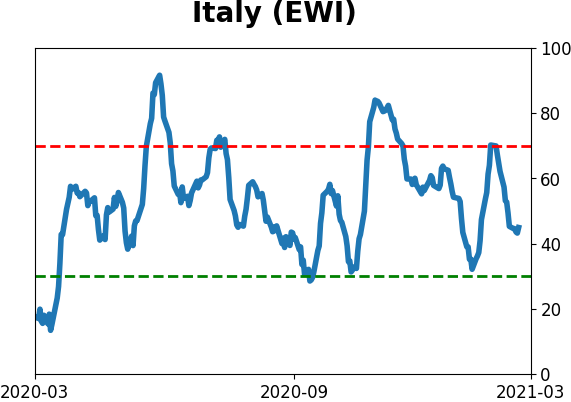
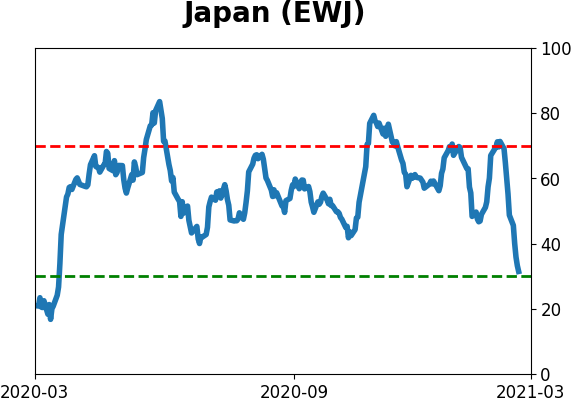
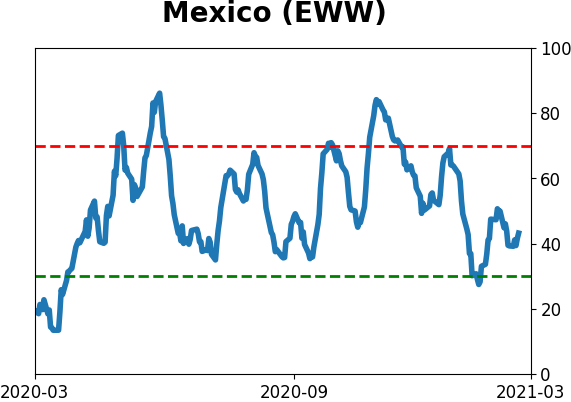
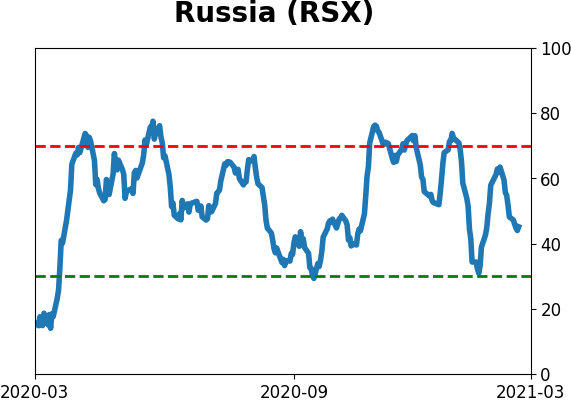
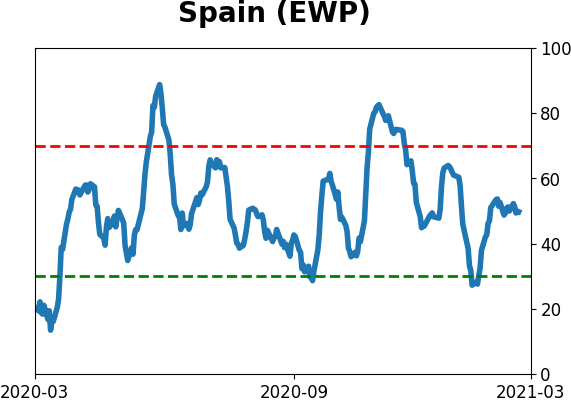
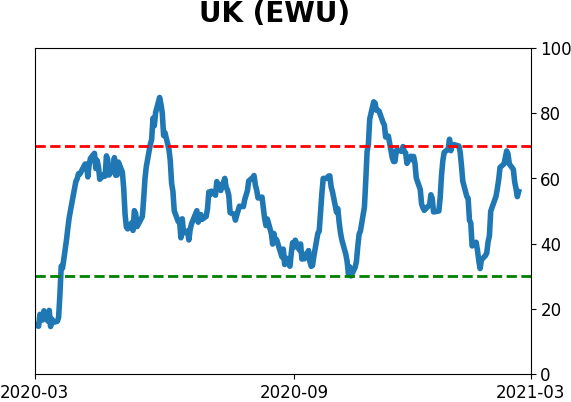
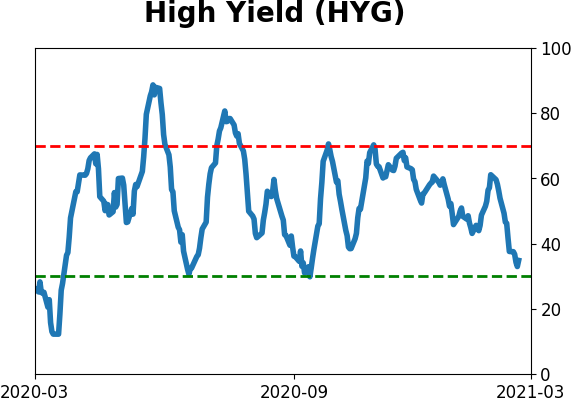
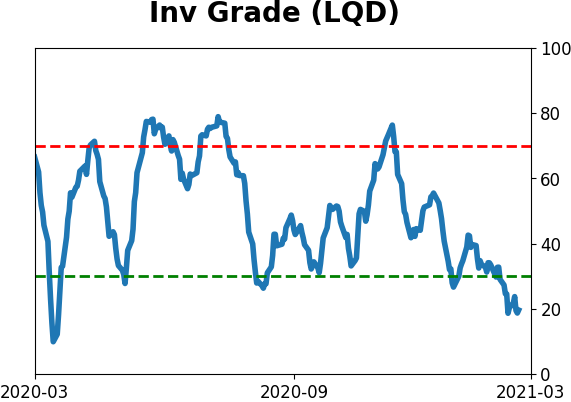
Sentiment Around The World
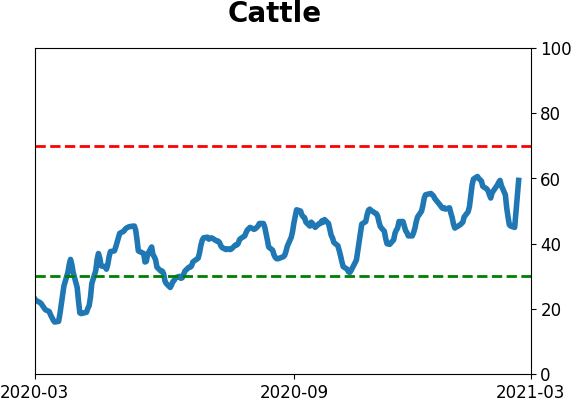
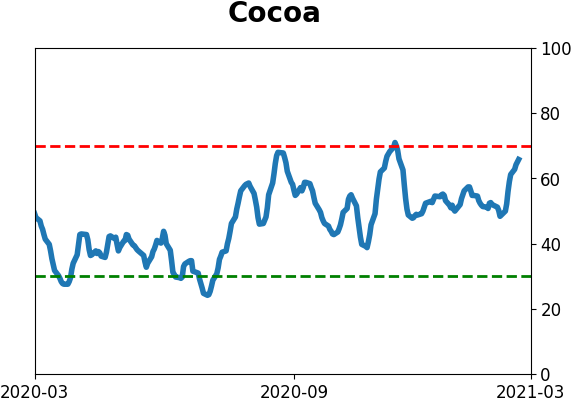
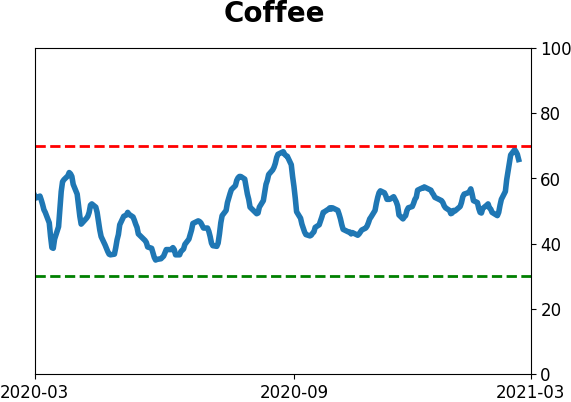
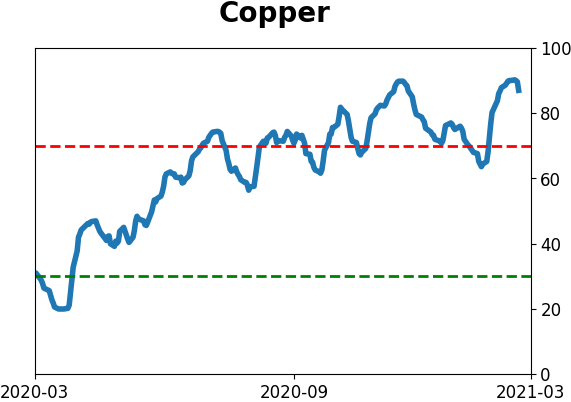
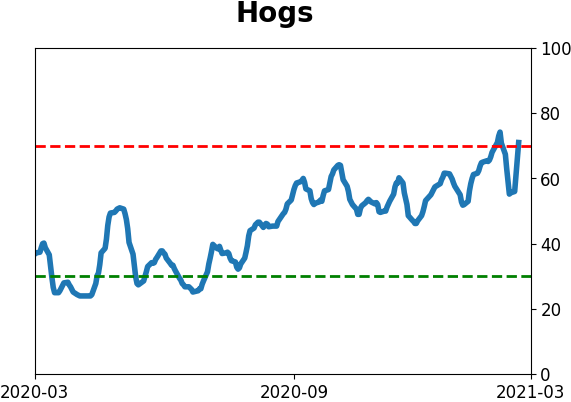
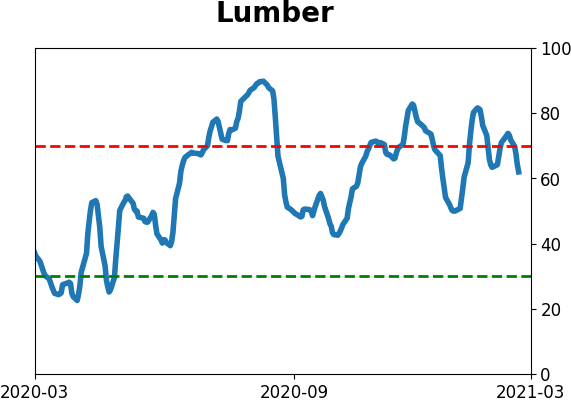
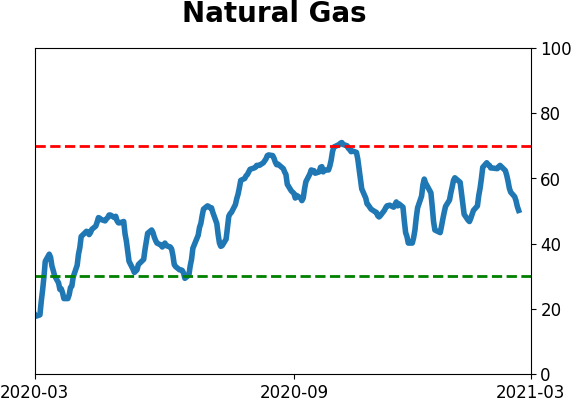
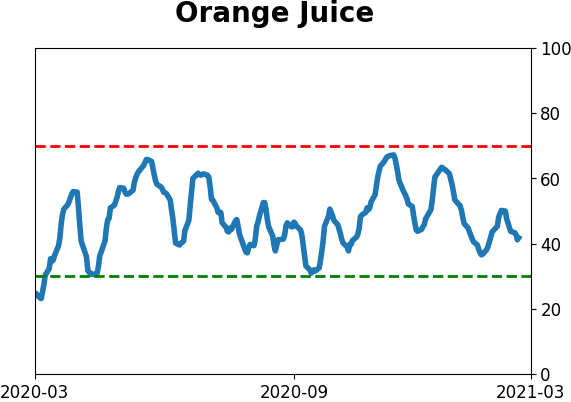
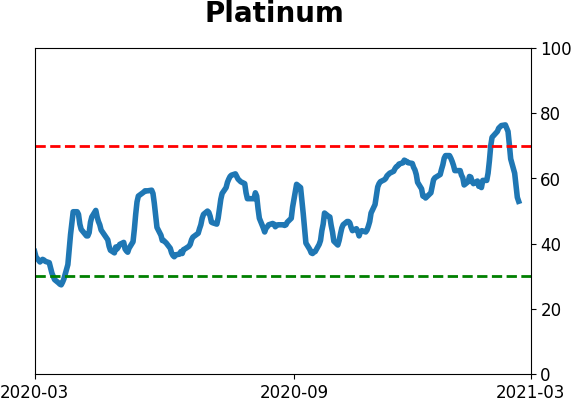
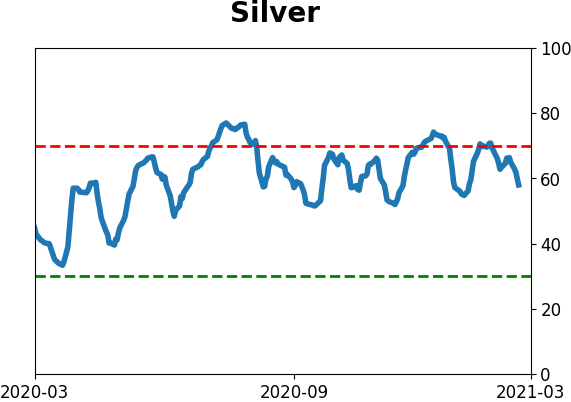
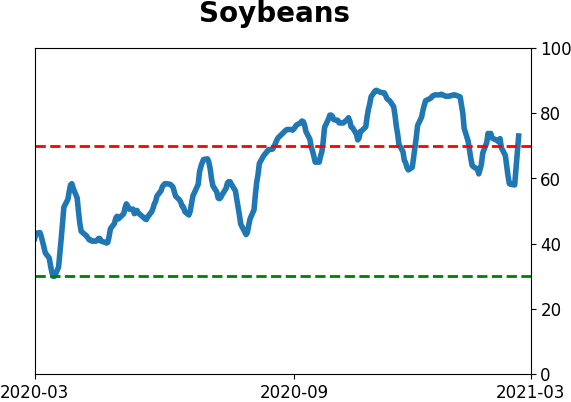
Optimism Index Thumbnails
|
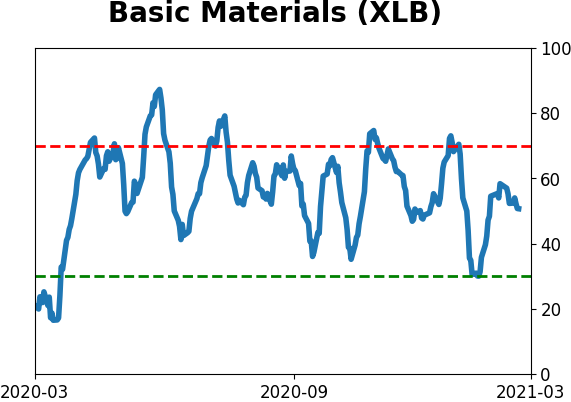
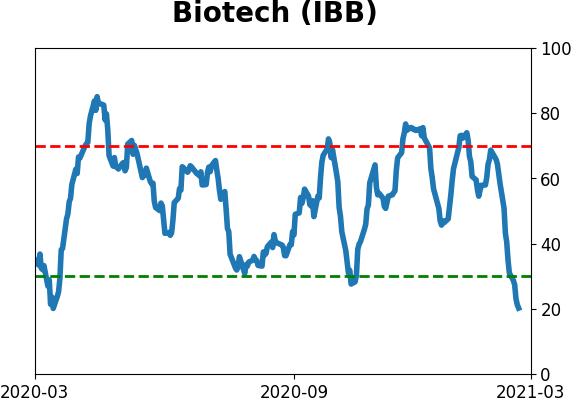
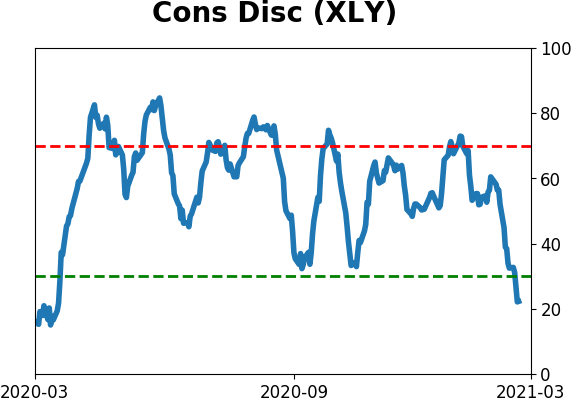
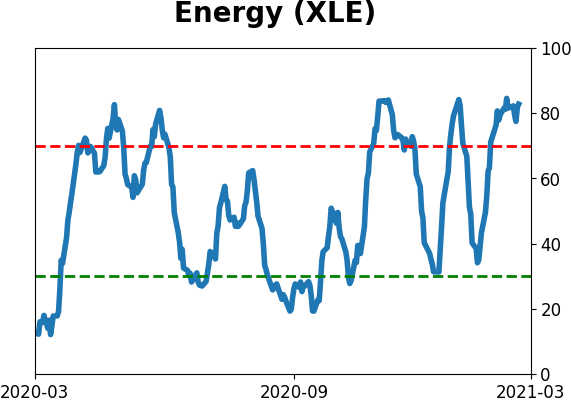
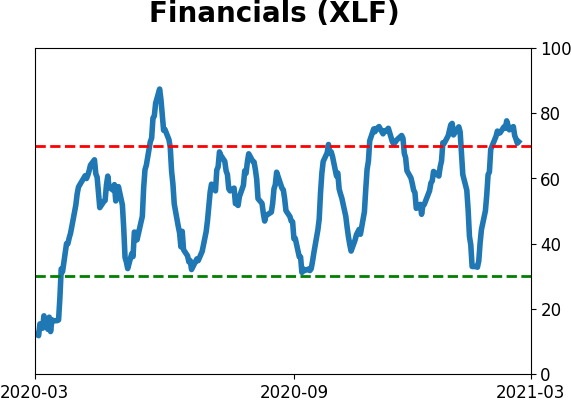
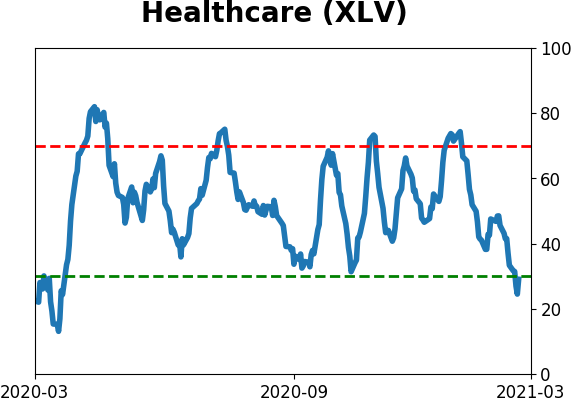
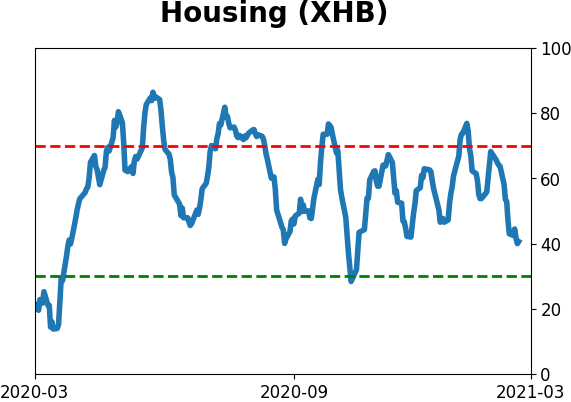
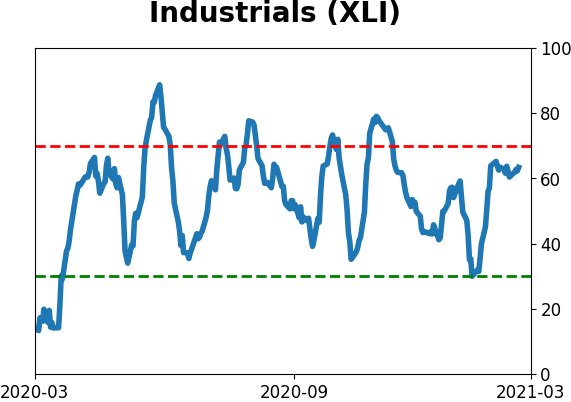
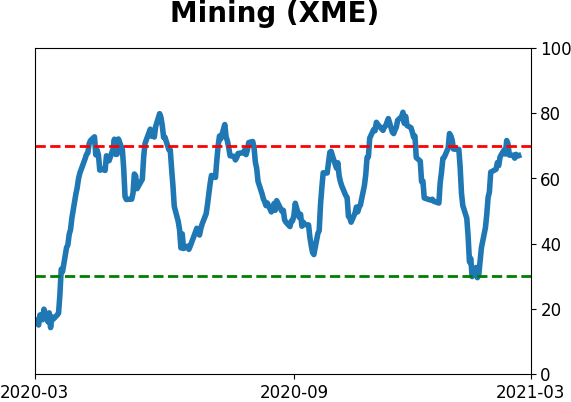
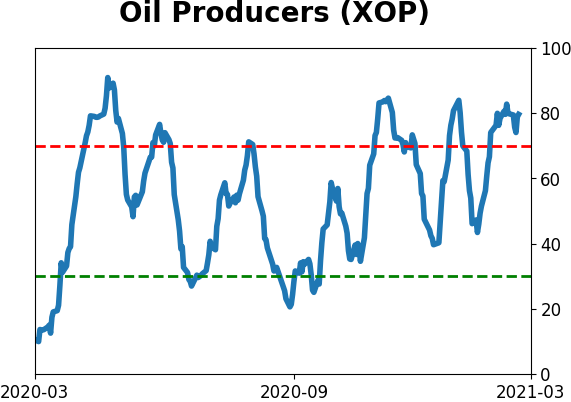
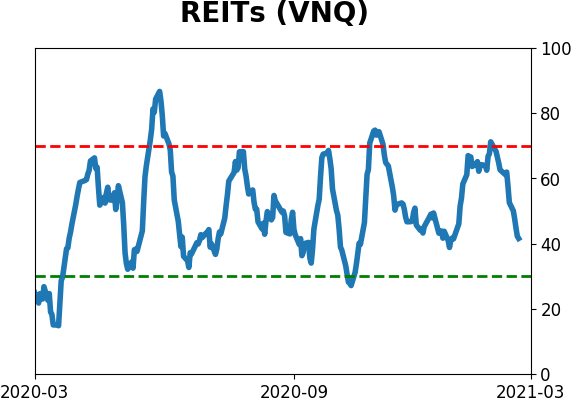
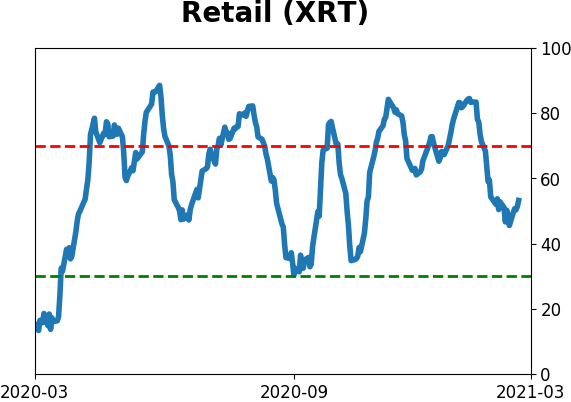
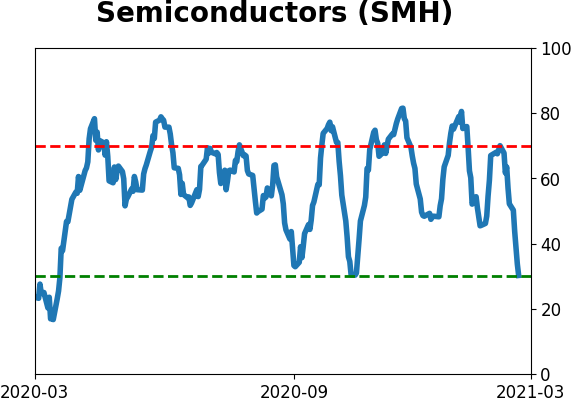
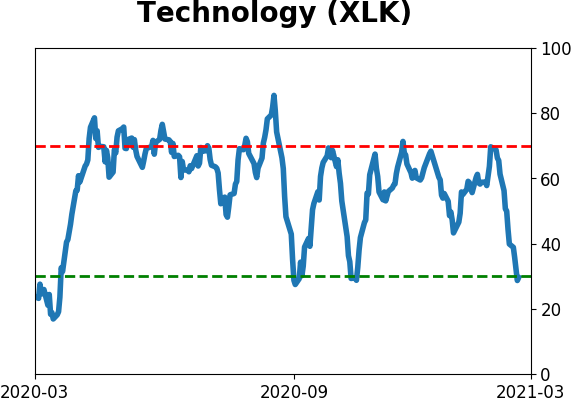
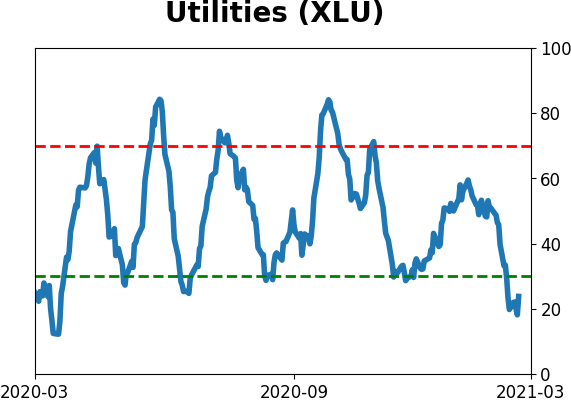
Sector ETF's - 10-Day Moving Average
|
|
|
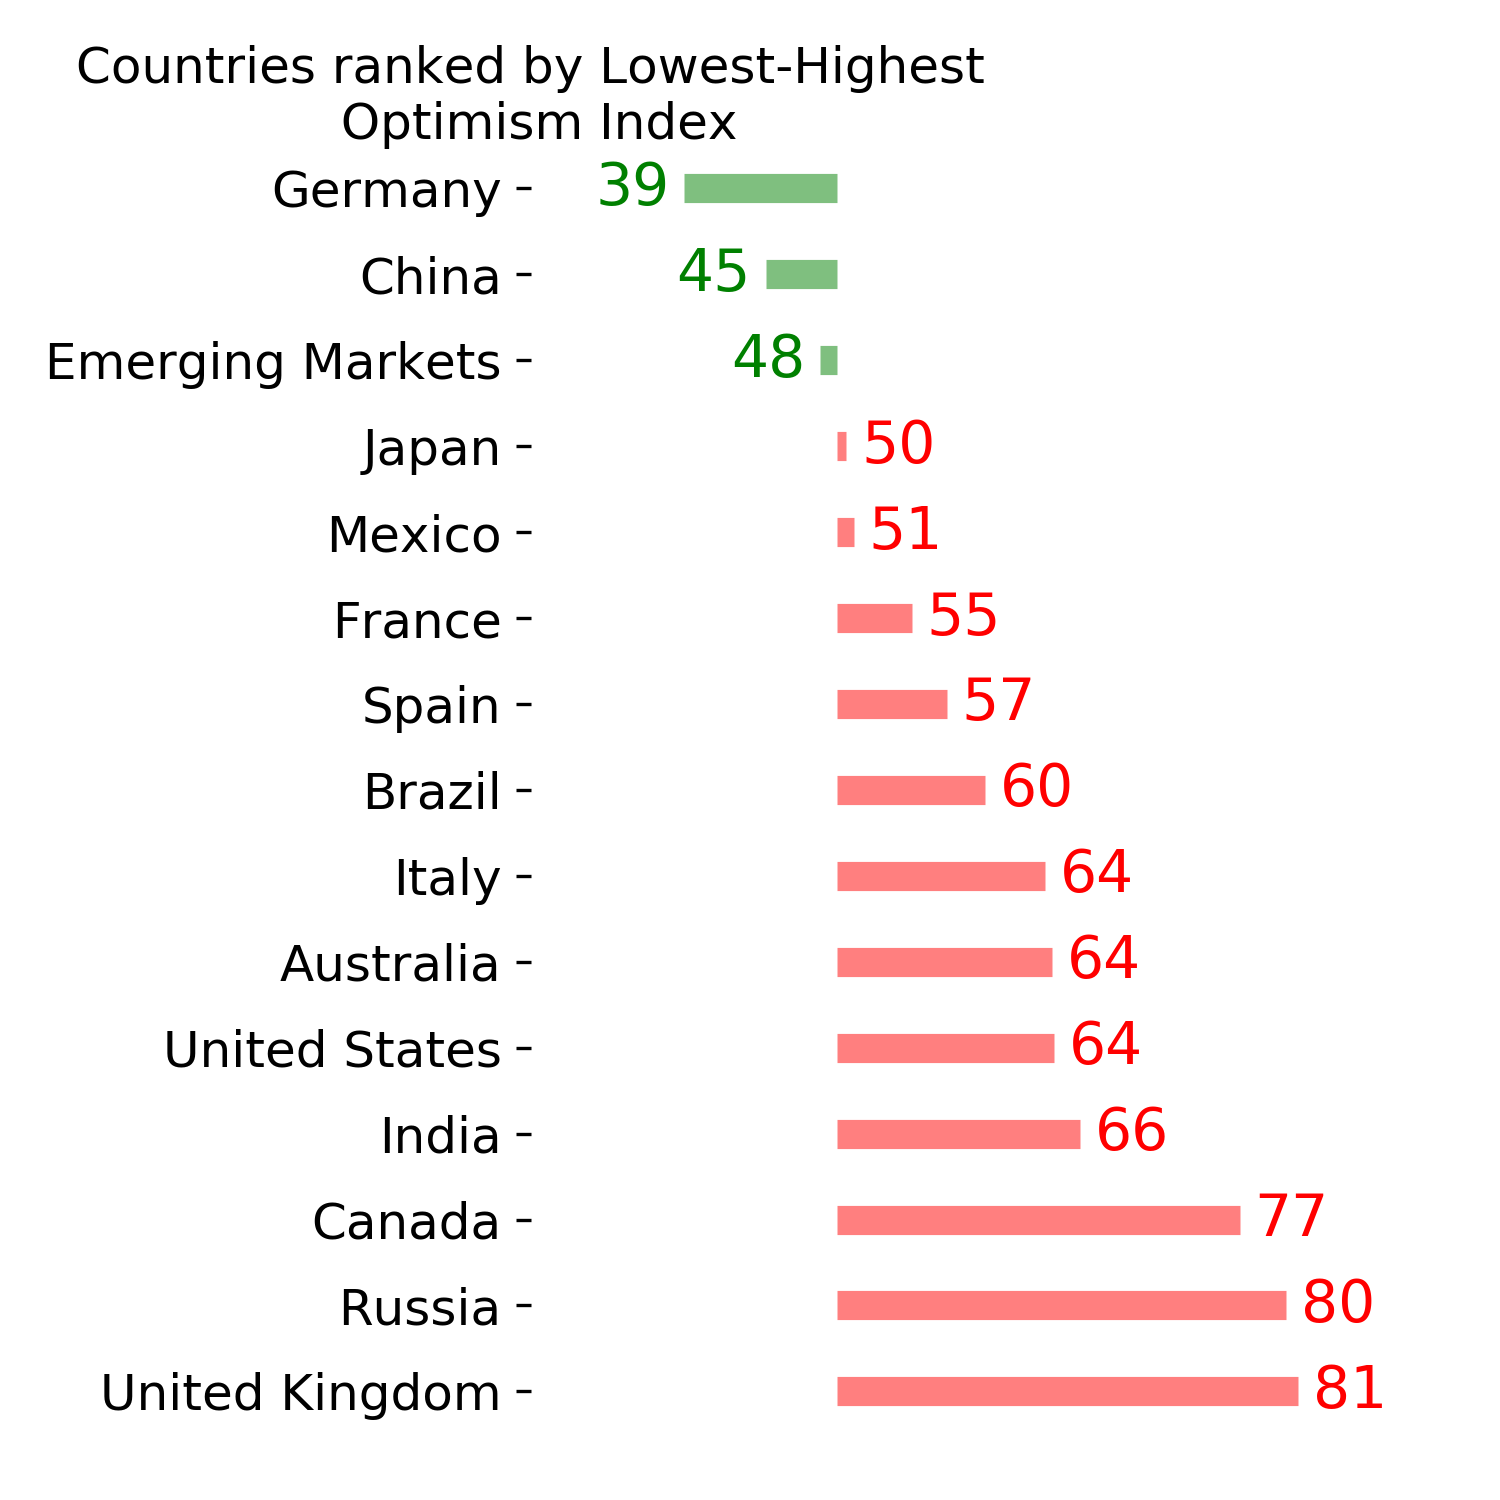
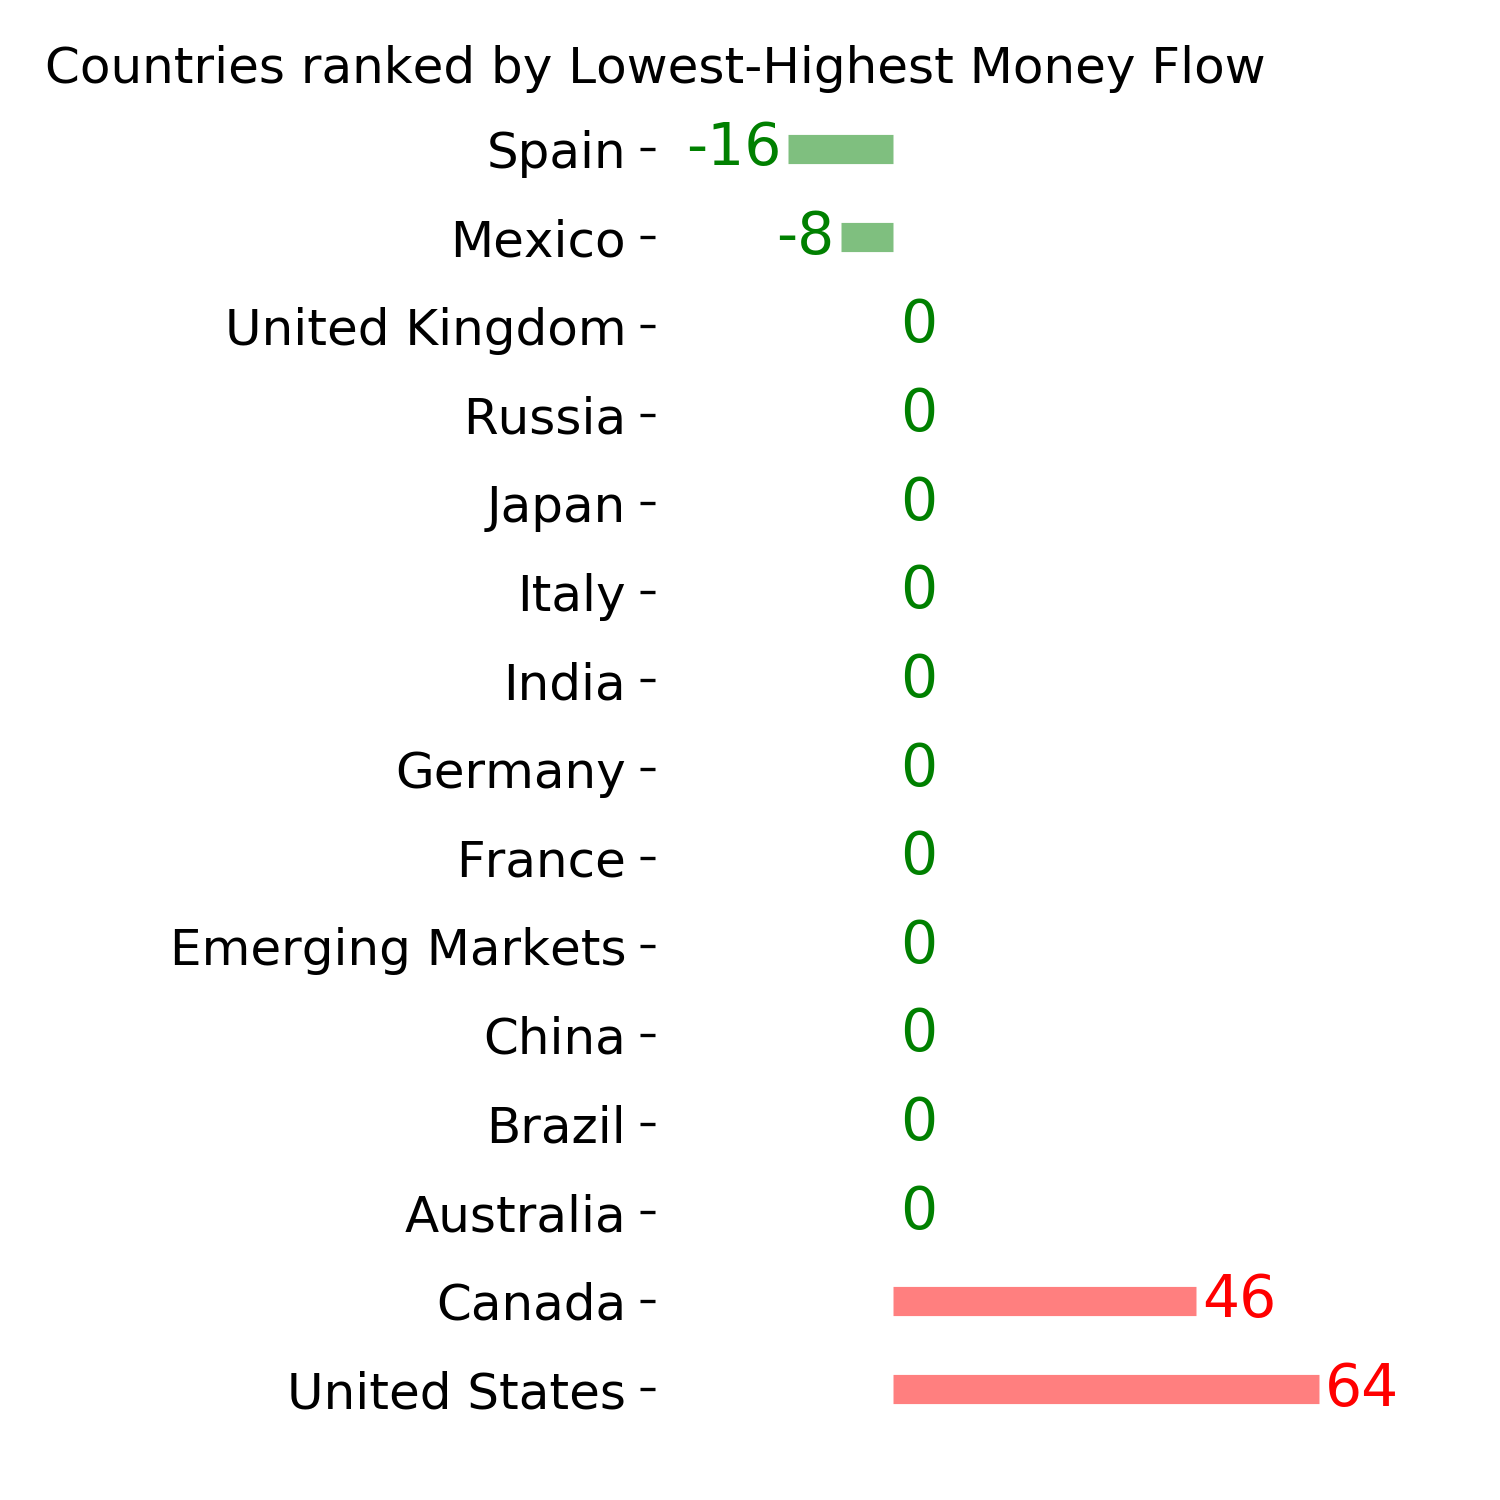
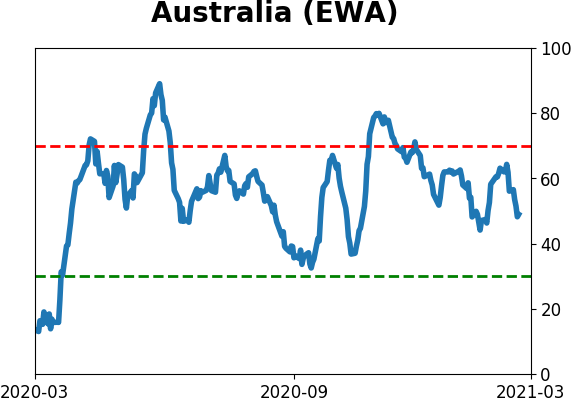
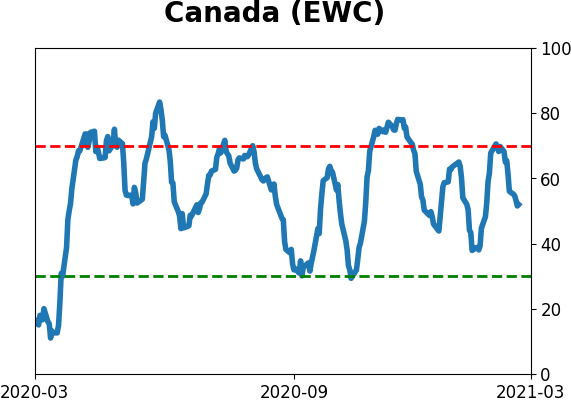
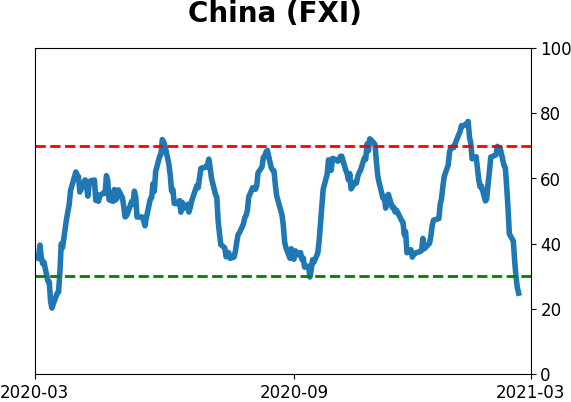
Country ETF's - 10-Day Moving Average
|
|
|
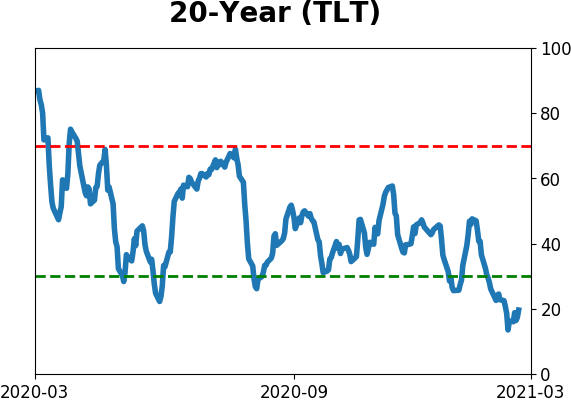
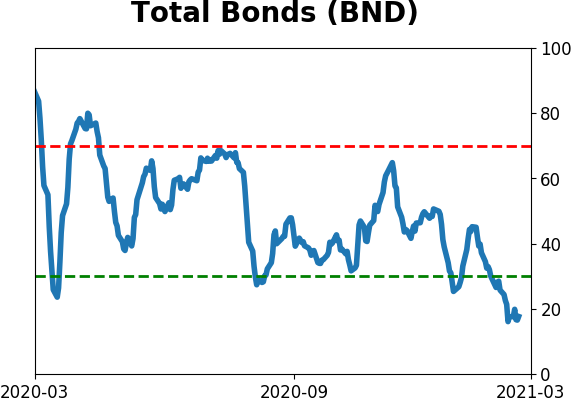
Bond ETF's - 10-Day Moving Average
|
|
|
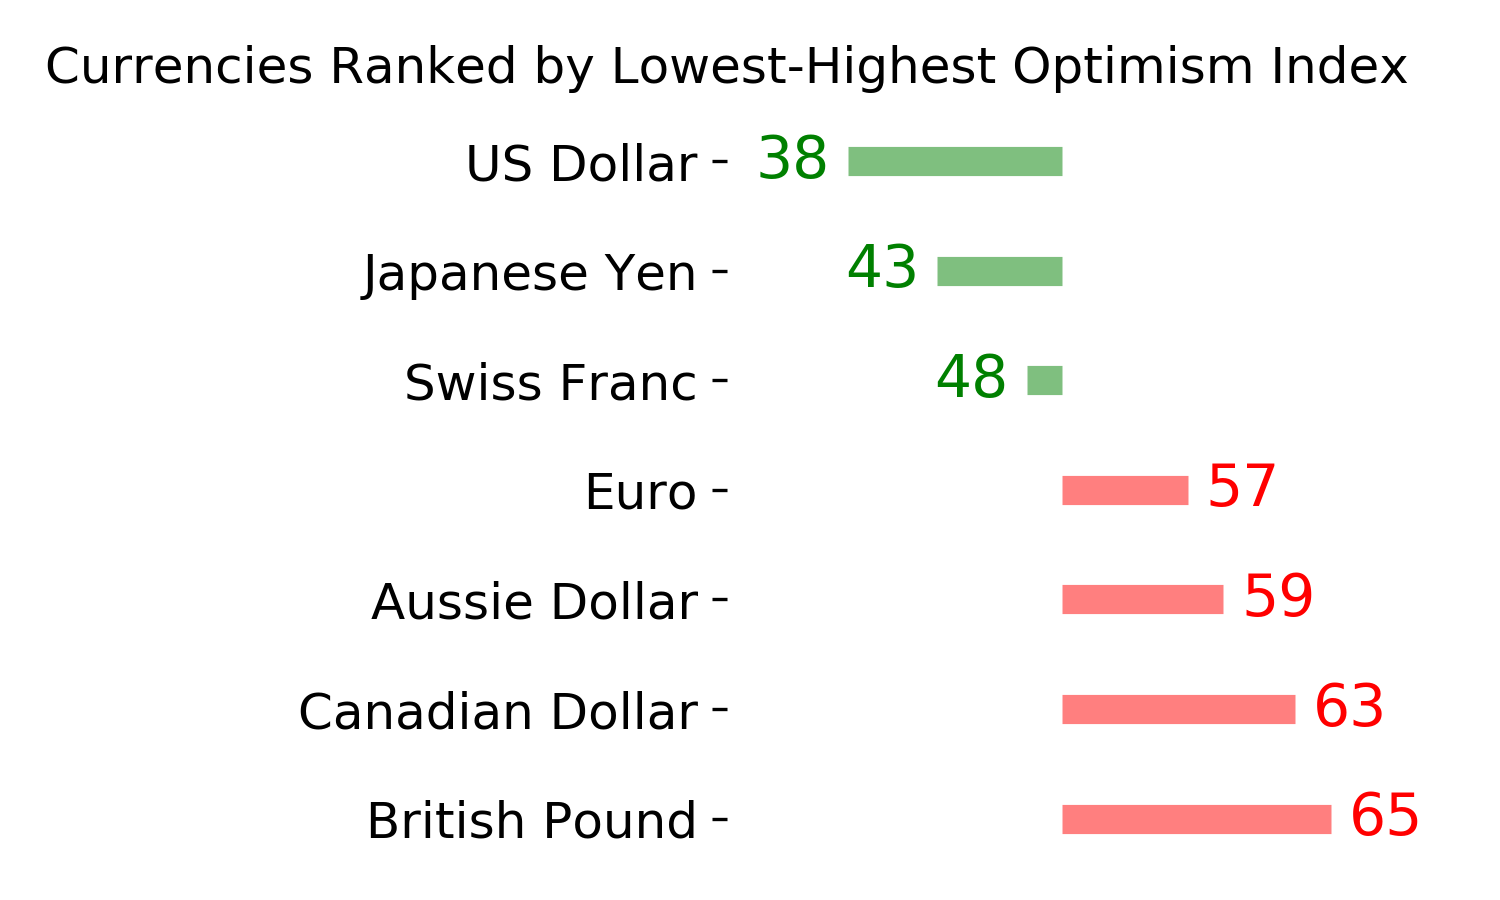
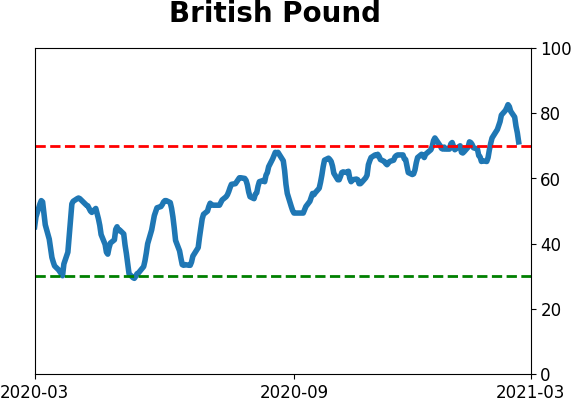
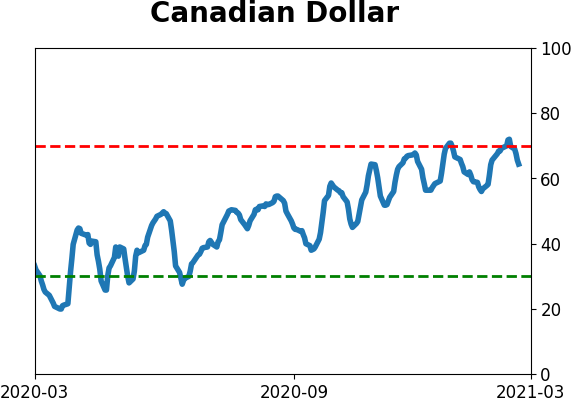
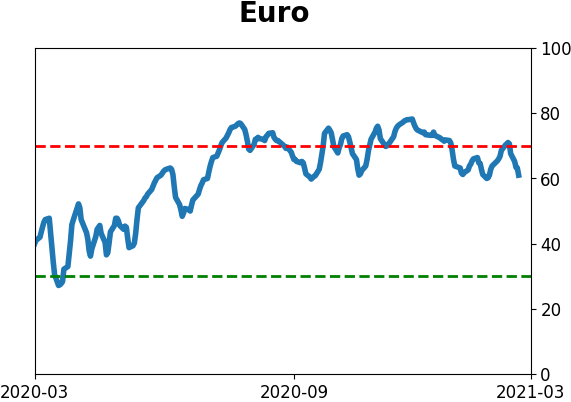
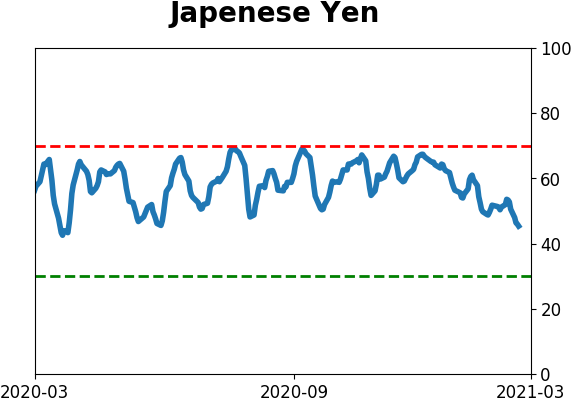
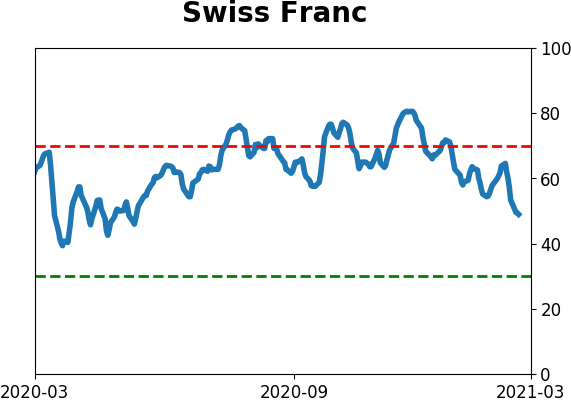
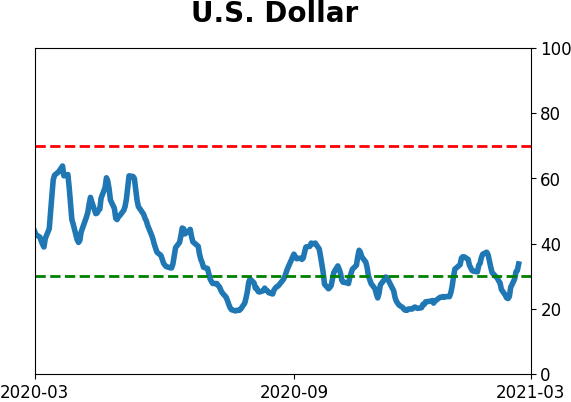
Currency ETF's - 5-Day Moving Average
|
|
|
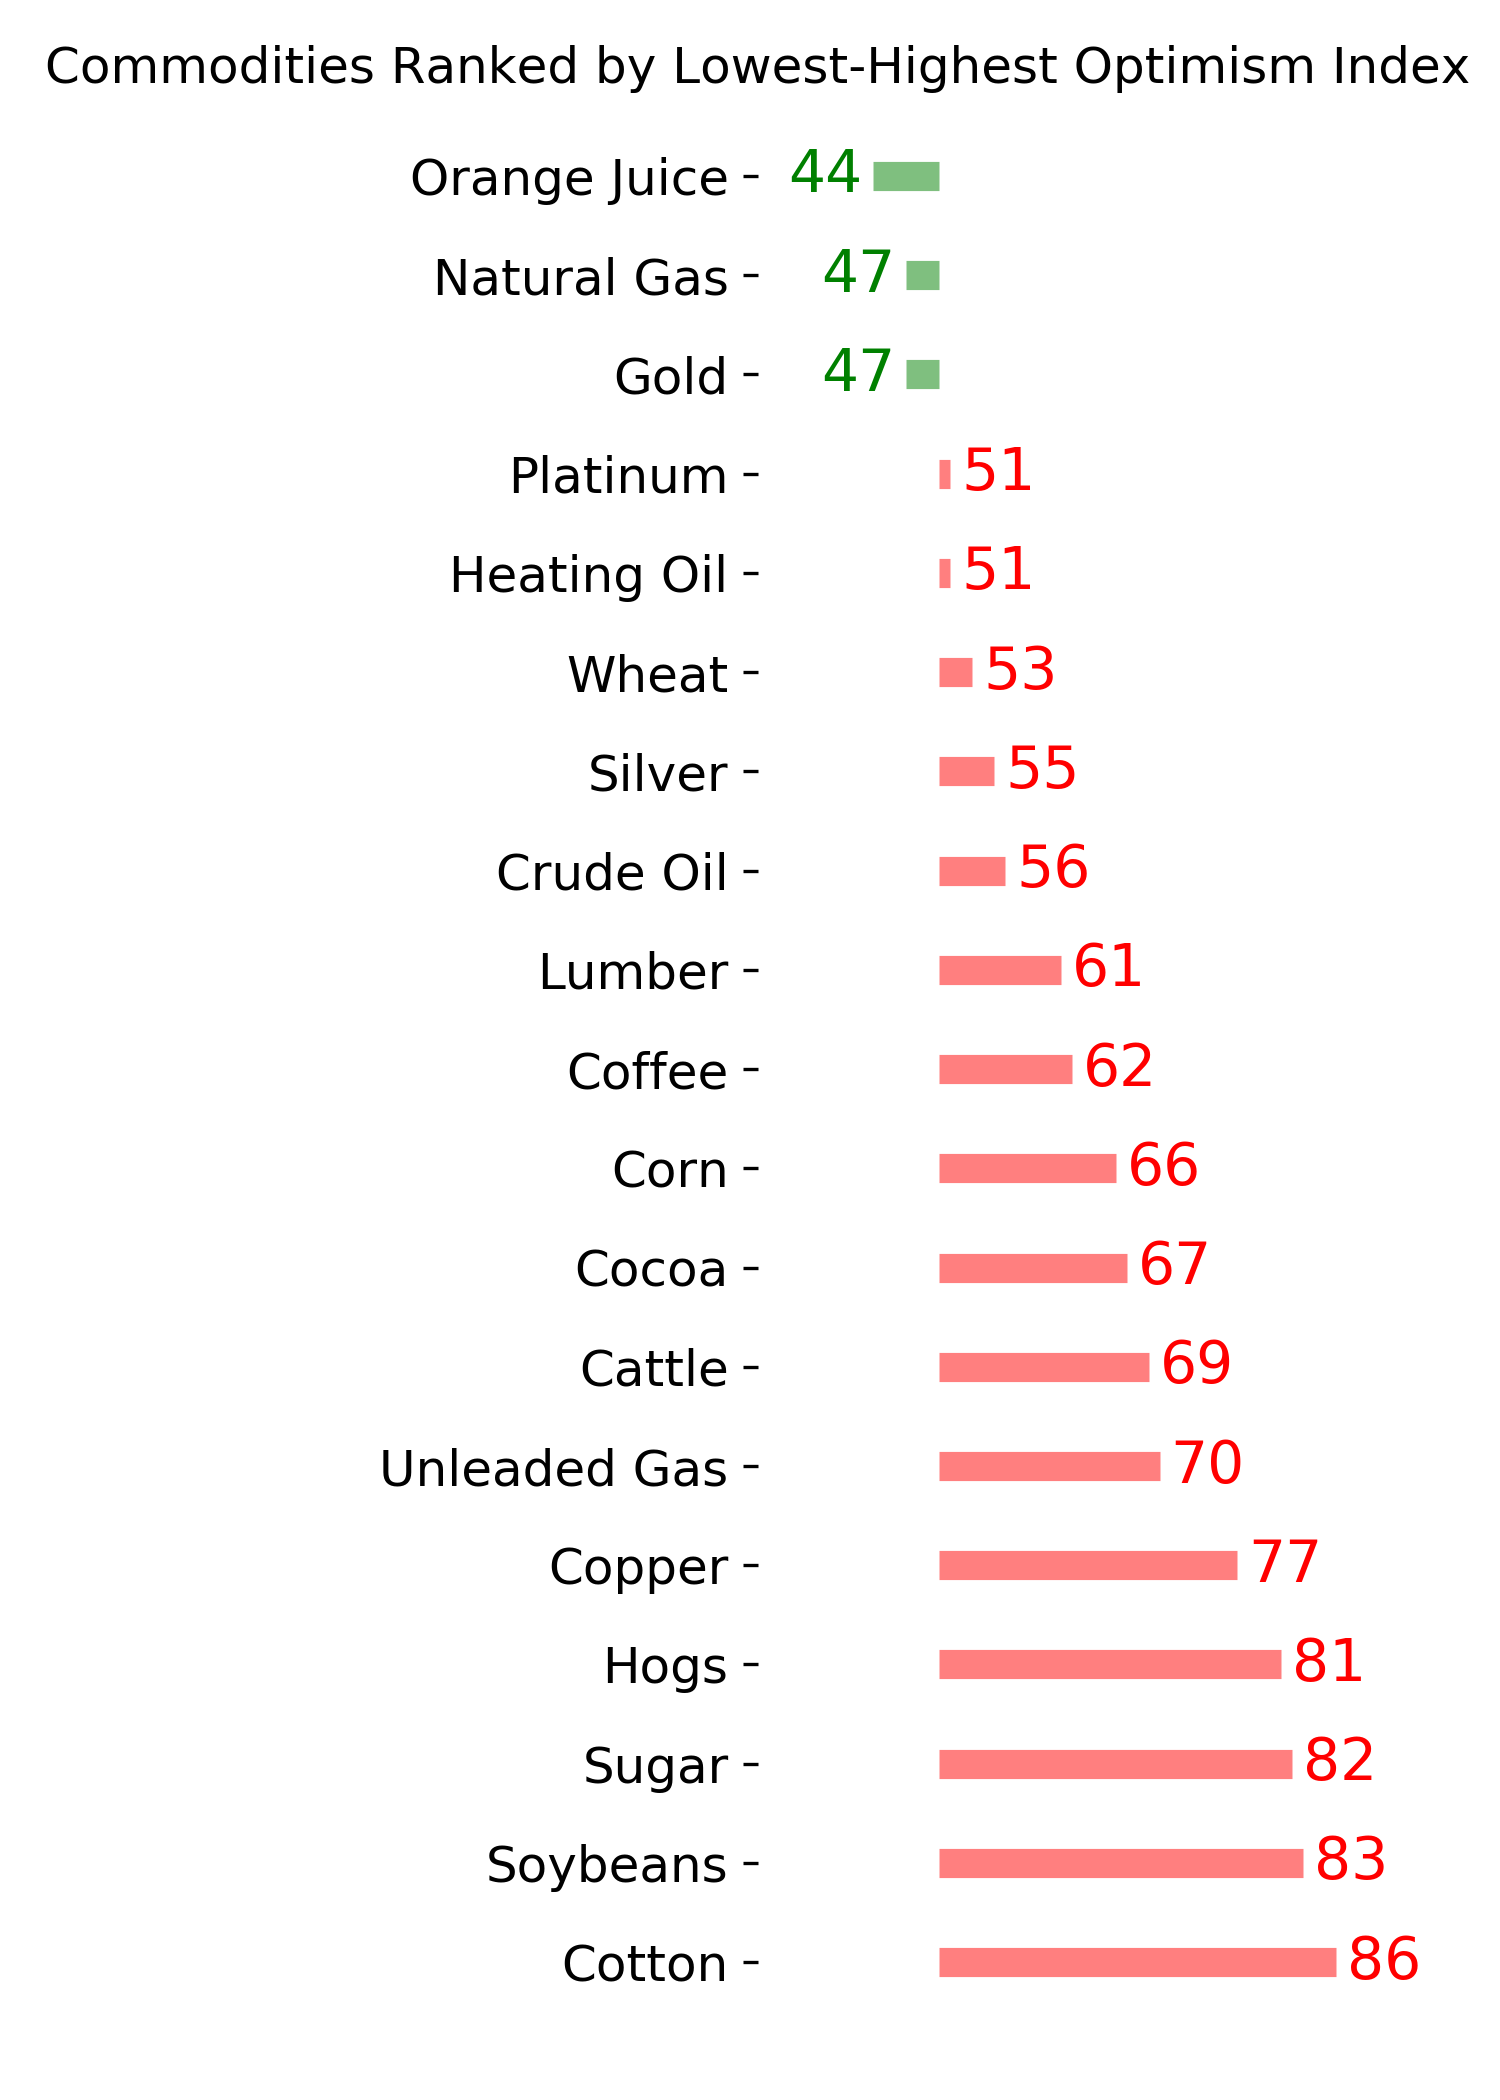
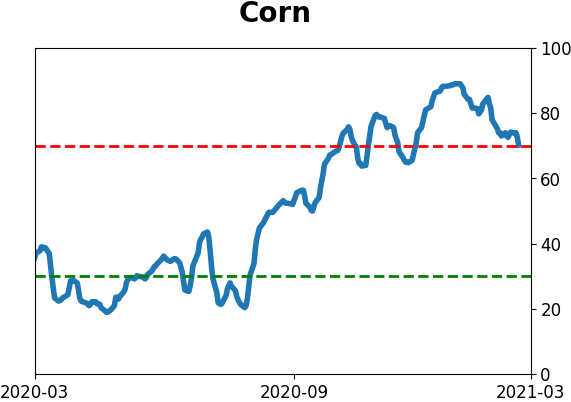
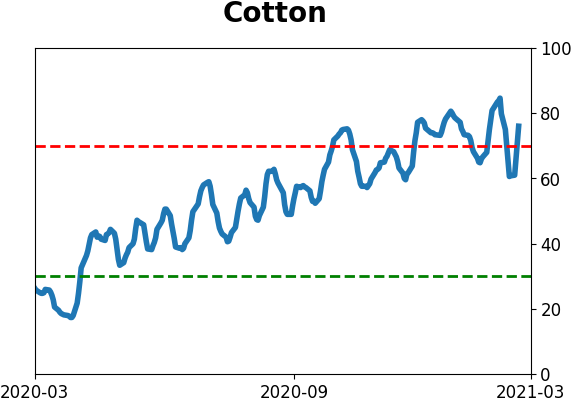
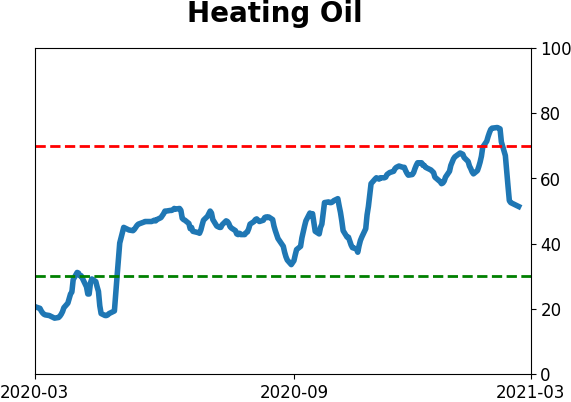
Commodity ETF's - 5-Day Moving Average
|
|