
A Warning Sign Worthy of Your Attention

Let's try to spell this out as succinctly as possible. In the most general terms possible:
- A lot of stocks making new highs and few making new lows = Bullish
- A lot of stocks making new lows and few making new highs = Bullish
- A lot of stocks making new highs and a lot of stocks making new lows = Bearish
A lot of stocks making new highs and few making new lows typically occurs during the heart of a bull market. Essentially, it is almost the definition of a bull market. A lot of stocks making new lows and few making new highs typically occurs near the end of a bear market, when "all appears lost."
On the other hand - a situation where a lot of stocks are making new highs at the same time a lot of other stocks are making new lows is commonly referred to as "churning." The bottom line: churning is typically an important warning sign of a market in transition - i.e., the transition from bull to bear. While the indexes may continue to move sideways to slightly higher, "under the hood" things are deteriorating.
Enter the HiLo Logic Index
The original HiLo Logic Index was developed by Norman Fosback - a legendary innovator in terms of analyzing the markets (his 1975 classic "Stock Market Logic" opened a lot of eyes to a whole new and different way of analyzing the stock market) - and was based on the NYSE. For whatever reason, I have tended to focus more on the same indicator using the Nasdaq market.
The index is calculated as follows:
A = Daily Nasdaq new highs
B = Daily Nasdaq new lows
C = Total Nasdaq Issues traded
D = Lower of A and B
Nasdaq HiLo Logic Index = (D / C) *100
For example:
A = 322 new highs
B = 168 new lows
C = 4143 issues traded
D = 168
Nasdaq HiLo Logic Index = (168/4143) * 100 = 4.06%
Another approach is to take say a 10-day moving average of the daily readings to smooth things out. The bottom line:
- Low readings (say a 10-day MA <= 0.40) are considered bullish
- High readings (say a 10-day MA >= 2.15 OR a 1-day reading >= 4 are considered bearish)
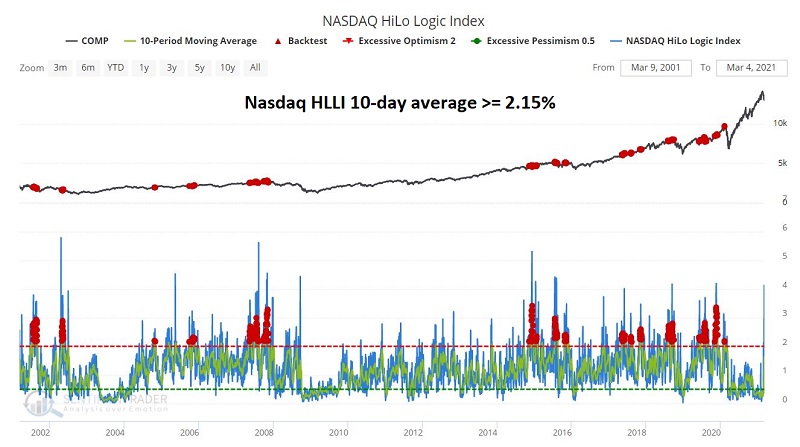
The chart below displays the times when the Nasdaq HLLI exceeded 2.15 on a 10-day average in the past 20 years.
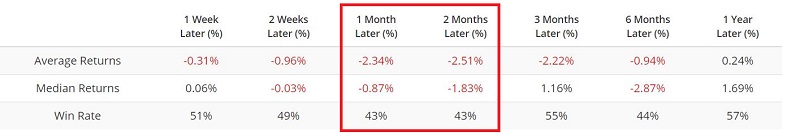
The table below shows that average forward results after a 10-day reading above 2.15 or higher have been well below average to negative across every time frame. To run this test yourself, just click here to load all the variables and then click the Run Backtest button. To see returns across time frames, click the Multi-Timeframe Results tab.
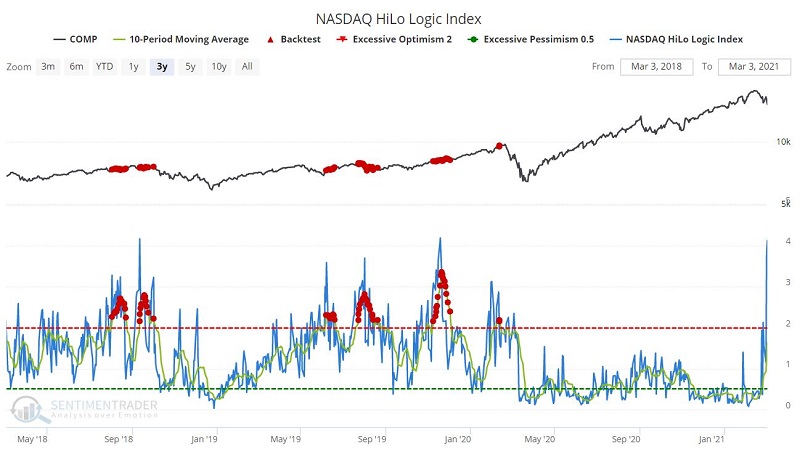
The chart below zooms in on the past 3 years. As you can see, not every signal constitutes an "Oh My God, the sky is falling, selling everything" warning. But the key thing to note is that these signals presciently identified coming market trouble (a sharp selloff and/or an extended period of sideways action).
It should also be noted that despite the spike above 4% at the far right, the 10-day average is still below 2.15. But the trend is clearly in the wrong direction (i.e., headed higher). In addition, a 1-day reading in excess of 4% is by itself a warning sign.
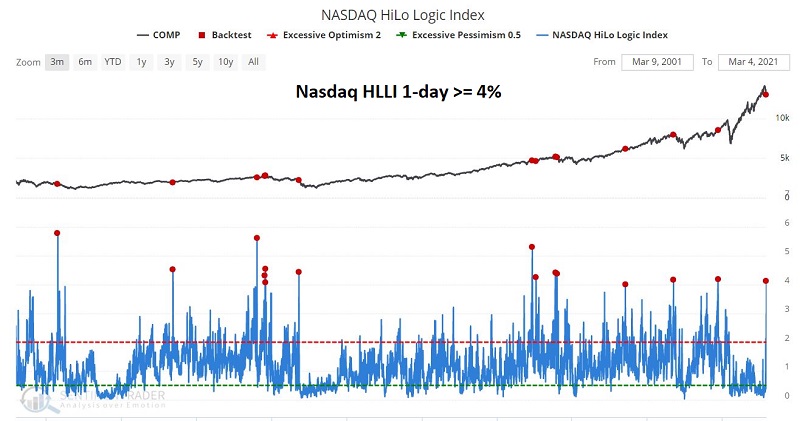
The chart below displays those times when the Nasdaq HLLI registered a 1-day reading in excess of 4%.
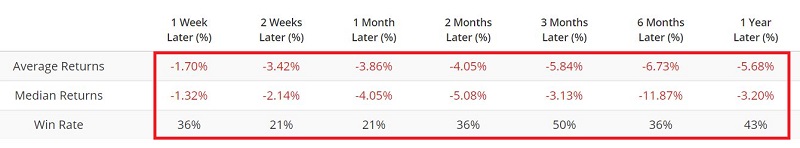
The table below shows that average forward results after a 1-day reading above 4% have been negative across every time frame. To run this test, click here.
So is the sky about to fall? Not necessarily. But this time-tested indicator is clearing signaling that the time to play some defense may be quickly approaching and that investors and traders who are focused solely on maximizing gains may be in danger.