
The Pound Rebound

Allow me to expound. Actually, it's more like the "Pound Boomerang." But first things first.
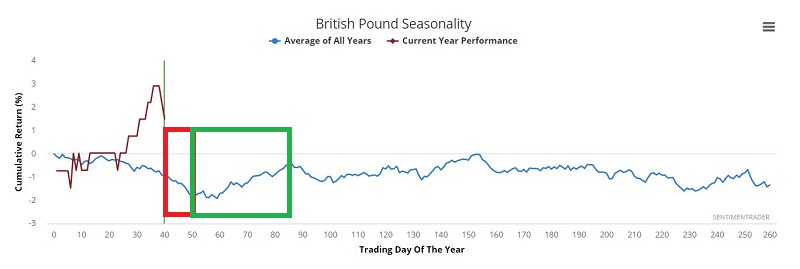
In the chart below:
- The blue line displays the average annual seasonal tendencies for the British Pound
- The dark red line displays the price action for the pound so far this year
- The red box highlights trading day of Year #39 through #50
- The green box highlights trading day of Year #50 through #86
A close look at the chart above reveals that the pound has tended to:
- Lose ground between TDY #39 and TDY #50
- Gain ground between TDY #50 and TDY #86
For 2021:
- TDY #39 through #50 extends from the close on 3/1/2021 through the close on 3/16/2021
- TDY #50 through #86 extends from the close on 3/16/2021 through the close on 5/8/2021
Let's consider the history of both periods and then combine the two.
British Pound: TDY #39 through TDY #50
The chart below displays the hypothetical cumulative dollar gain or loss achieved by holding a 1-lot of pound futures from the close of TDY #39 through the close of TDY #50 every year since 1973.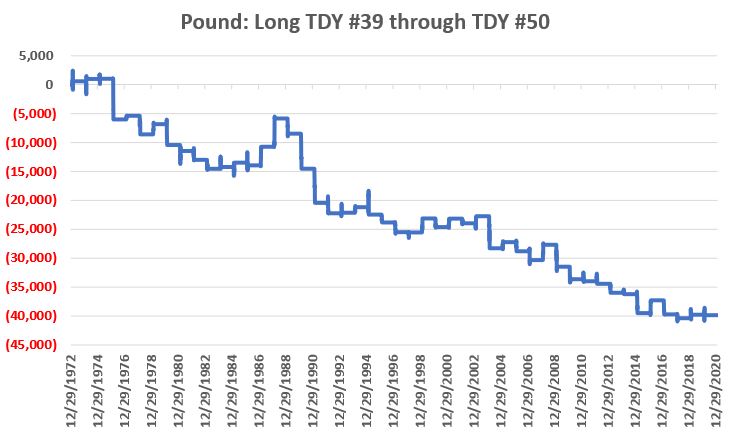
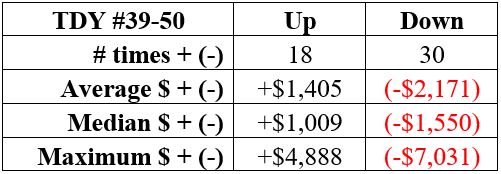
The table below displays the relevant facts and figures.
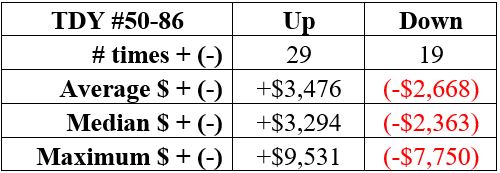
British Pound: TDY #50 through TDY #86
The chart below displays the hypothetical cumulative dollar gain or loss achieved by holding a 1-lot of pound futures from the close of TDY #50 and the close of TDY #86 every year since 1973.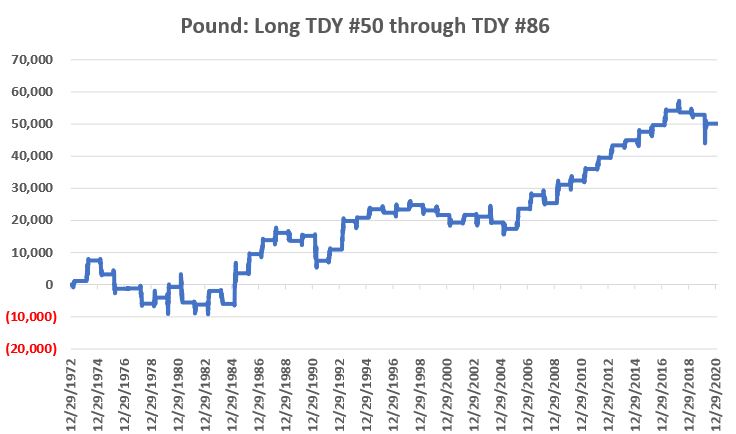
The table below displays the relevant facts and figures.
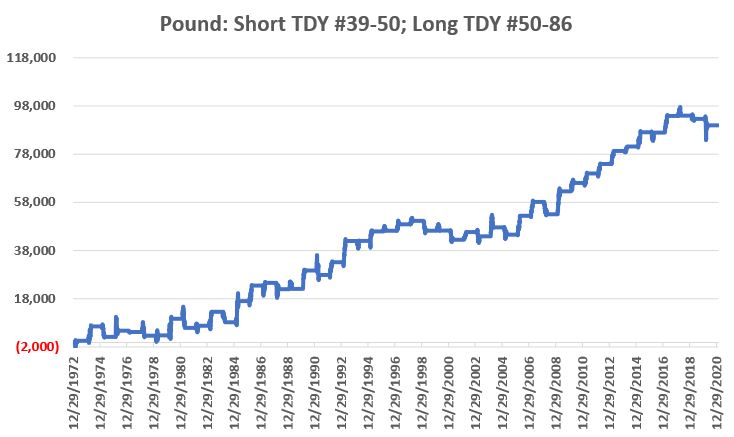
The Two Periods Combined
Certainly, there are no "sure things" here. Still, the long-term tendency is clear. The pound tends to show weakness during the first period, then "boomerangs" to move higher during the second period. To further illustrate this, let's test the following strategy:
- Short 1 British Pound futures from TDY #39 through TDY #50
- Long 1 British Pound futures from TDY #50 through TDY #86
The chart below displays the hypothetical cumulative dollar gain or loss achieved by holding a short 1-lot of pound futures during the first period and a long 1-lot position of pound futures during the second period every year since 1973.
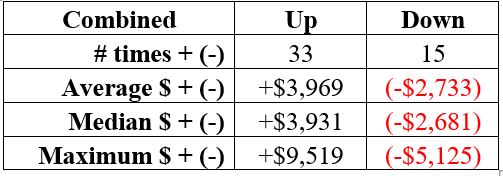
 The table below displays the relevant facts and figures.
For non-futures traders there is ticker FXB (Invesco CurrencyShares British Pound Sterling Trust) ETF that is intended to track the price movement of the British Pound. Traders should note that this ETF is relatively thinly traded with an average daily volume in the 30,000 to 40,000 share range.