Headlines
|
|
Weekly Wrap for Jan 29 - Quick reversal in uptrends:
The week saw continued evidence of extremely speculative activity, punctured somewhat by a quick flurry of selling pressure.
The latest Commitments of Traders report was released, covering positions through Tuesday: The 3-Year Min/Max Screen shows that there wasn't much new this week. "Smart money" commercial hedgers continue to sell corn, which we've touched on almost weekly for months. Their overall position in the ag contracts continues to hover near all-time record short exposure. Same for commodities in general, for that matter. Despite some selling in Nasdaq futures, their position in the major equity index futures remained about where it was, modestly net short but not at a notable extreme.
Bottom Line:
See the Outlook & Allocations page for more details on these summaries STOCKS: Weak sell
We're in an extremely speculative environment that is enough to become defensive, especially with recent cracks showing in what had been pristine breadth conditions. The spike in fear on Wednesday (and again Friday) is likely not enough to offset the negatives. BONDS: Weak buy
Various parts of the market have been hit in recent weeks, with mild oversold conditions that have started to reverse. GOLD: Weak buy
A dollar trying to rebound from a severe short position has weighed on gold and miners. The types of signals they've given in recent weeks, within the context of their recent surge, have usually resulted in higher prices.
|
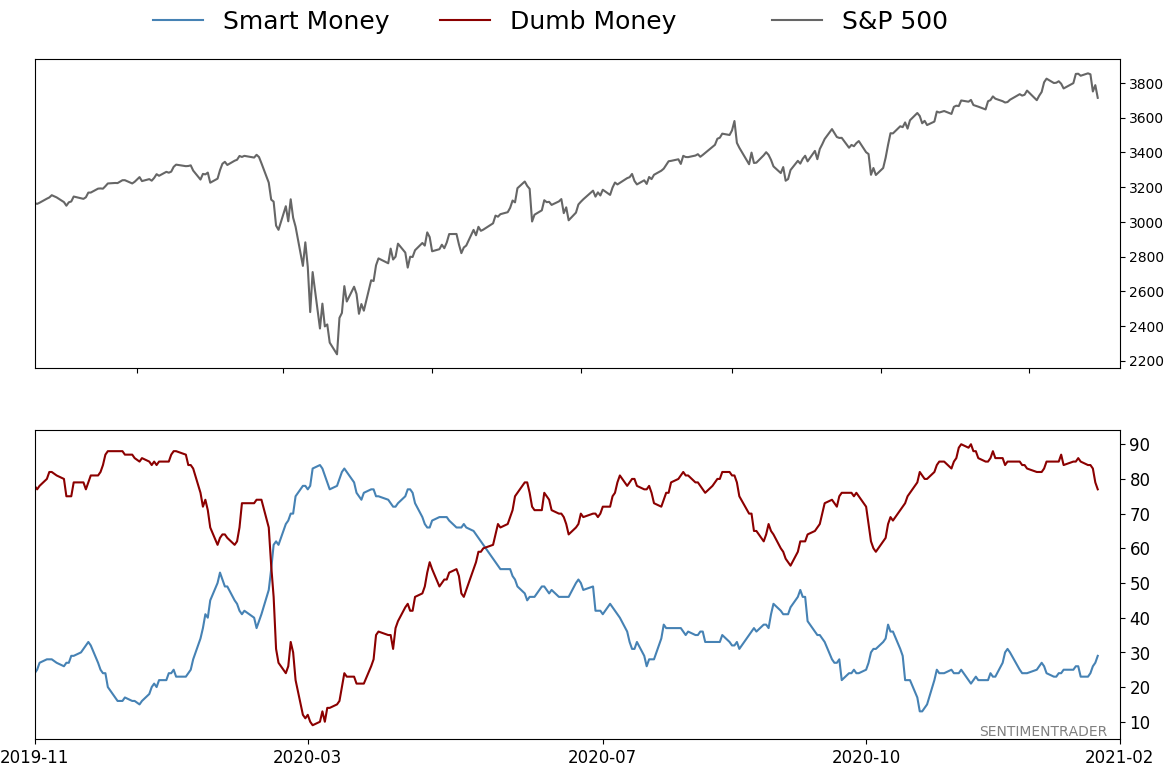
Smart / Dumb Money Confidence
|
Smart Money Confidence: 29%
Dumb Money Confidence: 77%
|
|
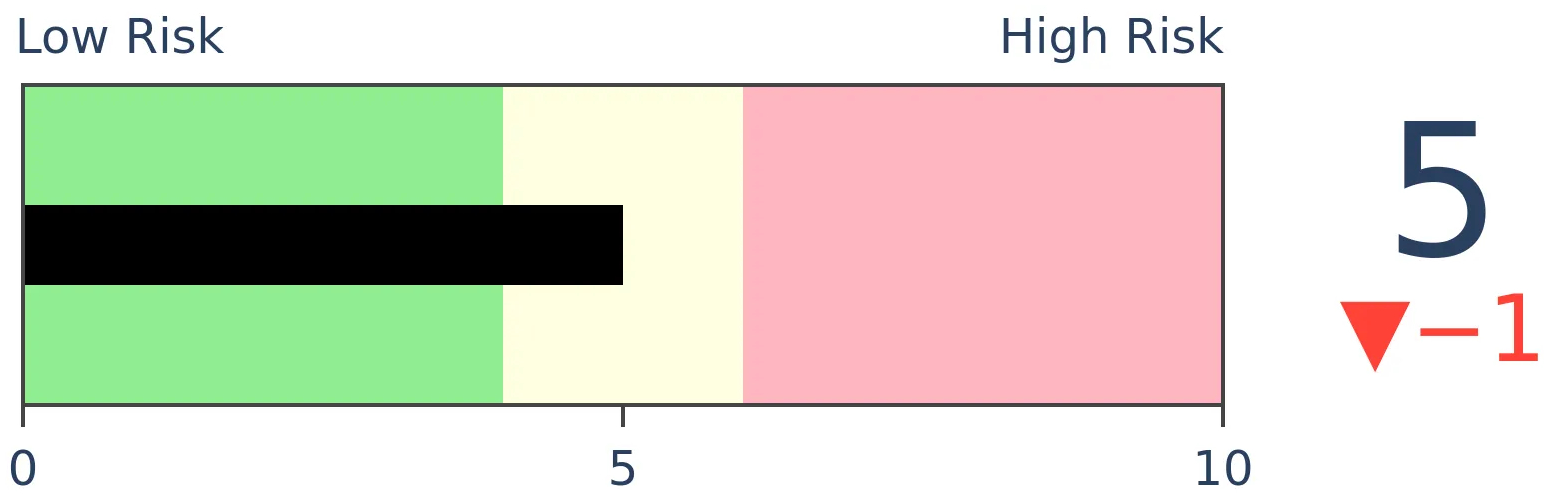
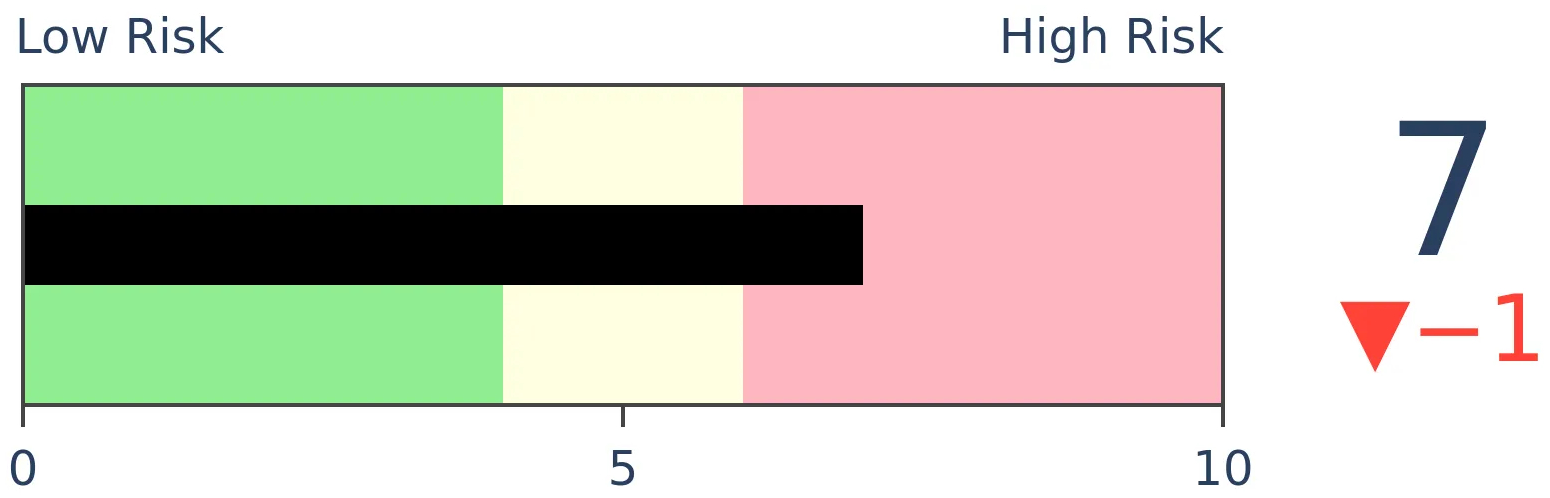
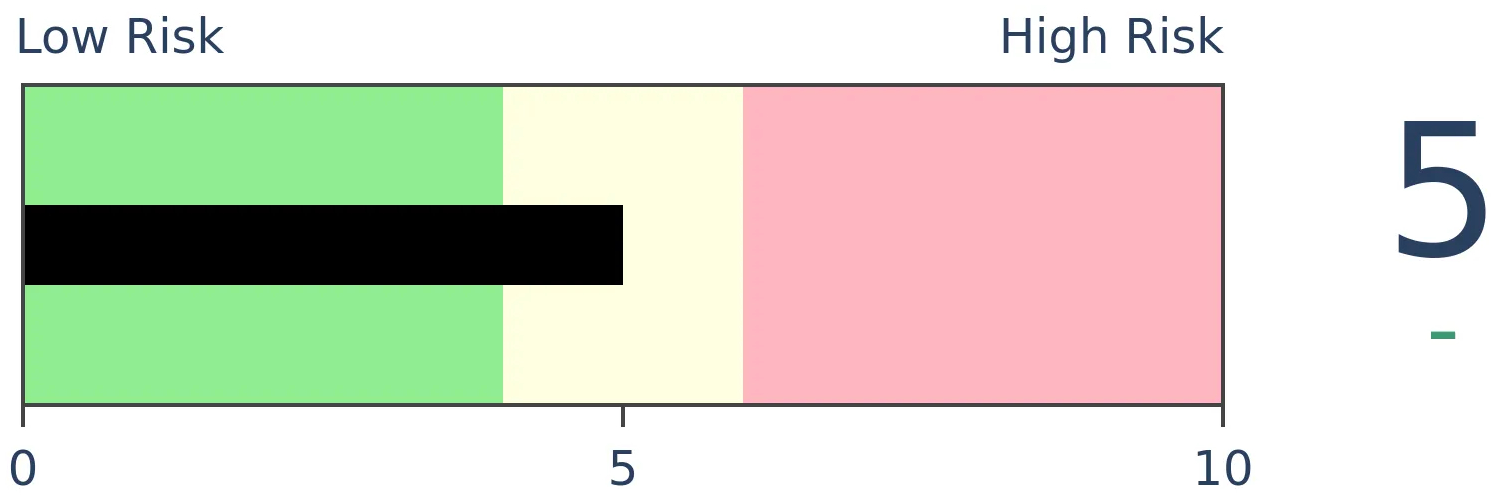
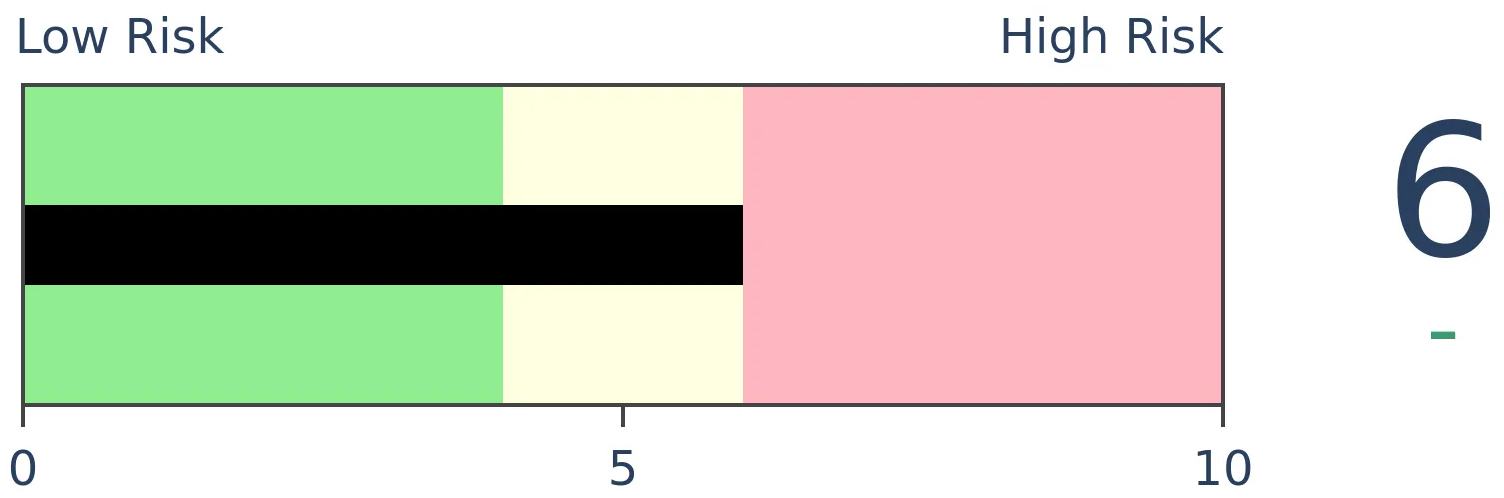
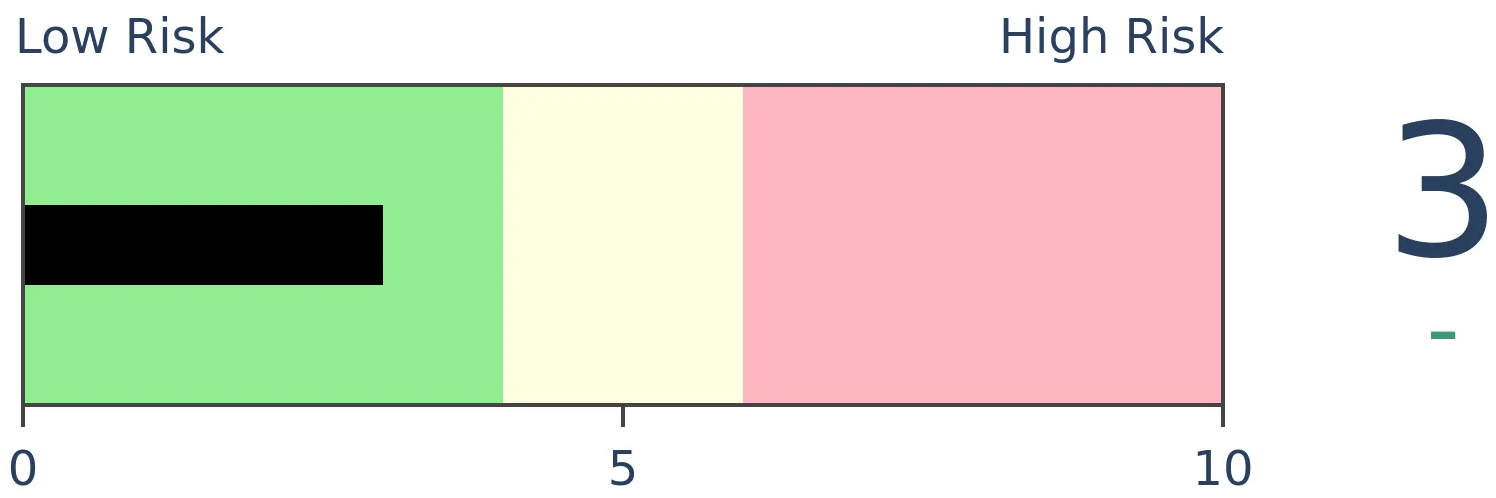
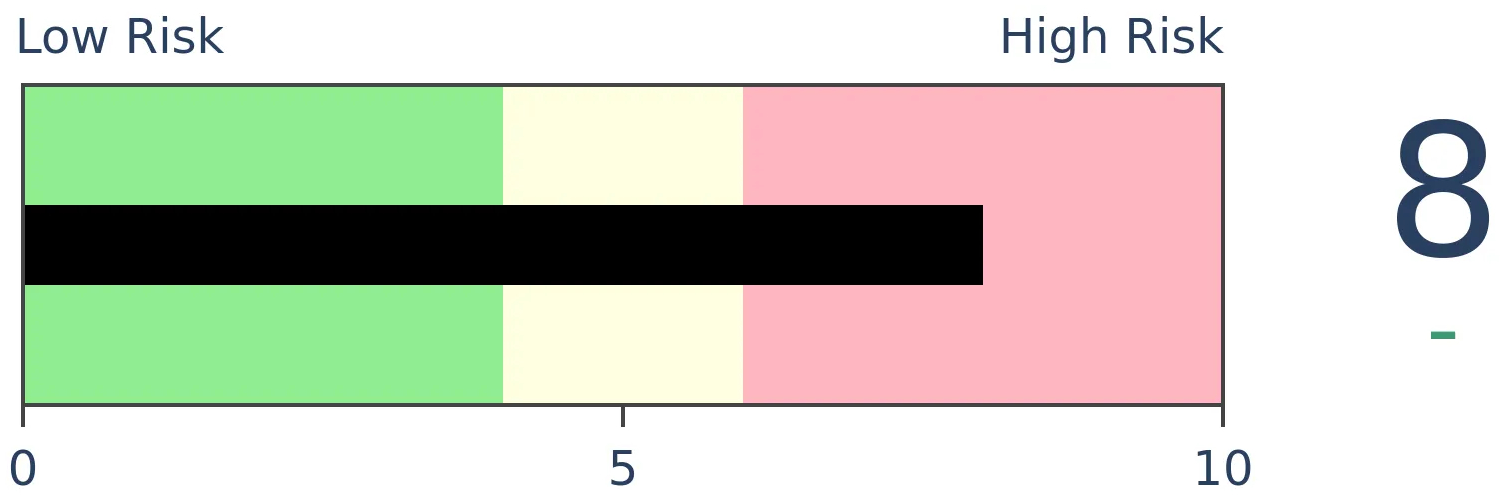
Risk Levels
Stocks Short-Term
|
Stocks Medium-Term
|
|
Bonds
|
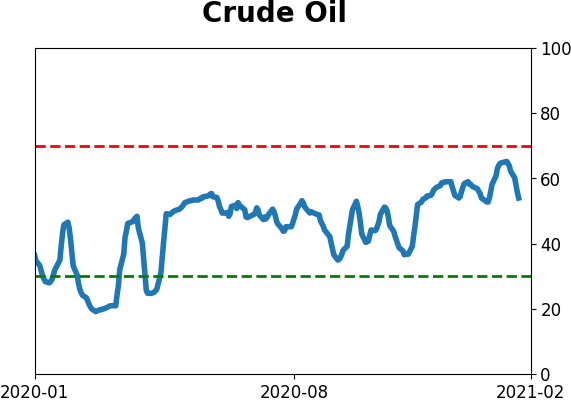
Crude Oil
|
|
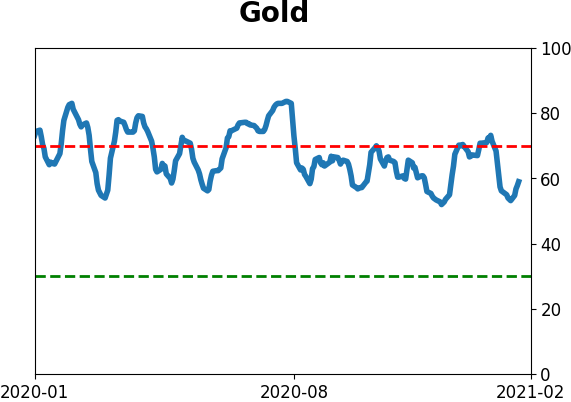
Gold
|
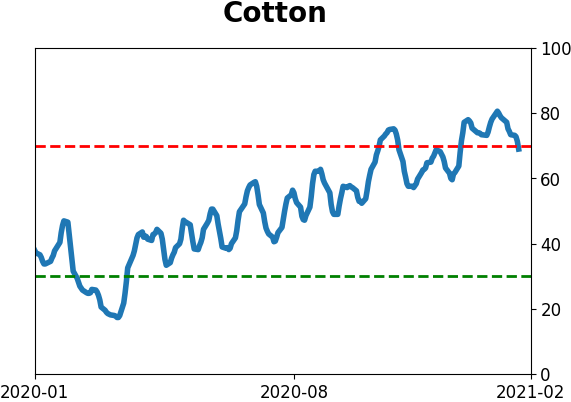
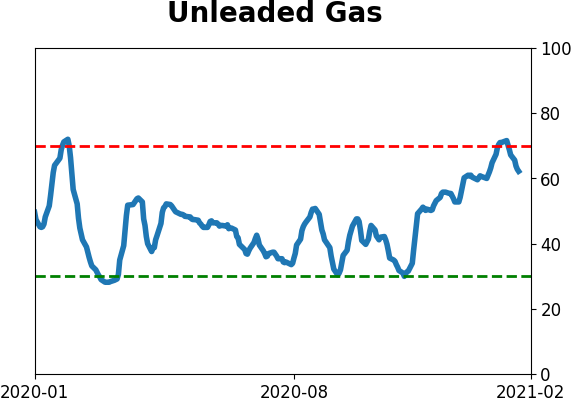
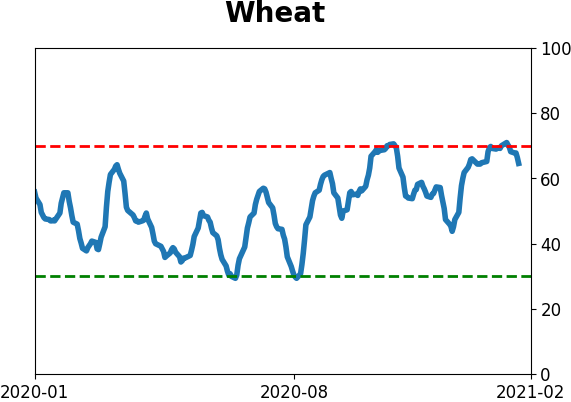
Agriculture
|
|
Research
BOTTOM LINE
The week saw continued evidence of extremely speculative activity, punctured somewhat by a quick flurry of selling pressure.
FORECAST / TIMEFRAME
None
|
The goal of the Weekly Wrap is to summarize our recent research. Some of it includes premium content (underlined links), but we're highlighting the key focus of the research for all. Sometimes there is a lot to digest, with this summary meant to highlight the highest conviction ideas we discussed. Tags will show any related symbols and time frames related to the research.
| STOCKS |
 |  |
|
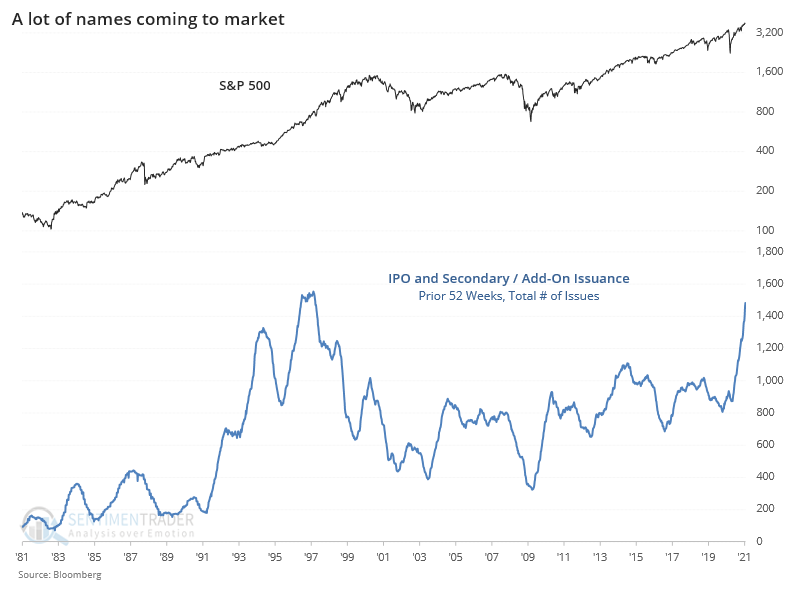
January has been another boon for investment bankers, and the craziness (no other word for it) in some of the story stocks is only going to increase their business as the companies rush to issue shares.
There had already been a flood of issuance in recent weeks, building on what has been a tremendous year for investment bankers. It hasn't just been a few mega stocks issuing shares that caused the rise in issuance; the number of issues has also skyrocketed.
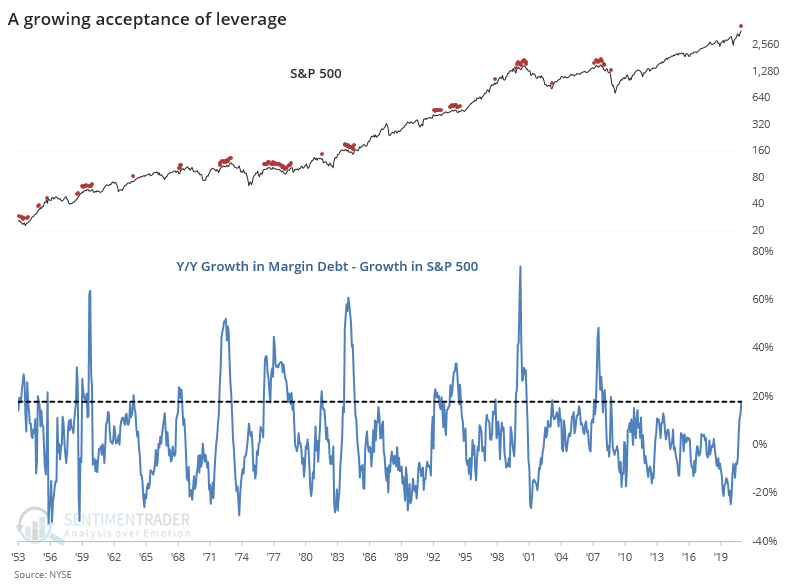
Not only are investors accepting the new supply, their adding debt to help fund it. One of the things we've been pointing out since 2015 or so is that even though debt was growing, it was only about in line with the growth in stock prices. We should expect that. It wasn't anything like 2000 and 2007 when debt ballooned "irrationally" more than stock prices.
Lately, we're starting to see the very beginning that this is changing. The jump in debt has outpaced the rise in the S&P 500 by nearly 20%.
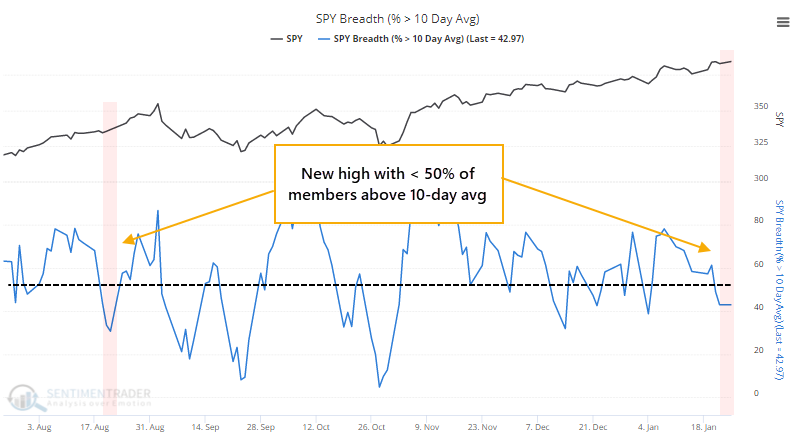
In multiple Daily Reports over the last couple of weeks, we've pointed out oddities on days the indexes rallied. That's a change from recent months, and by themselves, they're not a big warning sign. When it starts to spread, and we see clusters, then it's more of a worry.
The S&P 500 closed at another record high on Monday, and yet fewer than 45% of its stocks managed to close above their 10-day moving averages. That's a lot of short-term downtrends on a day the index closed at a high.
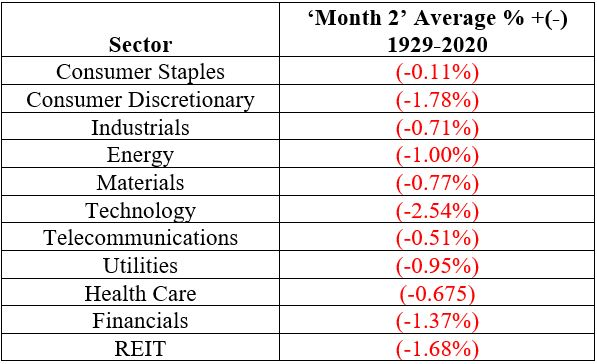
It's coming at a bad time. Jay points out that February of post-election years have been particularly weak, and especially for higher-beta sectors.
There were some positives, though.
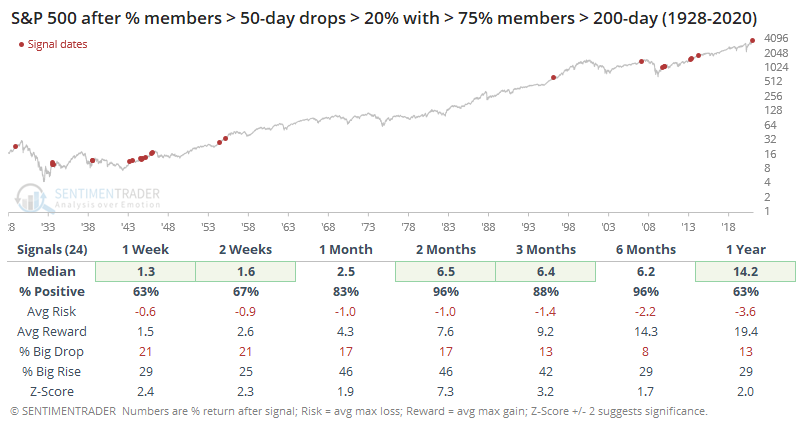
There was also a dramatic drop in the percentage of members in the S&P 500 holding above their 50-day moving averages. It plunged more than 20% on Wednesday alone (and moved even lower by Friday), even as well over 75% of stocks are still holding long-term uptrends. A swift correction in medium-term trends within the context of long-term uptrends has usually resolved to the upside, especially over the next 3-6 months. Three months later, there was only a single small loss, and the risk/reward was excellent.
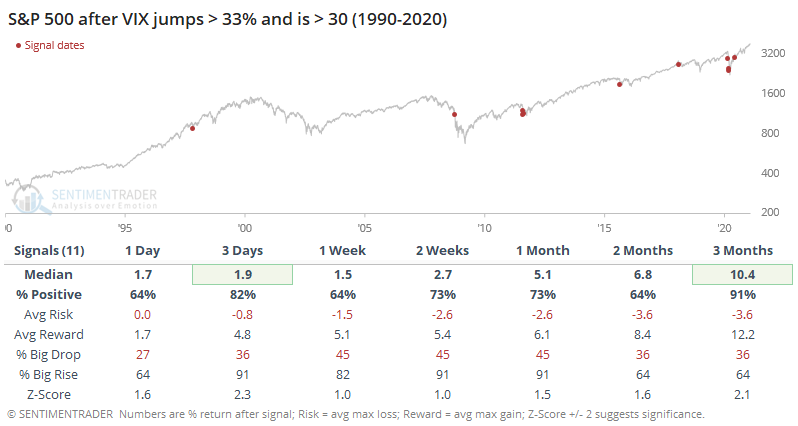
On Wednesday, there was a pretty big jump in the VIX, rising more than 40%. Big jumps when implied volatility is already elevated have tended to lead to higher prices in the S&P. Seems odd coming so soon off a peak, and probably not enough to cancel out all the negatives that have been building.
Dean highlighted another risk-on / risk-off model that's not yet triggering a longer-term "risk-off" mode. We'll be integrating many of these into the site in the coming weeks.
The model identifies instances when traditionally defensive sector members outperform the broad market as the S&P 500 Index hovers near highs. This has started to move higher in recent days, and if more utility and staple stocks outperform the S&P, this will move to risk-off mode, which we can see below has preceded some sustained trouble. This was likely getting close by Friday, as Health Care and Utilities were the 2 best sectors.
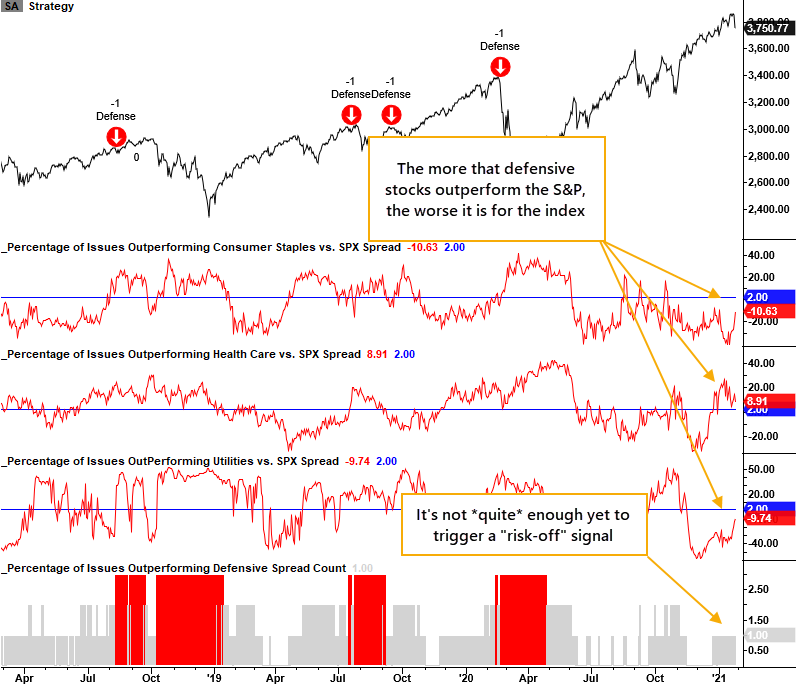
We've seen the initial cracks in what had been pristine internals. The typical pattern would be a choppy market, maybe even a challenge of the prior high, that is accompanied by more divergences and risk-off signals. If we saw that, we could move to a strong sell.
| BONDS |
 |
|
|
Jay looked at a very long-term trend-following strategy on rates. Focusing solely on the cumulative increase or decrease in yield points during those periods when the trend is up, it captures most of the very long-term uptrends while sidestepping prolonged bear markets (in interest rates).
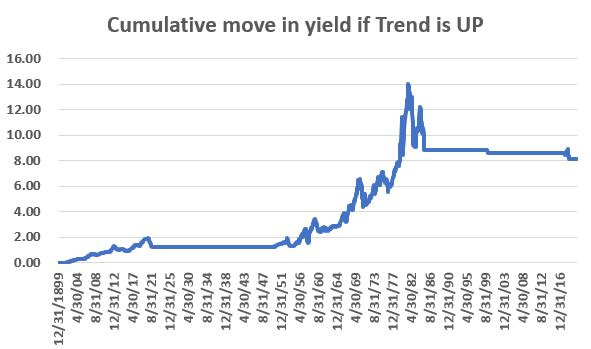
Even if the long-term trend in rates changes and we move into a prolonged period with rising rates, that didn't mean that all bonds declined. Jay also pointed out the average monthly return and the cumulative total return for various bond categories during rising-rate environments. There were several types of fixed income securities that would have given an investor a positive total return.
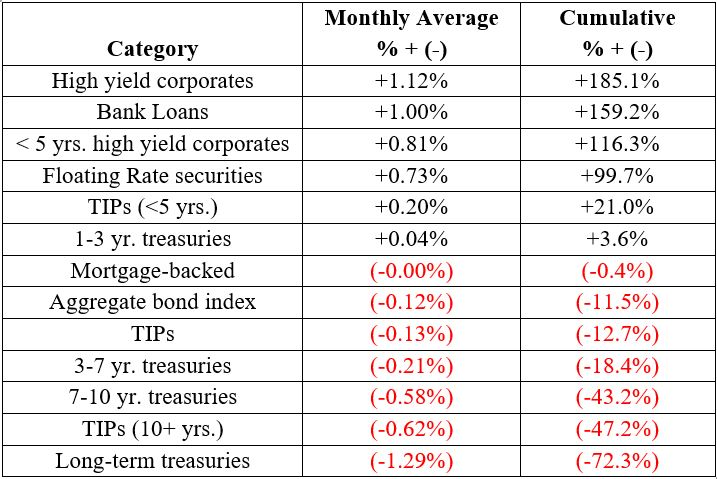
As more trend-following systems on Treasury yields suggest that a long-term shift toward higher rates might finally be coming to fruition, it's worth bearing in mind there are still ways to allocate to fixed income without suffering large losses, or perhaps even enjoying gains.
| COMMODITIES |
 |
|
|
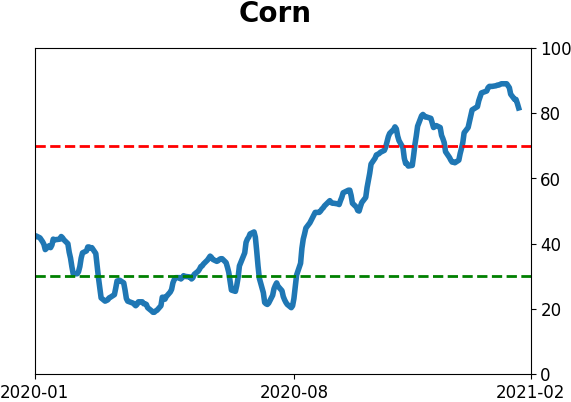
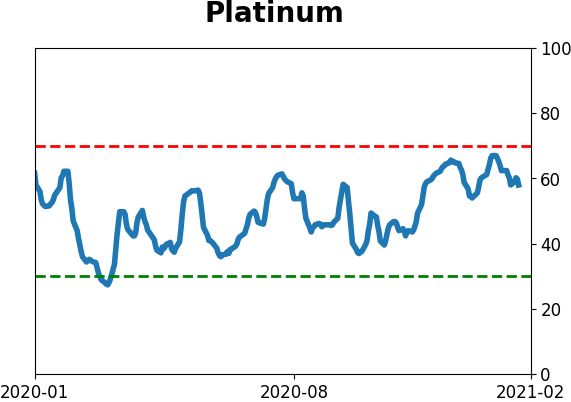
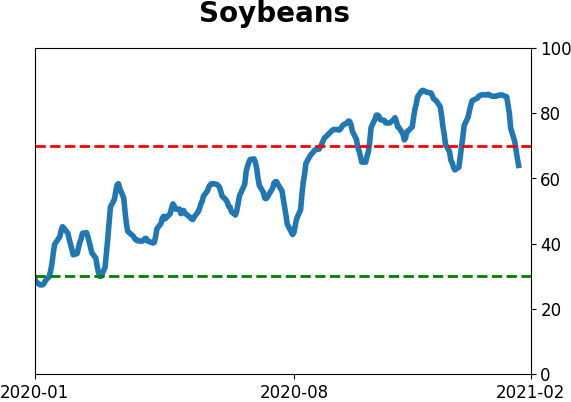
Jay noted that soybean futures have been on a tear since about mid-August 2020. Despite a knee-jerk assumption that such a rally can't continue, beans do have a consistent tailwind over the next 3 months.
The chart below displays the hypothetical dollar gain or loss that a trader might have experienced had he or she held long a 1-lot position in soybean futures ONLY during the months of February, March, and April every year since 1960.
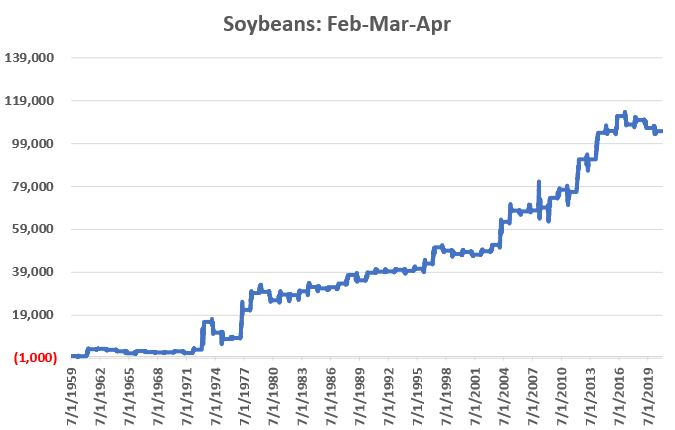
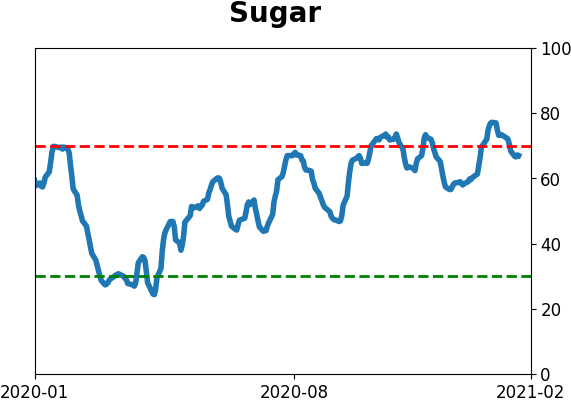
Over time, a properly capitalized trader has the potential to profit from a long position in soybeans during February through April. But on a year-to-year basis, the results can be very random as fundamental supply-and-demand factors vary widely. Sugar, on the other hand, did NOT fare well during these windows.
Active Studies
| Time Frame | Bullish | Bearish | | Short-Term | 0 | 0 | | Medium-Term | 2 | 3 | | Long-Term | 15 | 2 |
|
Indicators at Extremes
Portfolio
| Position | Description | Weight % | Added / Reduced | Date | | Stocks | 8.7% RSP | 8.7 | Reduced 28.8% | 2021-01-26 | | Bonds | 9.5% ANGL, 9.1% SCHP, 9.0% BND | 27.6 | Reduced 0.2% | 2021-01-26 | | Commodities | GCC | 2.3 | Reduced 2.1%
| 2020-09-04 | | Precious Metals | GDX | 8.9 | Added 4.8% | 2020-12-01 | | Special Situations | 10.3% XLE, 8.9% PSCE | 19.2 | Added 19.2% | 2021-01-26 | | Cash | | 33.4 | | |
|
Updates (Changes made today are underlined)
With a market that has seen the kinds of broad participation and big breath thrusts like we did in the fall, it's hard to become too negative. Those kinds of conditions have consistently preceded higher returns over the next 6-12 months. It's the interim that's more of an issue. Even conditions like that haven't prevented some shorter-term pullbacks. And when we combine an environment where speculation is rampant and recent days have seen an increase in cracks under the surface of the indexes, it's enough to become more defensive over a short- to medium-term time frame. We still don't have much confirmation from the price action in the indexes, so those who are more conservative would likely wait before increasing cash levels. In a bid to more closely align the portfolio with what most of our members consider "stocks", we have moved any sector-specific investments to the "special situations" category instead of "stocks." This way, the "stocks" category is essentially the most benchmarked index in the world, the S&P 500. RETURN YTD: 1.8% 2020: 8.1%, 2019: 12.6%, 2018: 0.6%, 2017: 3.8%, 2016: 17.1%, 2015: 9.2%, 2014: 14.5%, 2013: 2.2%, 2012: 10.8%, 2011: 16.5%, 2010: 15.3%, 2009: 23.9%, 2008: 16.2%, 2007: 7.8%
|
|
Phase Table
Ranks
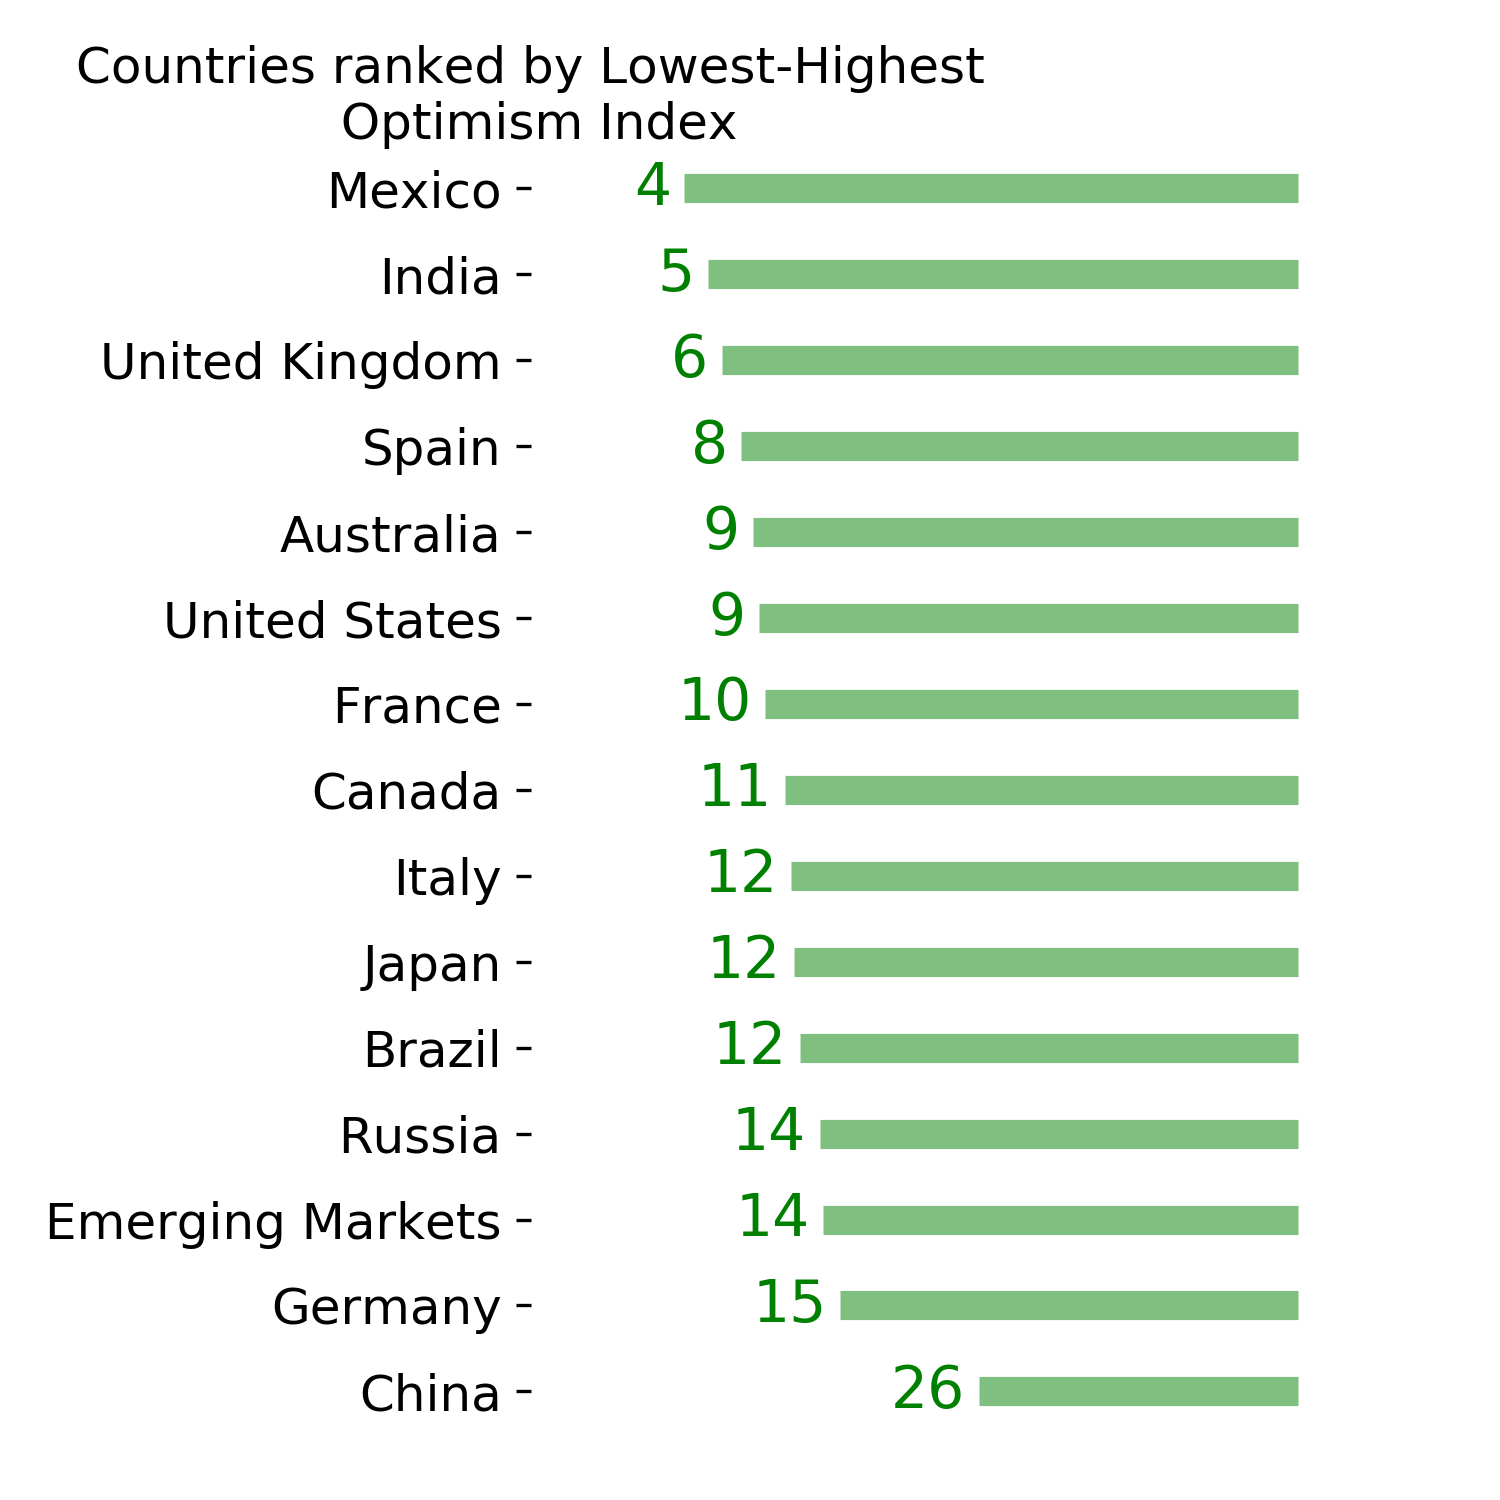
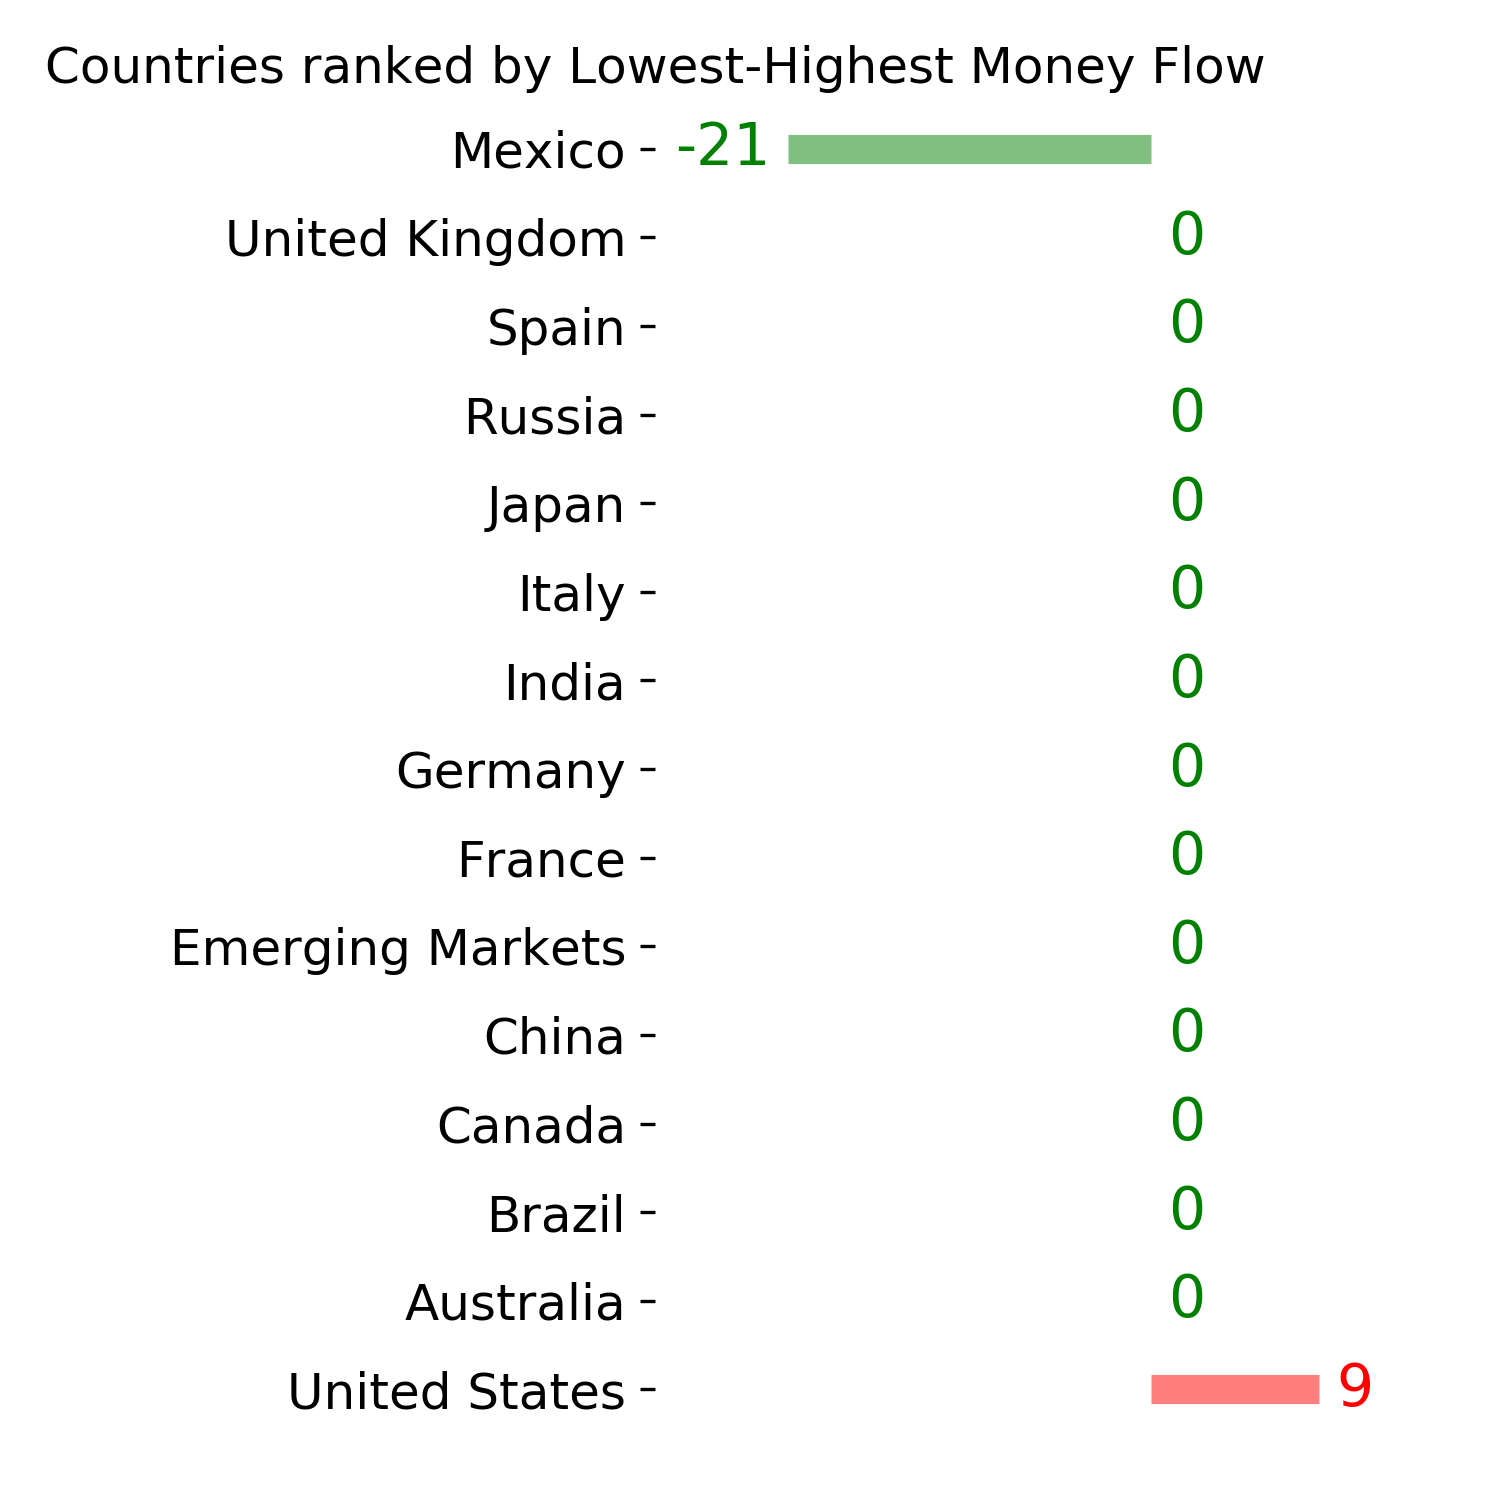
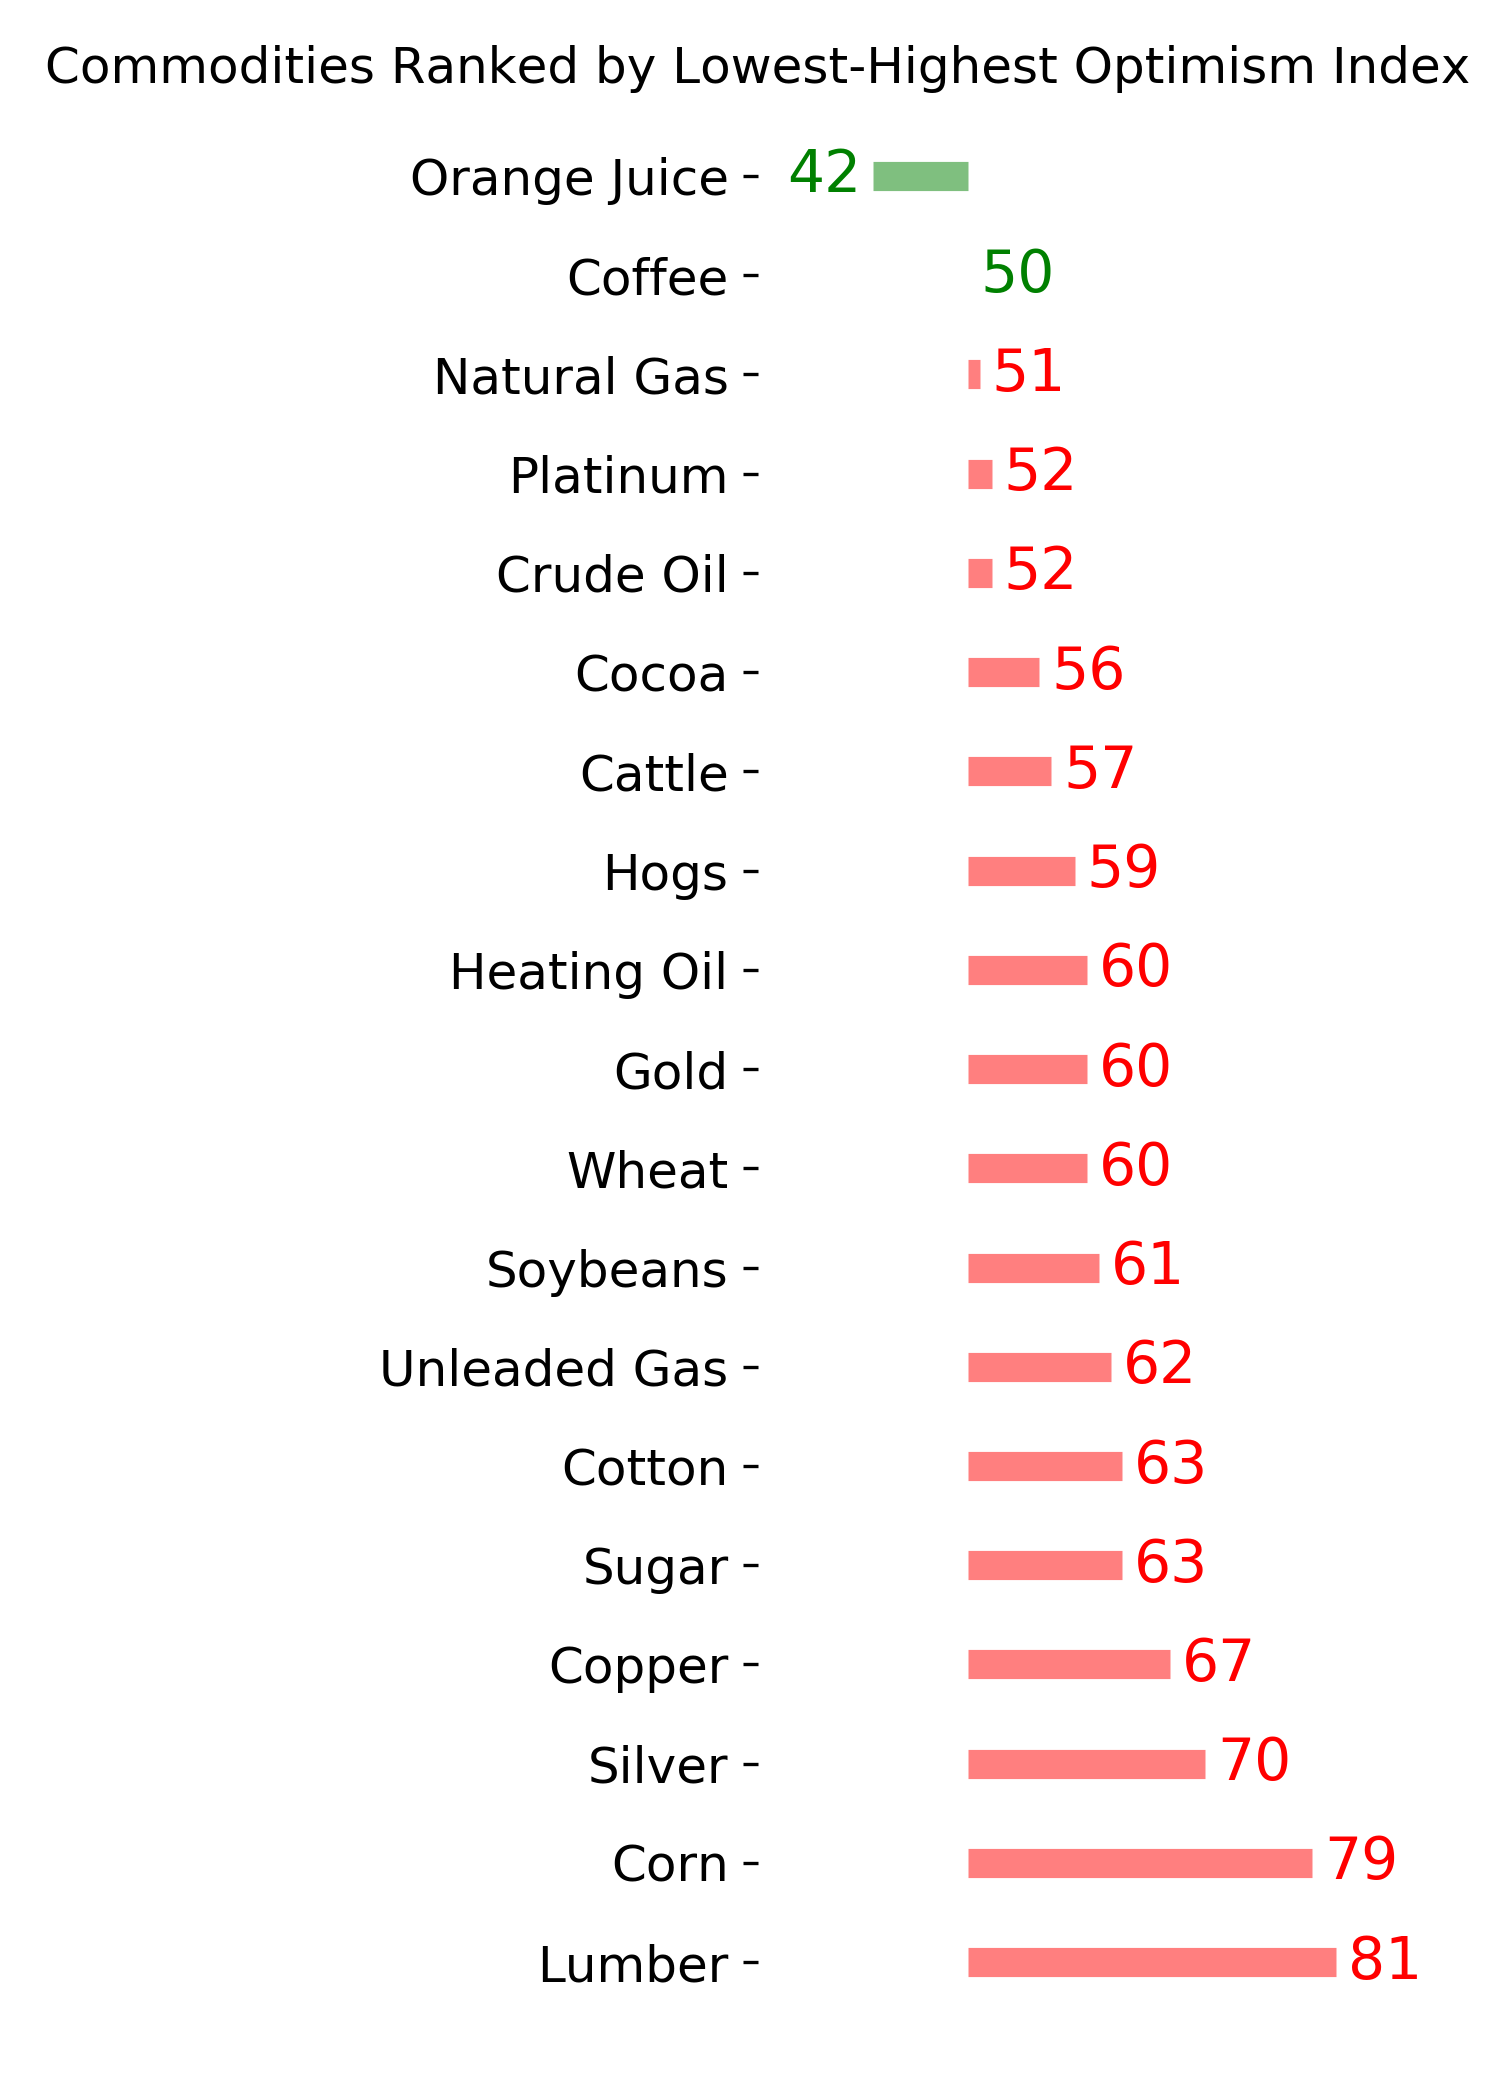
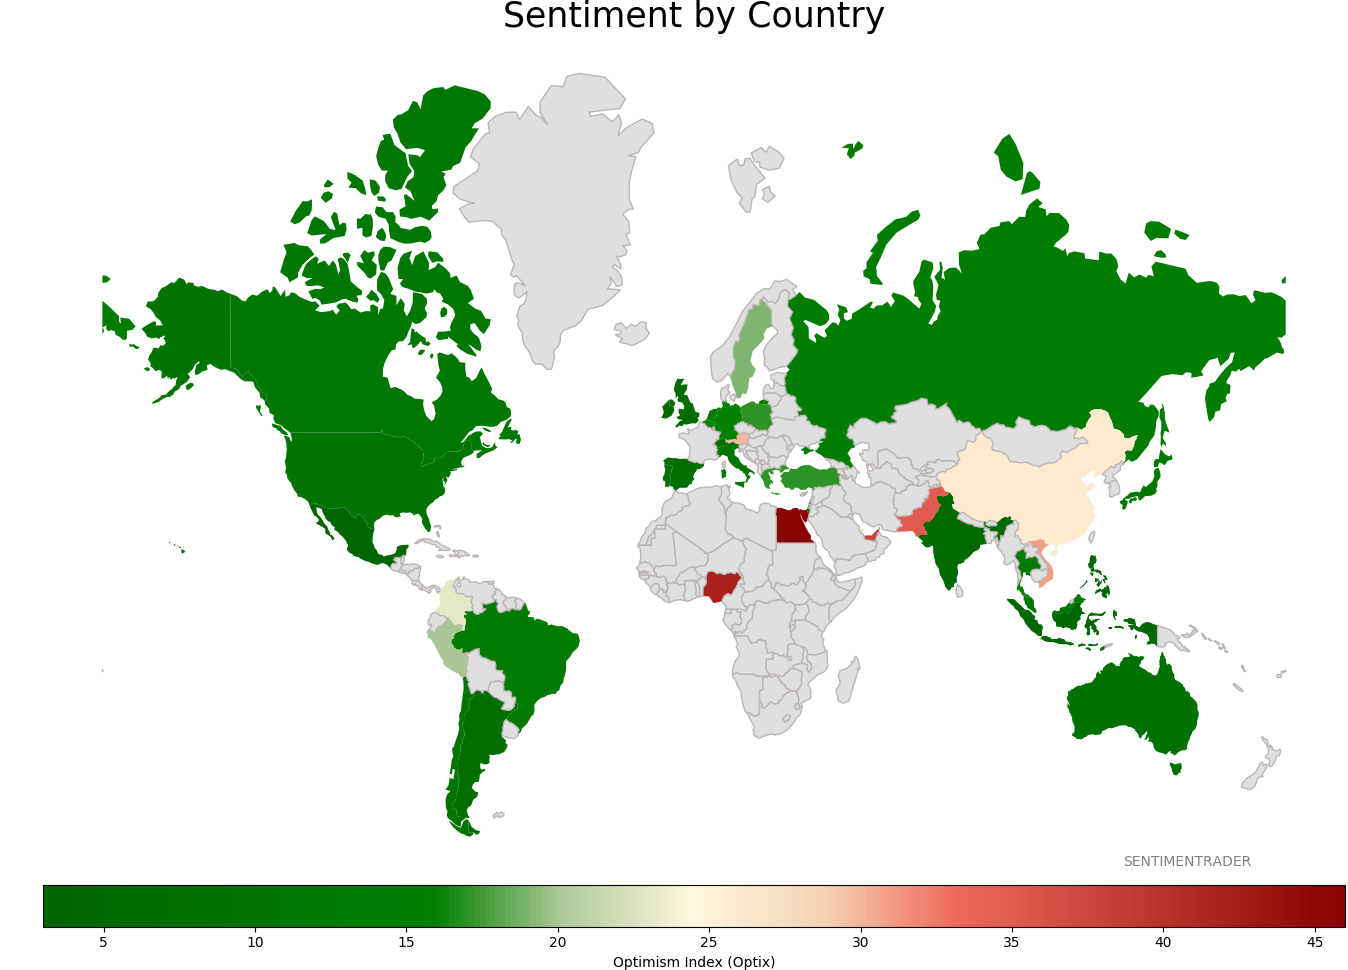
Sentiment Around The World
Optimism Index Thumbnails
|
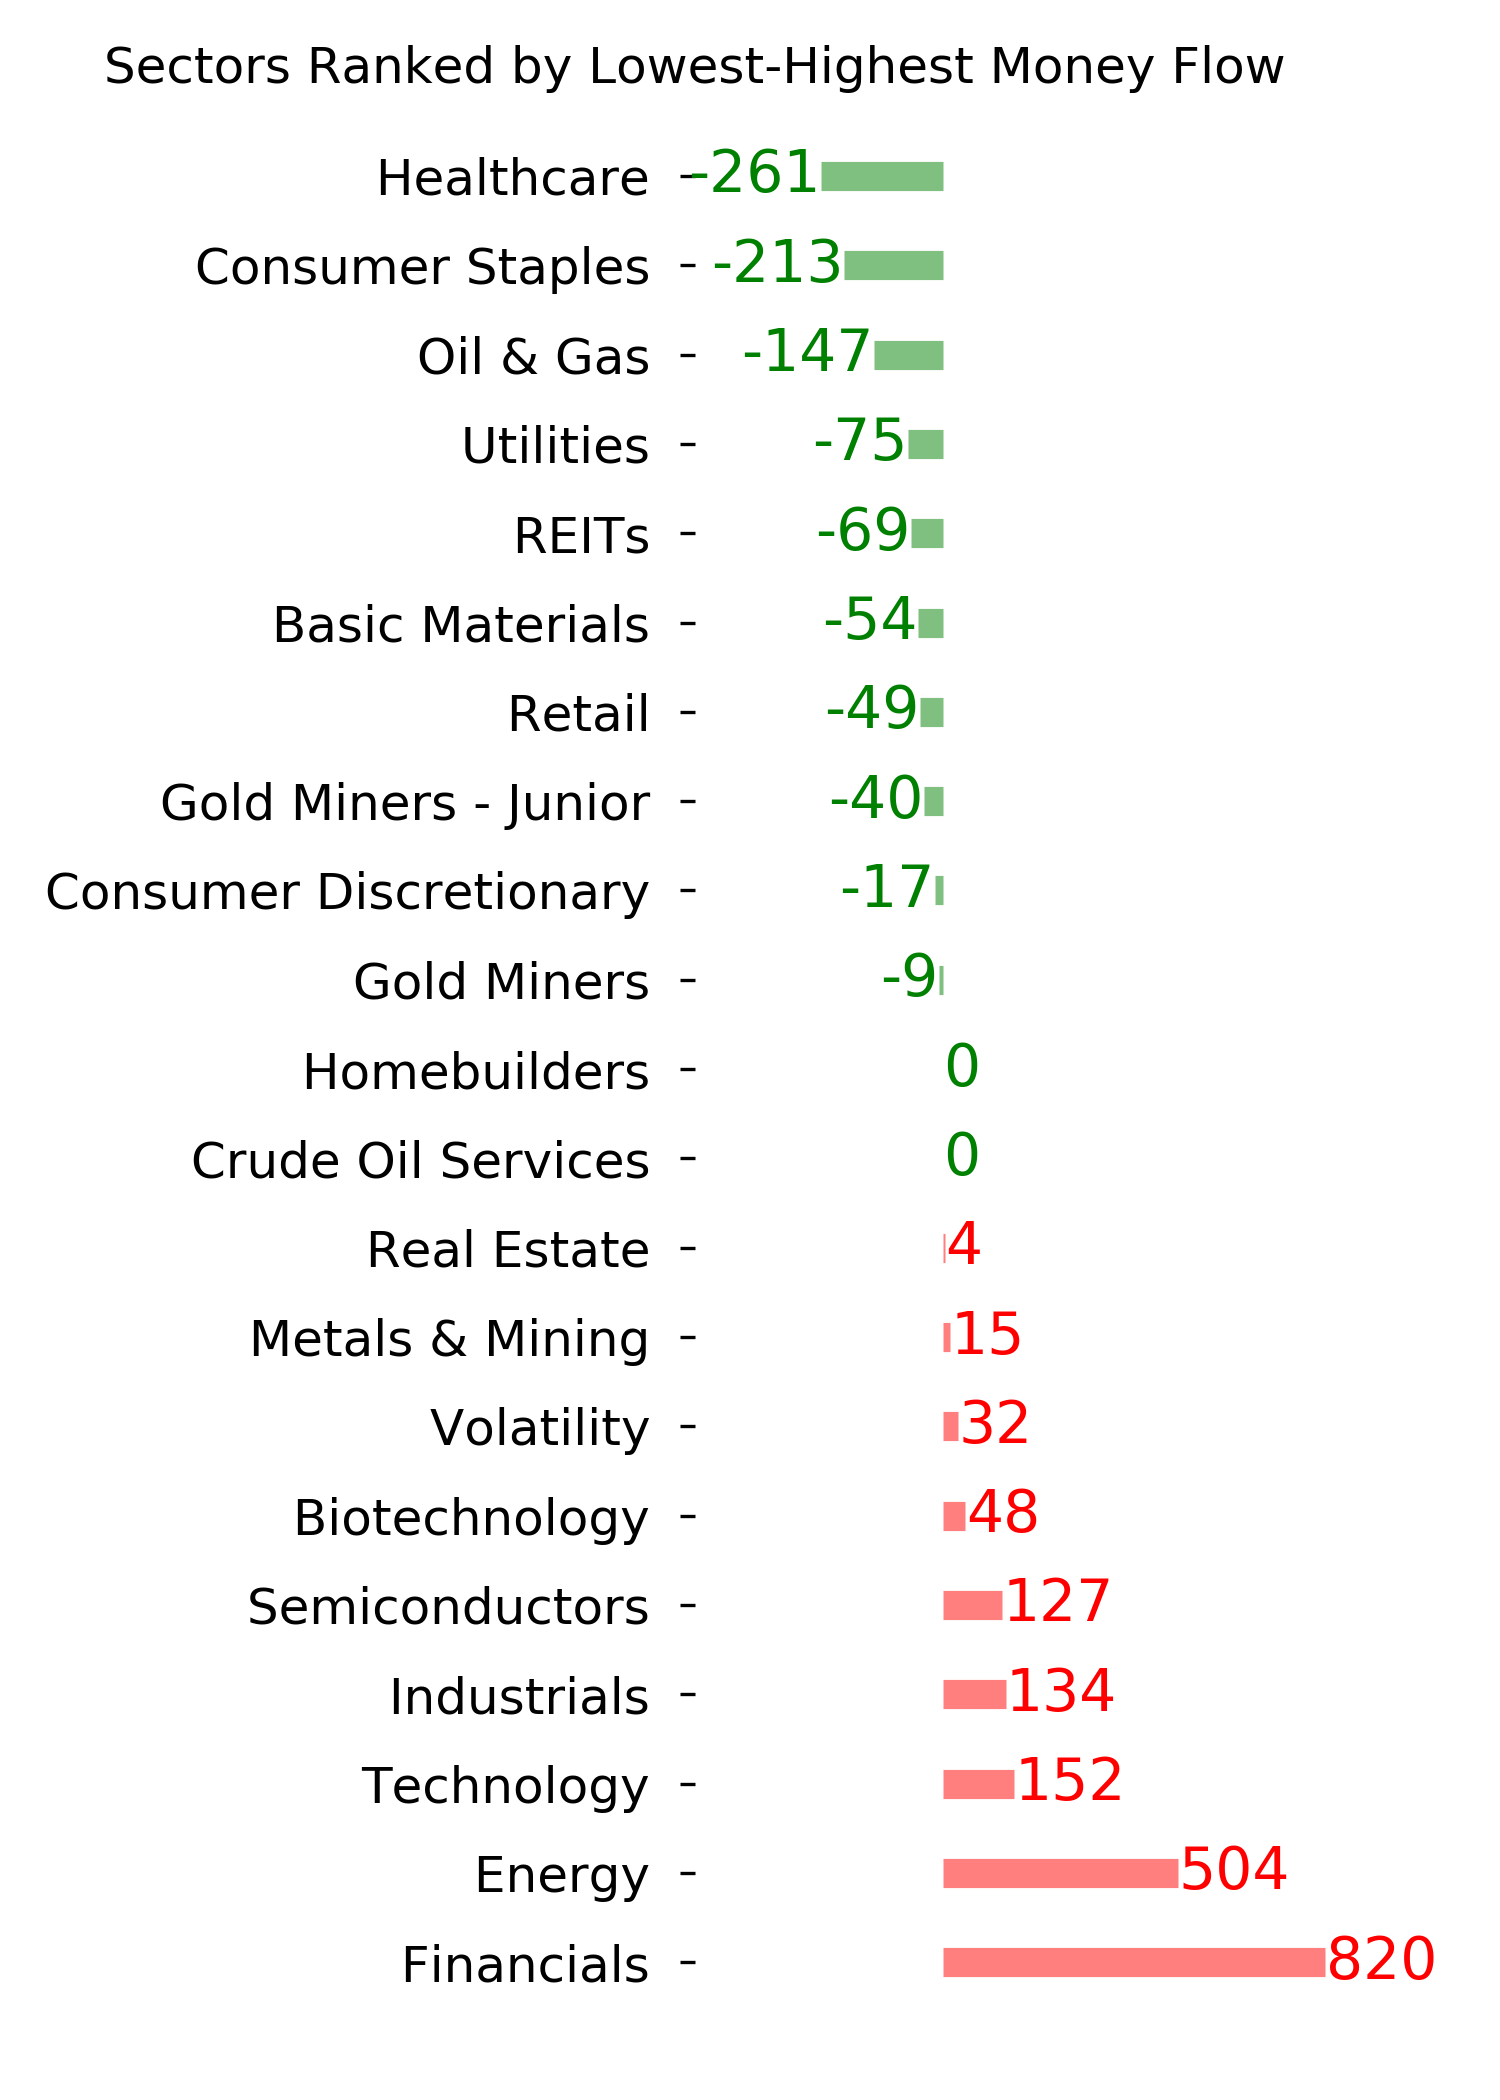
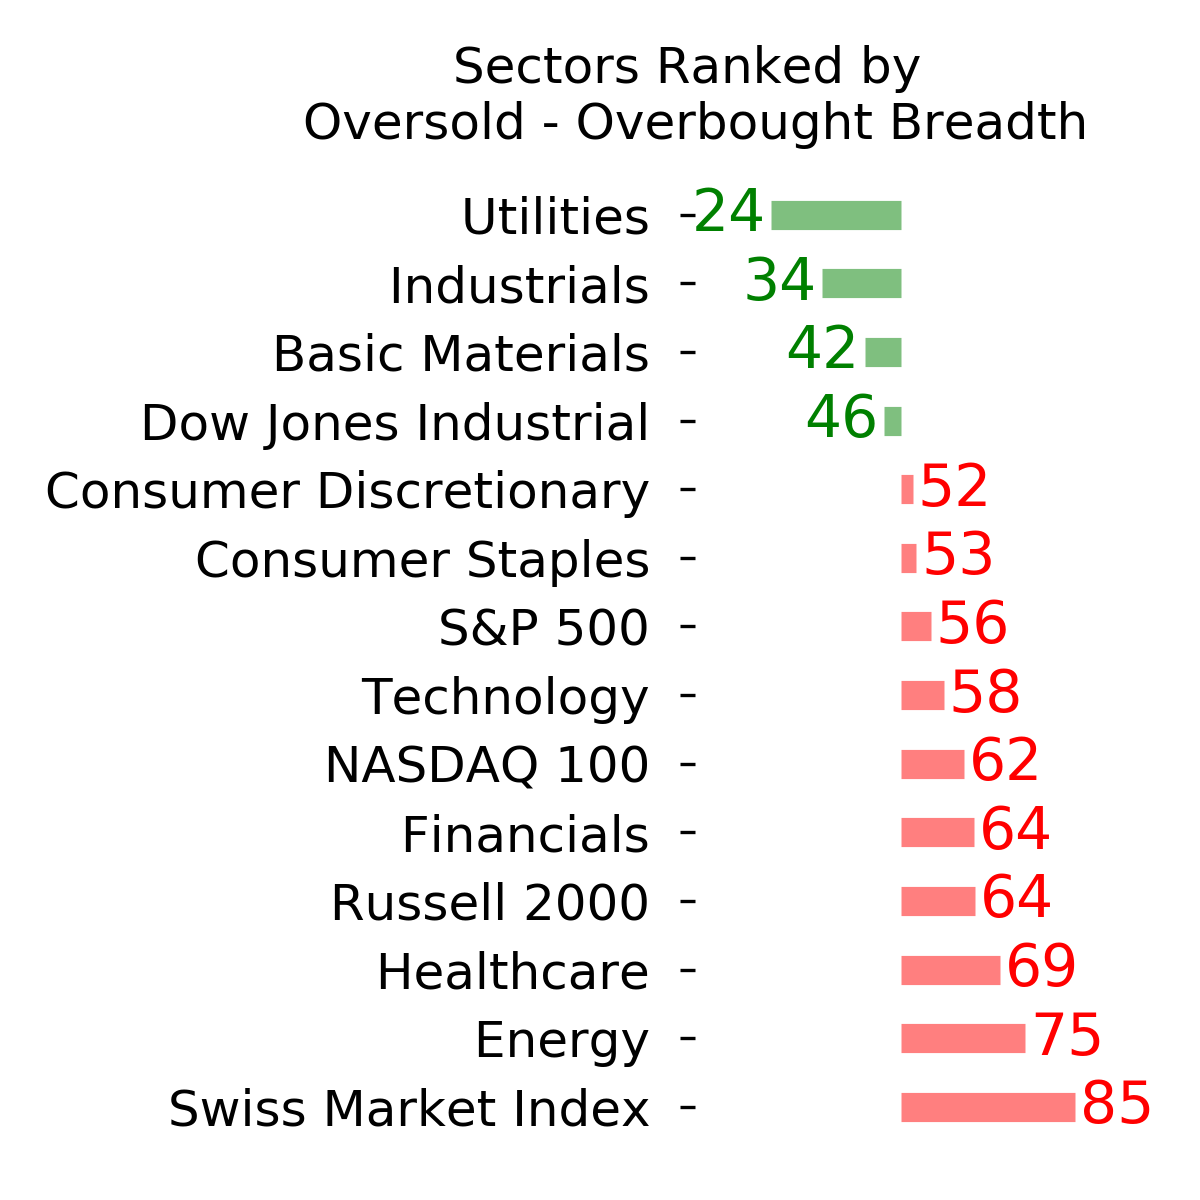
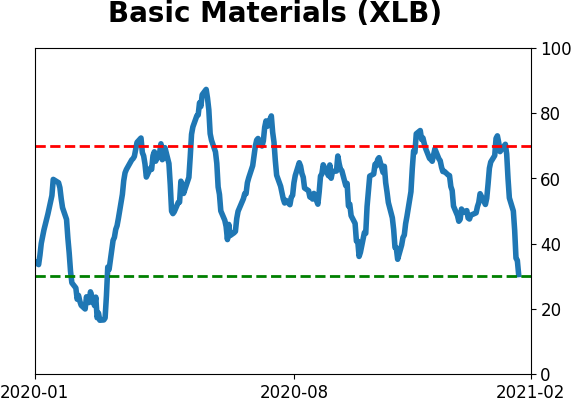
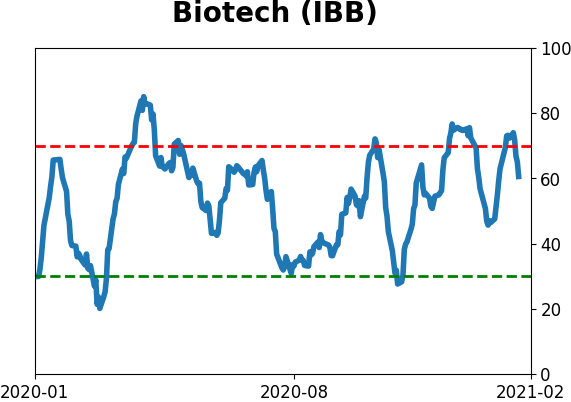
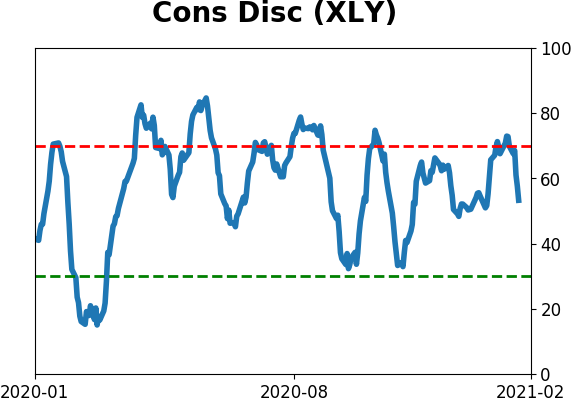
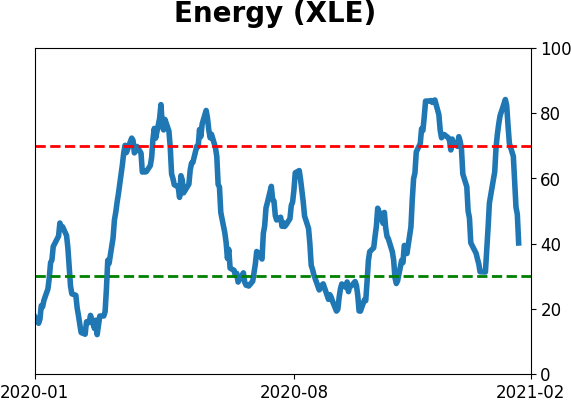
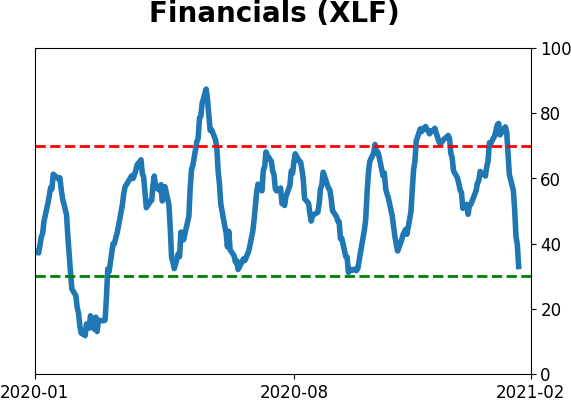
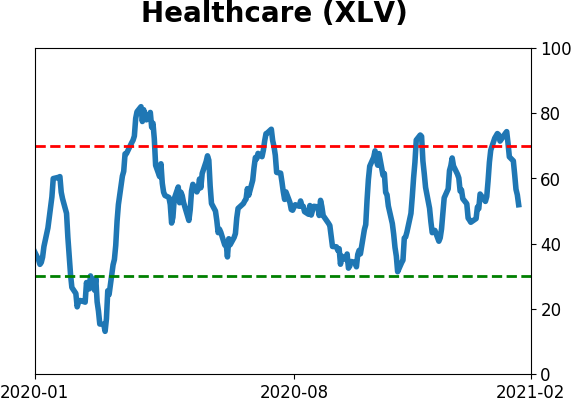
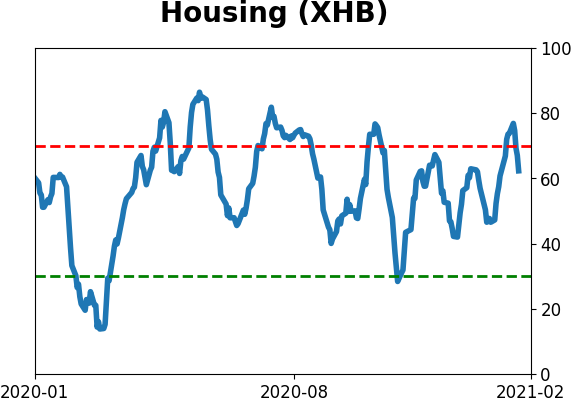
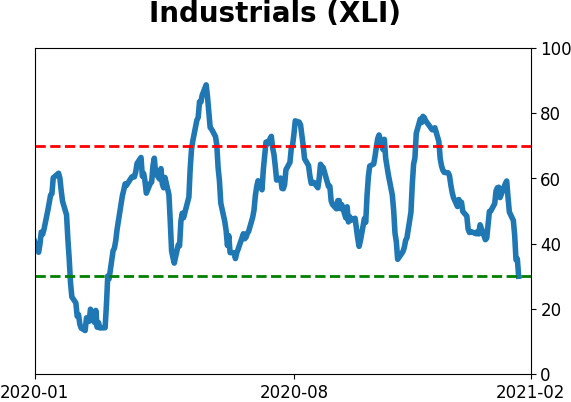
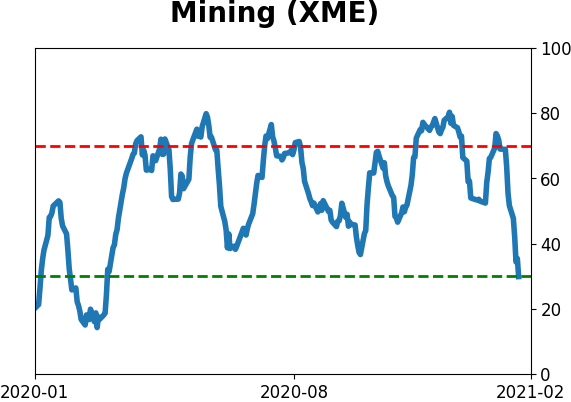
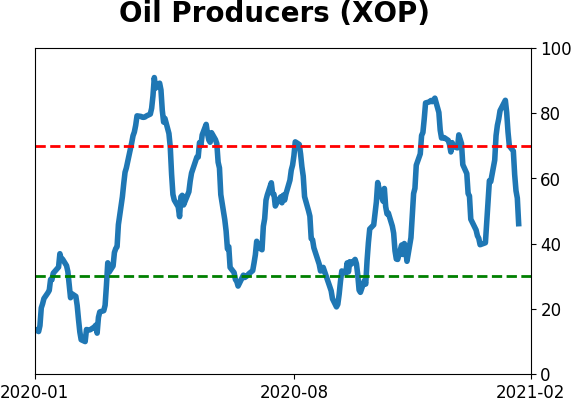
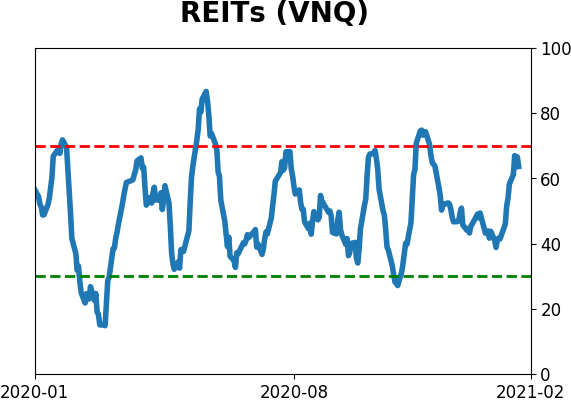
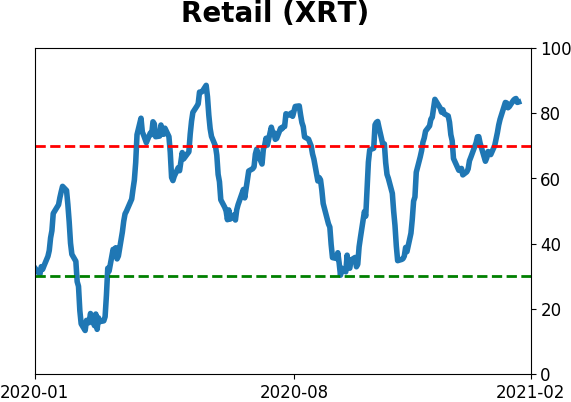
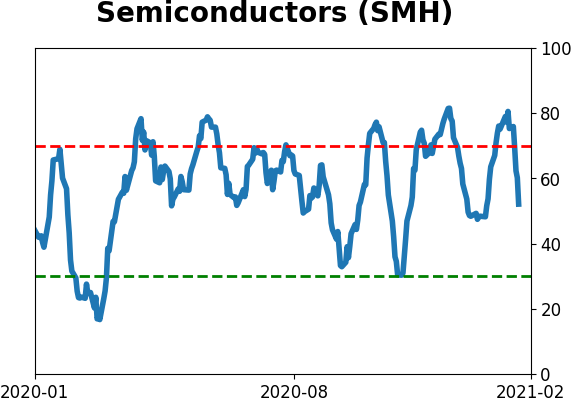
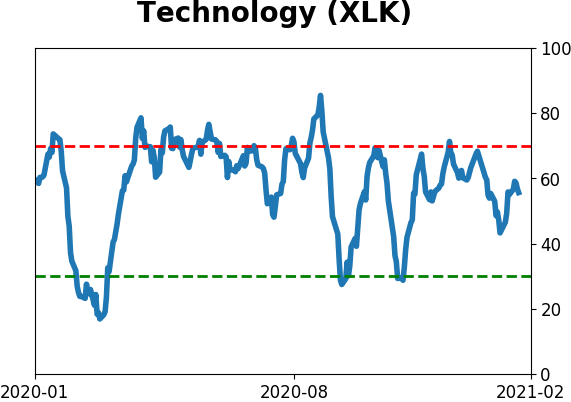
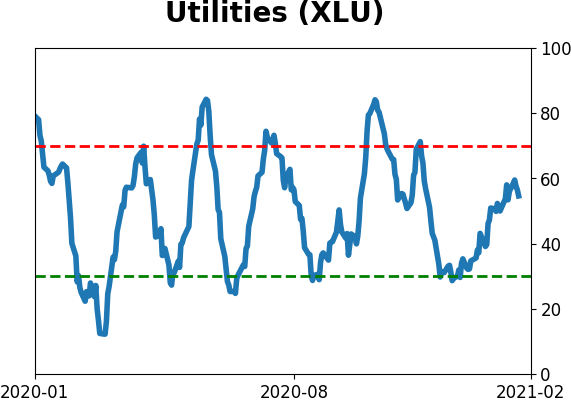
Sector ETF's - 10-Day Moving Average
|
|
|
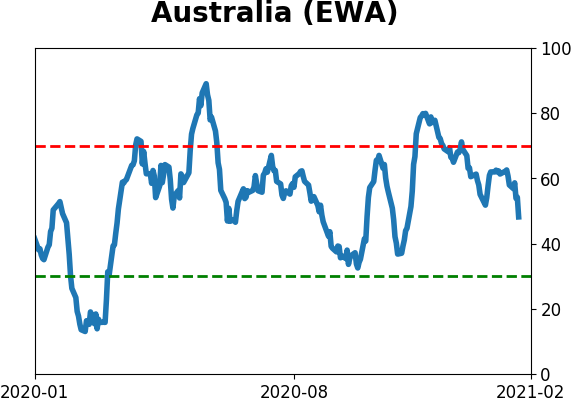
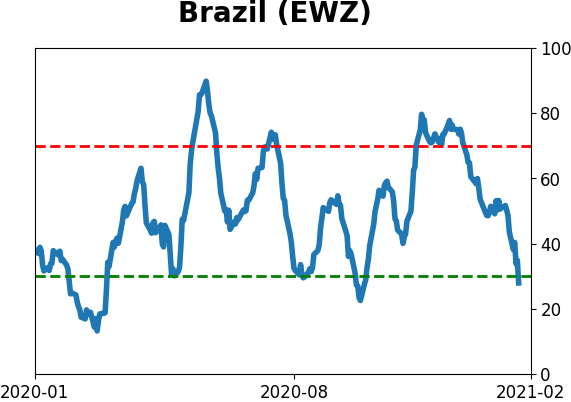
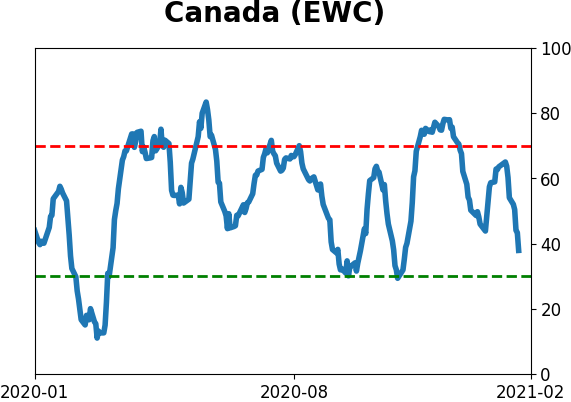
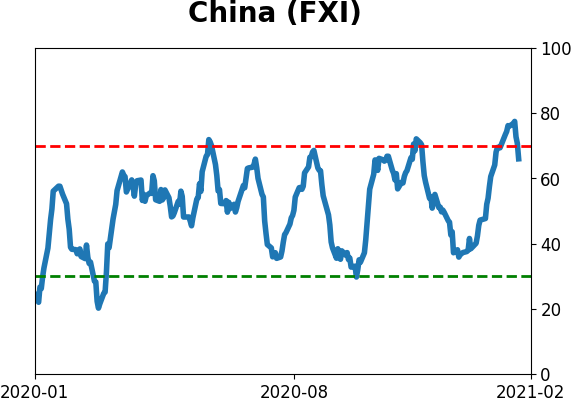
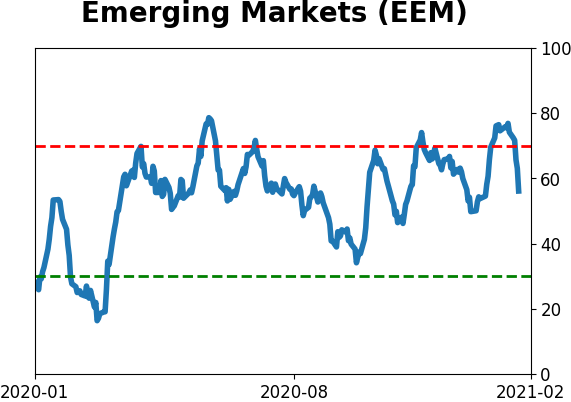
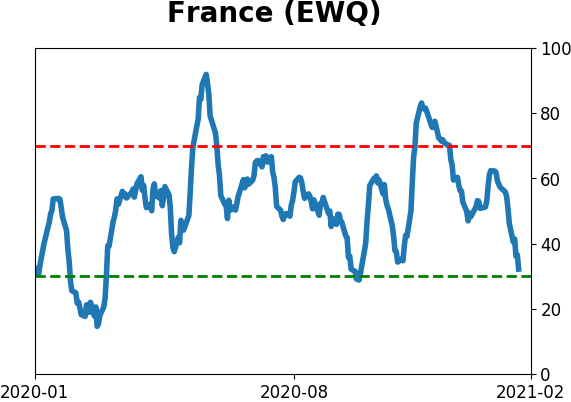
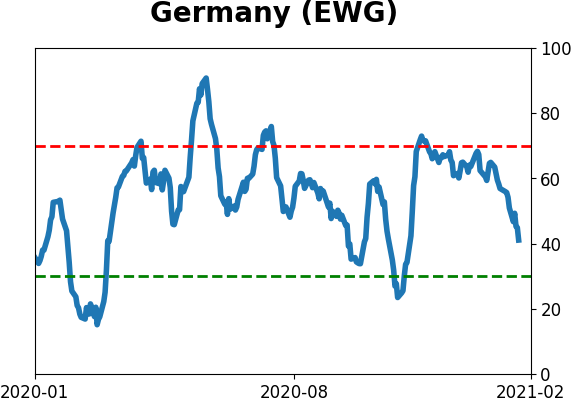
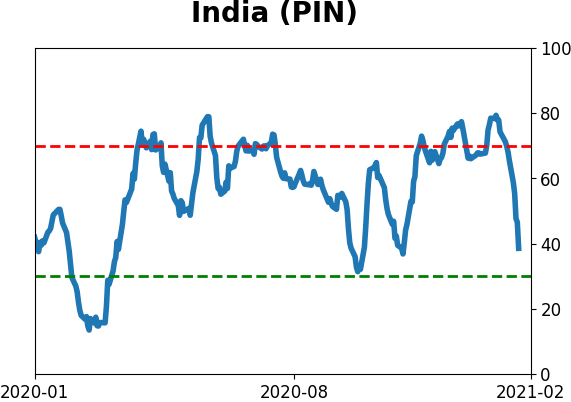
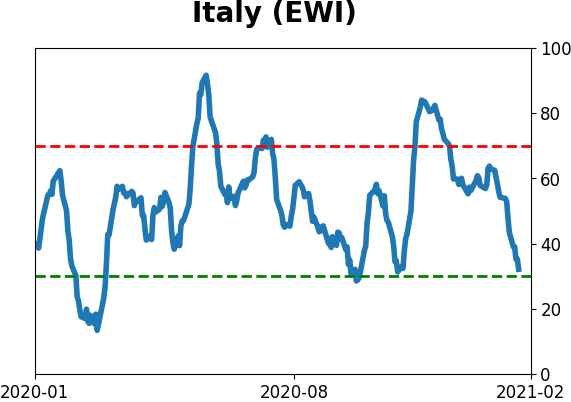
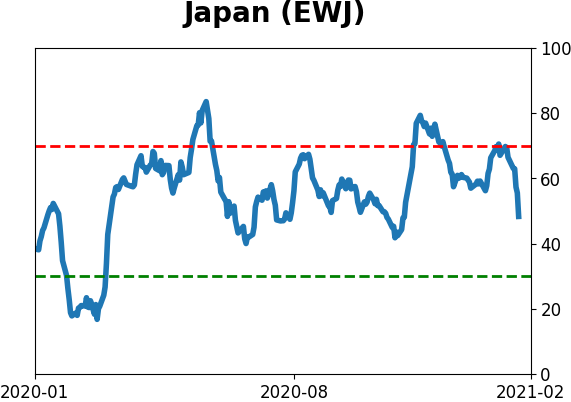
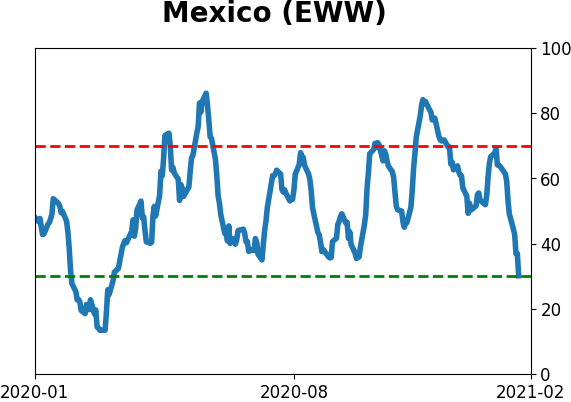
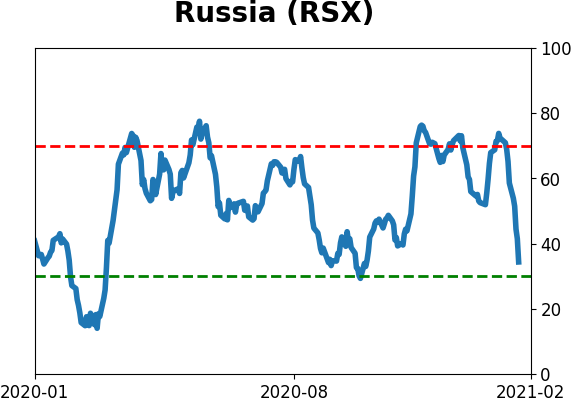
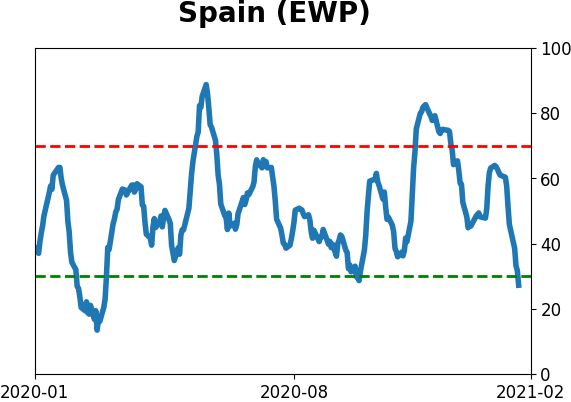
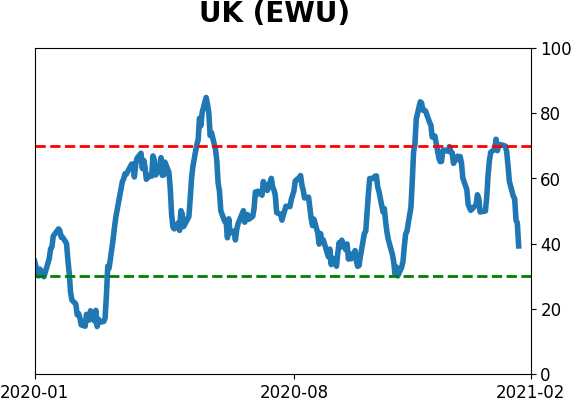
Country ETF's - 10-Day Moving Average
|
|
|
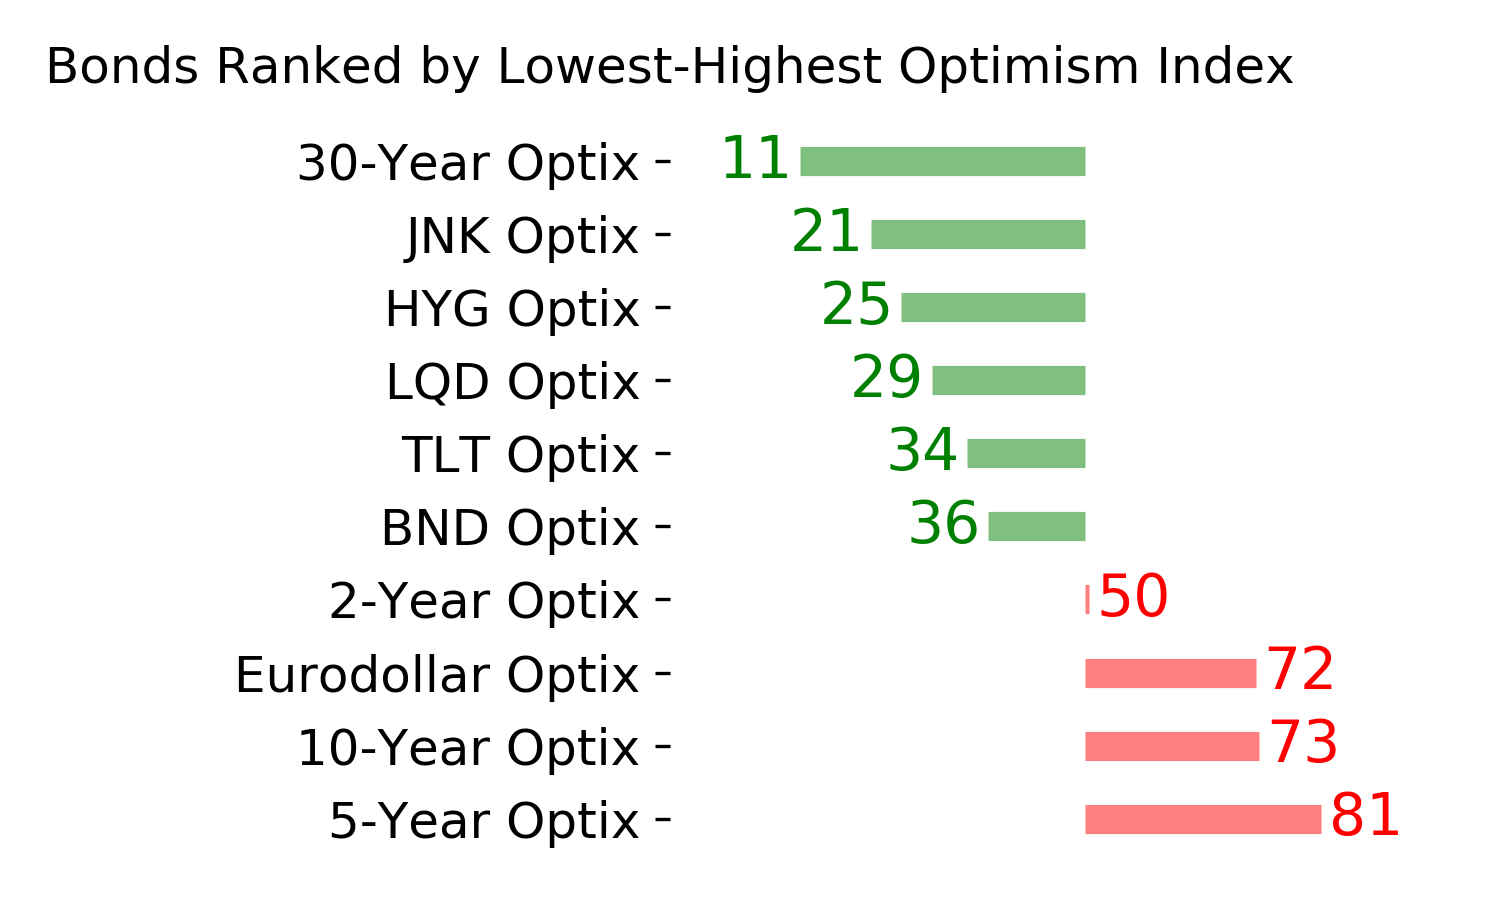
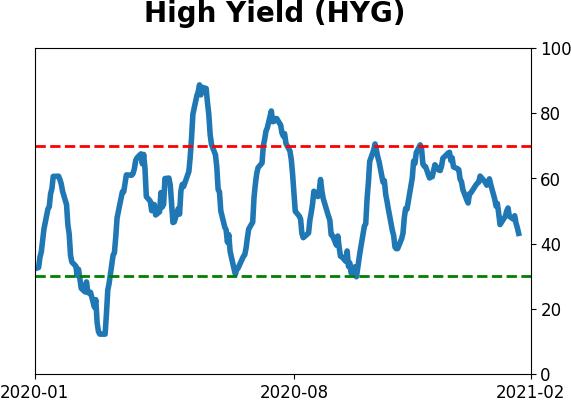
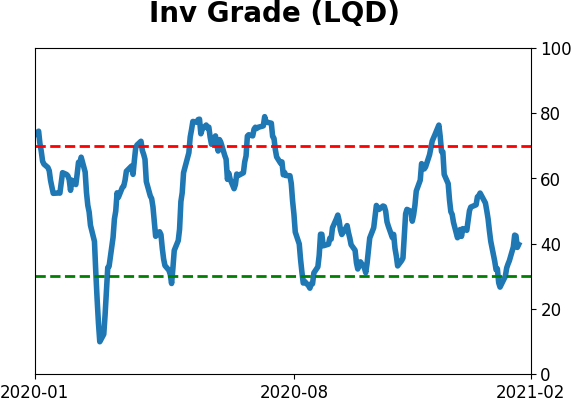
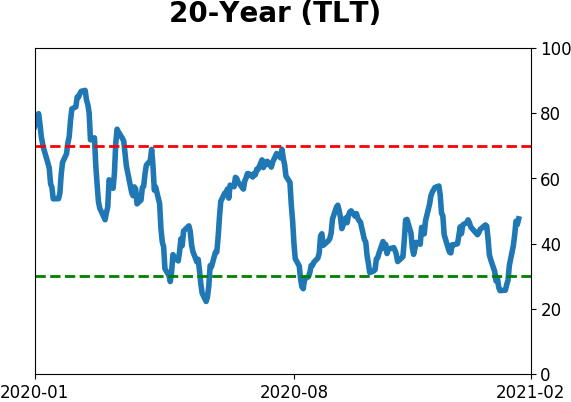
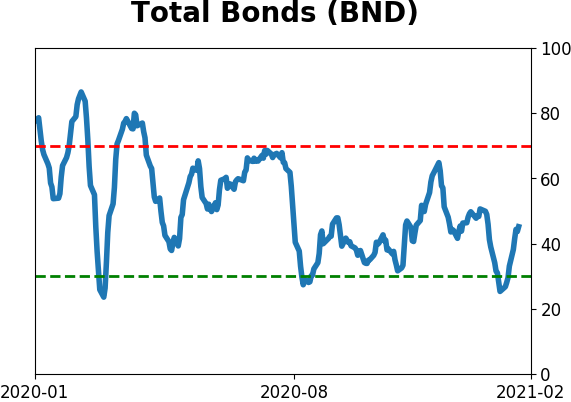
Bond ETF's - 10-Day Moving Average
|
|
|
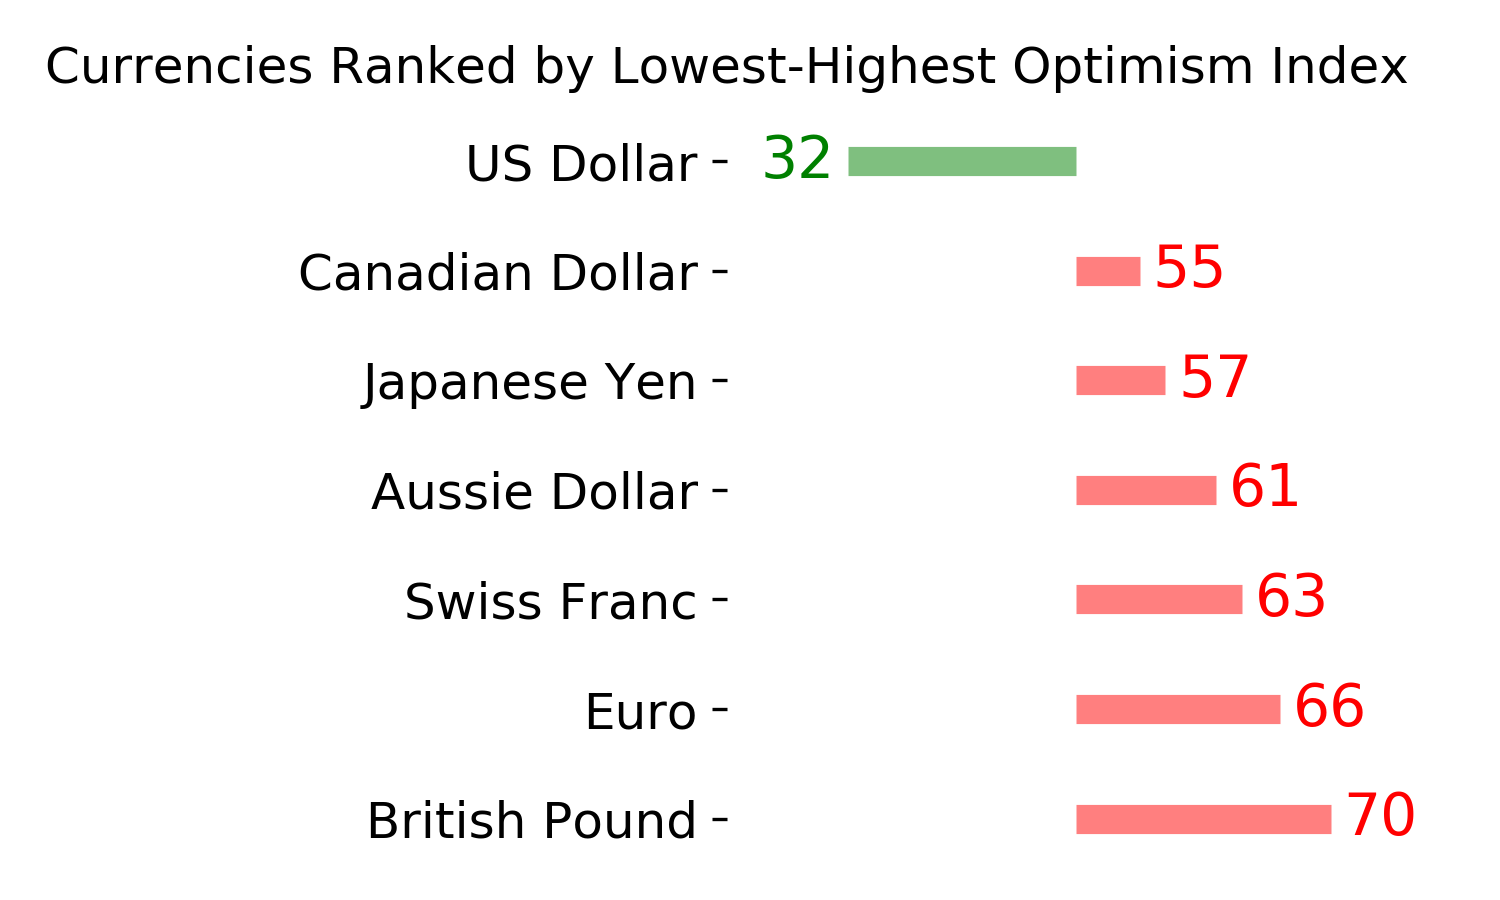
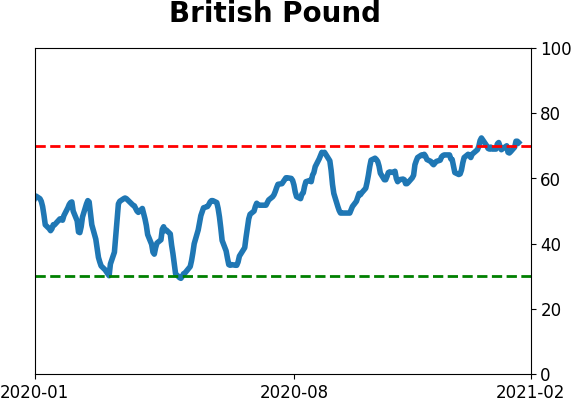
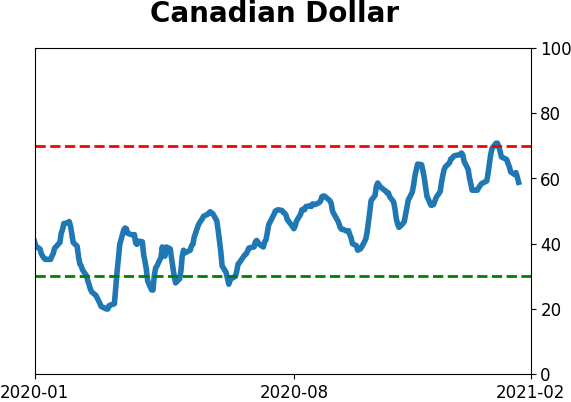
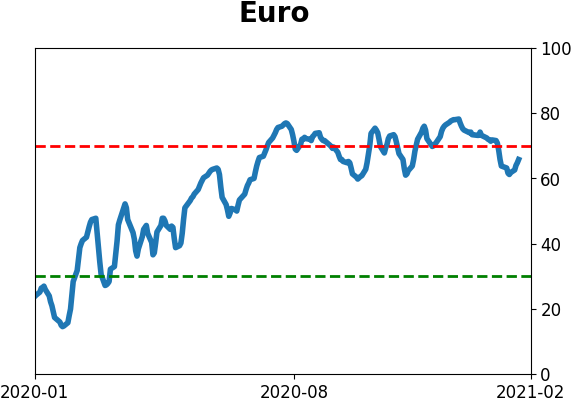
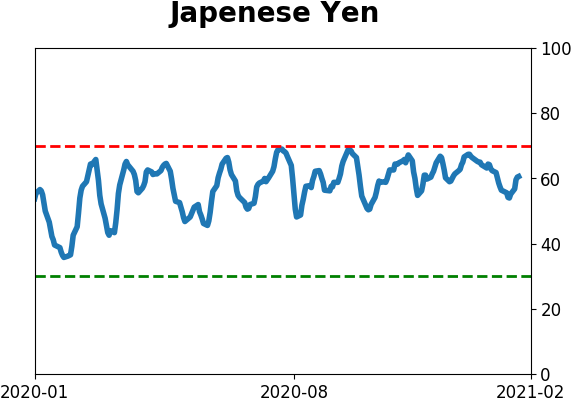
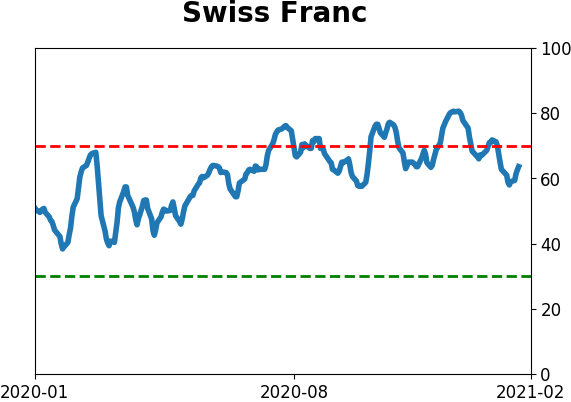
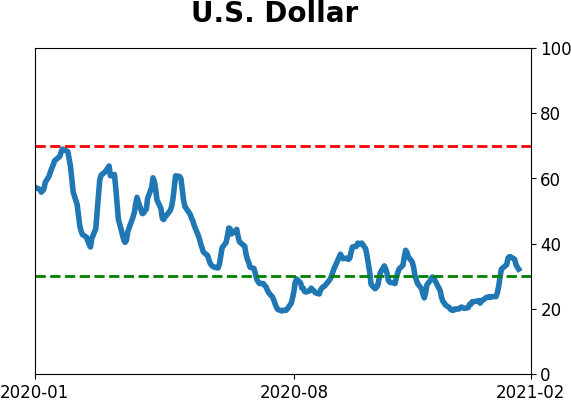
Currency ETF's - 5-Day Moving Average
|
|
|
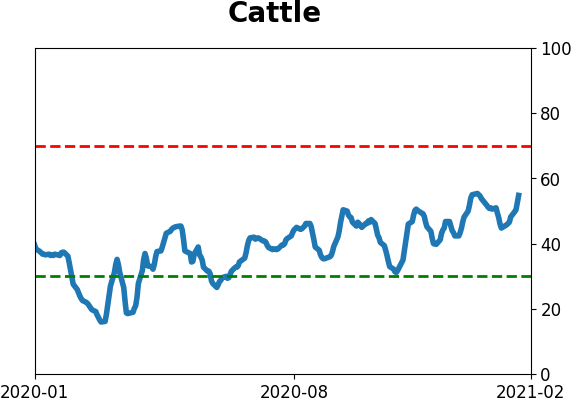
Commodity ETF's - 5-Day Moving Average
|
|