
Minutes Digest for Jan 27 2021

Fear rising
- Published:
2021-01-27 14:30:13 - Author: Jason Goepfert
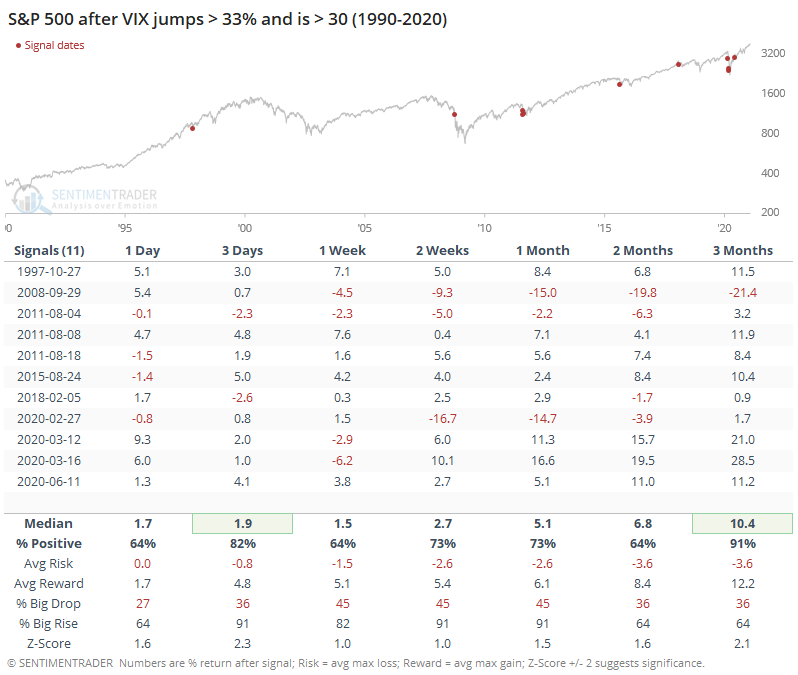
Pretty big jump so far today in the VIX, rising more than 40% as I type, and it's over 30. Big jumps have tended to lead to higher prices in the S&P. Seems odd coming so soon off a peak, and probably not enough to cancel out all the negatives that have been building, but it's always a popular question.
Huge Internal Rotation
- Published:
2021-01-27 08:50:20 - Author: Dean Christians
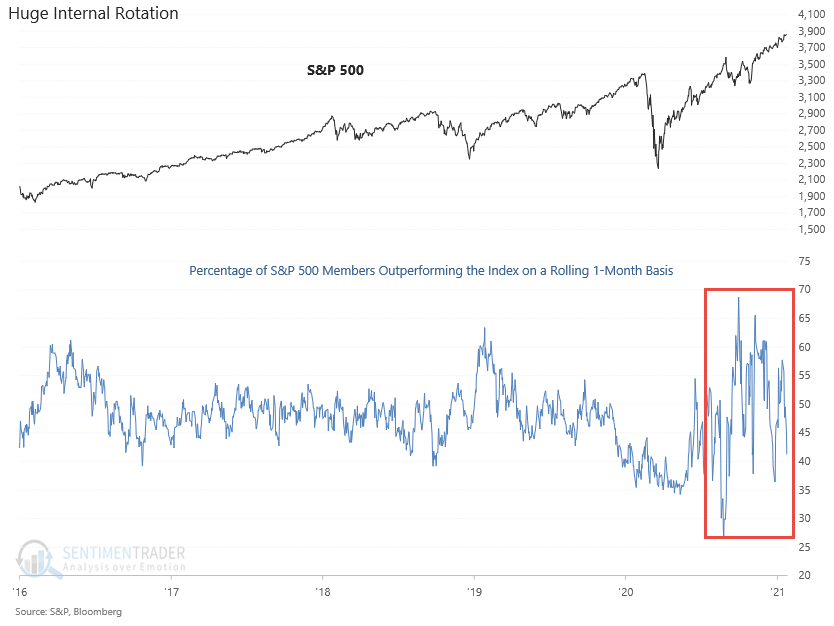
Jason and I have highlighted some oddities in short-term breadth measures of late. The indicators run counter to several long-term studies that remain constructive. We can add one more item to the list of oddities. The percentage of S&P 500 members outperforming the Index on a rolling 1-month basis contracted in a significant way over the last six trading days. The indicator experienced a decline of 16.44%. Significant gyrations up and down in this indicator are a sign of internal rotation.
Let's take a look at some historical chart examples of the indicator.
Current Chart for Members Outperforming Index
As one can see, the gyrations up and down since late July have been significant. It's not uncommon to see this type of internal rotation around market transition periods. i.e., bear to bull or bull to bear. What makes this period different from others is the duration. The process is occurring in a brief period.
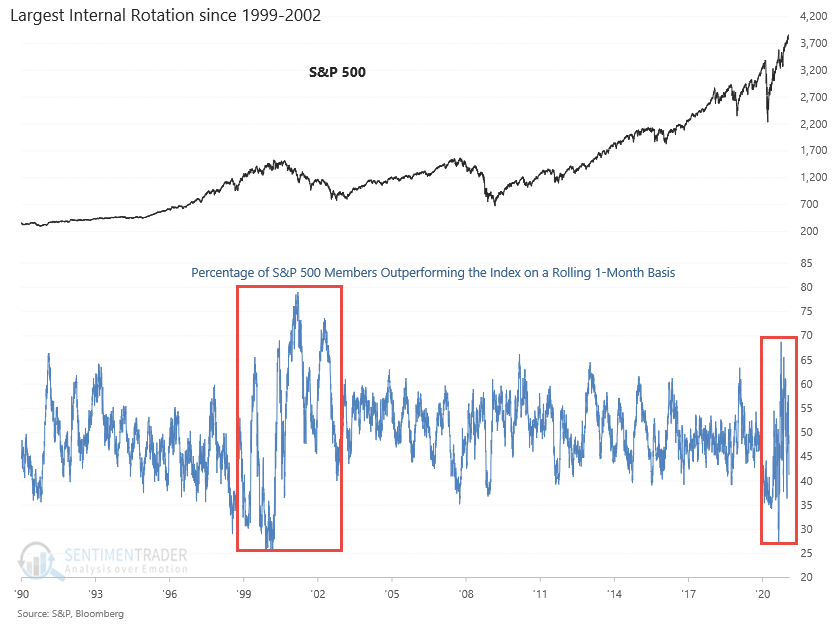
1999-2002 Example
If we zoom out to include the 1990's in our chart, we can see the internal rotation in the 1999-2002 period. While the gyrations were more significant than the current day, they occurred over a much longer timeframe.
If we zoom out further and look at the 6-day net change in the percentage of members outperforming, one can see the large up and down swings from a historical perspective. I count four instances where the 6-day net change crossed above 15% and four where it crossed below -15% since July 2020. That's the most in history in such a brief period. Please note, the red dots in the chart represent readings of -15% or less.
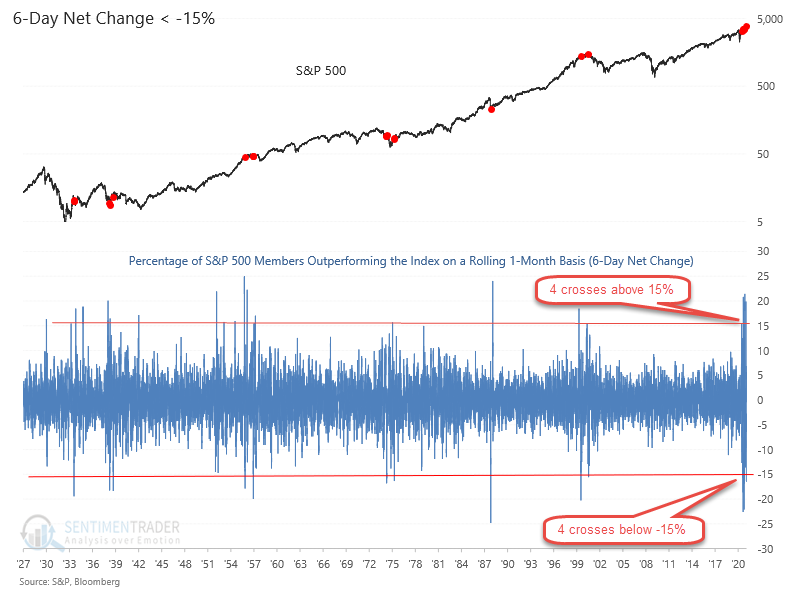
Conclusion: I suspect the extreme internal rotation in such a brief period is a sign of investor uncertainty around the disconnect between some segments of the economy and the stock market. Investors are struggling with the growth versus value conundrum.
Gap trap
- Published:
2021-01-27 08:06:55 - Author: Jason Goepfert
Futures are gyrating around a 1% loss for the S&P 500 at the open. Using SPY, that's the 2nd-largest gap down in 3 months. Below, we can see SPY's returns from the open of any day it gapped down at least 1% within 2 days of having set a 52-week high.
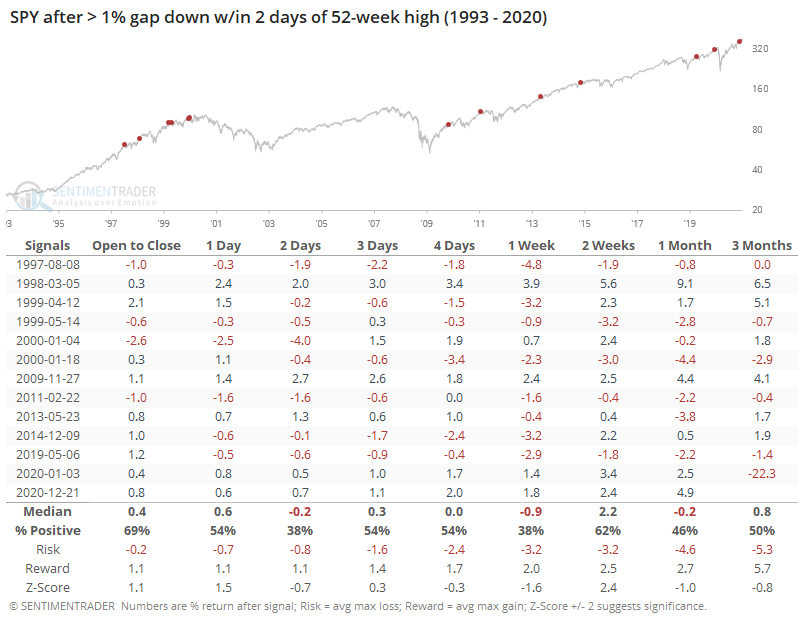
It had a mild tendency to rally intraday, but then showed mostly weakness in the days, even weeks, following.
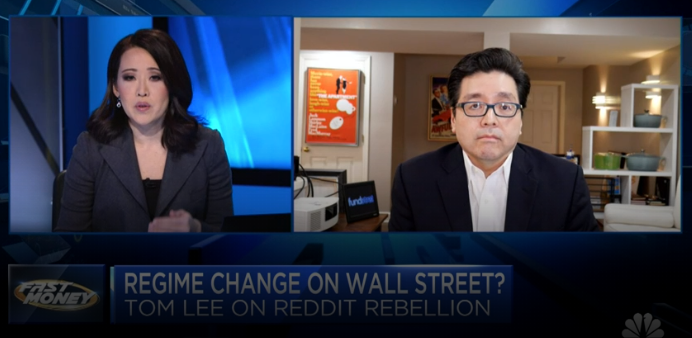
The rhyme of regime change
- Published:
2021-01-27 07:08:07 - Author: Jason Goepfert
We shy away from subjective and anecdotal evidence here, but this recent interview, amid a flurry of similar ones in recent days, just rings too many bells. It's not to pick on Tom Lee, he's been steadfastly bullish and correct. It's the narrative of "regime change" in mainstream financial media that's the issue.
Searching through old articles, this one from Fortune on February 21, 2000, reads like it could have been printed yesterday with only the names changed.
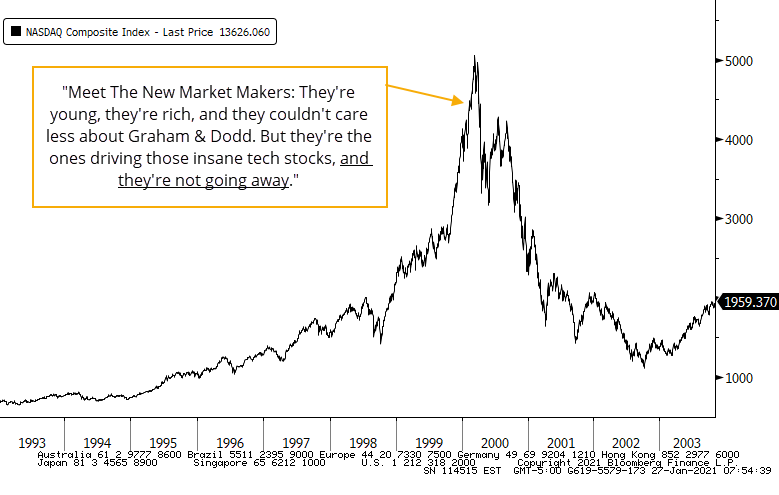
The quotes below are pulled directly from the Fortune article. The similarities to recent reports are eery.
- "All tech companies, and almost all linked to the growth of the Internet, these stocks have proven irresistible for mutual fund managers and day traders alike, and they've amassed huge valuations in recent months. JDS Uniphase is now worth over $60 billion, almost $10 billion more than the No. 1 company in the FORTUNE 500, General Motors."
- "Instead we found a rowdy, raucous bazaar driven mainly by gut instinct. It's not what anyone over 30 is used to, but there's no use tut-tutting. It's here to stay."
- "The cumulative impact is mind-boggling. On Feb. 2, the firm's traders accounted for just under 3% of Nasdaq's overall volume--40 million shares. The impact is even greater among the hot tech companies that are the day traders' favorite stocks. "This is a real-time revolution," Amanat declares brightly as he walks me through a vast room in midtown Manhattan where row after row of guys (Tradescape's female clients tend to trade from home) are glued to their computer screens as if they were videogames."
- "One of the hottest private money managers around, Bowman runs $4.6 billion from his office in Silicon Valley, much of it from suddenly wealthy executives at high-tech companies just a few miles away."
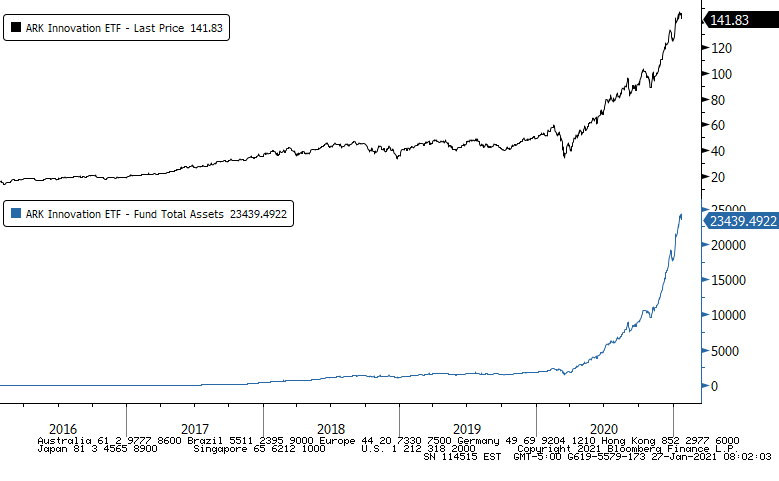
That last one is worth keeping in mind when looking at the rush to invest with Ark.
A little over a year after that Fortune article, Barron's published "Bowman's Breakup," and Fortune followed up a few years later with "Tech's erstwhile hedge fund king closes up shop."