Data &
Technology
Research
Reports
Report Solutions
Reports Library
Actionable
Strategies
Free
Resources
Simple Backtest Calculator
Simple Seasonality Calculator
The Kelly Criterion Calculator
Sentiment Geo Map
Public Research Reports
Free Webinar
Pricing
Company
About
Meet Our Team
In the News
Testimonials
Client Success Stories
Contact
Log inLoginSign up
< BACK TO ALL REPORTS

What's the Market Message from Stocks in Defensive Sectors?

Dean Christians
2021-01-28
Defensive sectors are notorious for underperforming during bull markets. What's the market message when the defensive sector members outperform in unison as the market hovers near new highs?

In recent notes, I've shared two risk-off methodologies I use to manage portfolio risk. I want to highlight another measure in today's post. The process identifies instances when traditionally defensive sector members outperform the broad market as the S&P 500 Index hovers near highs.

Defensive Sector Composite Indicator

The Defensive sector composite utilizes the percentage of members outperforming the S&P 500 Index on a rolling 21-day basis across four groups. 

The composite includes the following:

  • Percentage of Consumer Staple Members Outperforming the S&P 500 Index 
  • Percentage of Health Care Members Outperforming the S&P 500 Index 
  • Percentage of Utility Members Outperforming the S&P 500 Index 
  • Percentage of S&P 500 Members Outperforming the S&P 500 Index 

I calculate the composite by measuring the difference between each sector series and the S&P 500 series. I then count the number of groups with a spread above a user-defined threshold. The threshold for this model is plus two or above. 

Defensive Sector Composite Signal

The Defensive sector composite risk-off signal seeks to identify the following conditions.

  1. The composite crosses above 2.99. i.e., defensive sector members are outperforming the broad market.
  2. If condition one, start days since true count.
  3. If days since condition one count is <= 15 and the S&P 500 Index crosses below the price range rank of 87%, and the S&P 500 Index is down less than 2% from a 252-day high, signal risk-off.
  4. The signal resets on a cross below 0.99. i.e., a new signal can't occur until the reset condition is true.

    Note: The range rank for the S&P 500 uses a 63-day lookback period. 

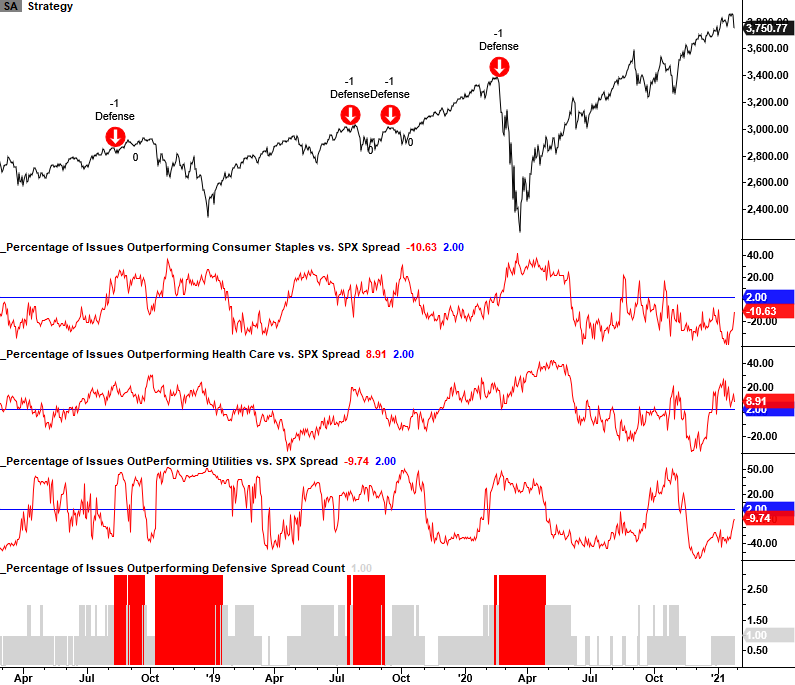
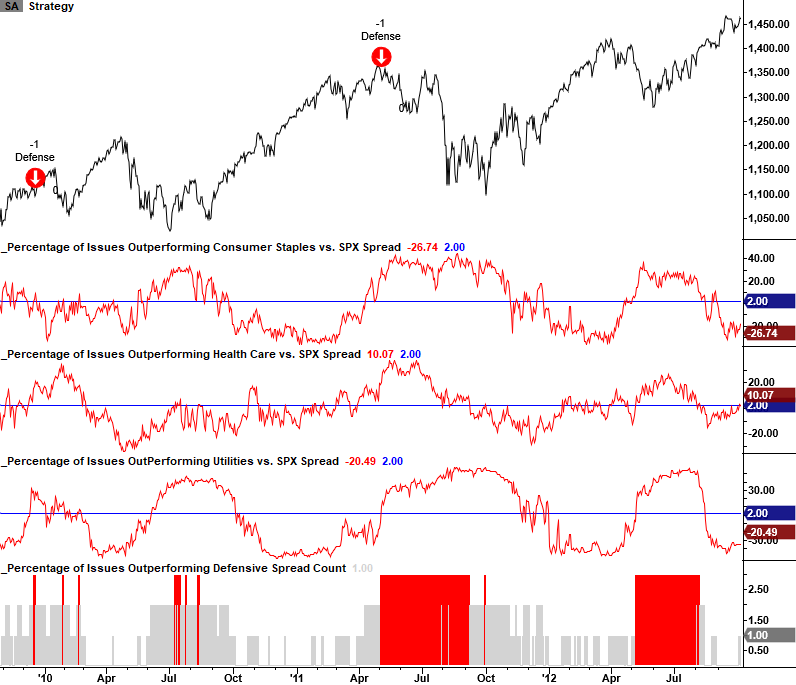
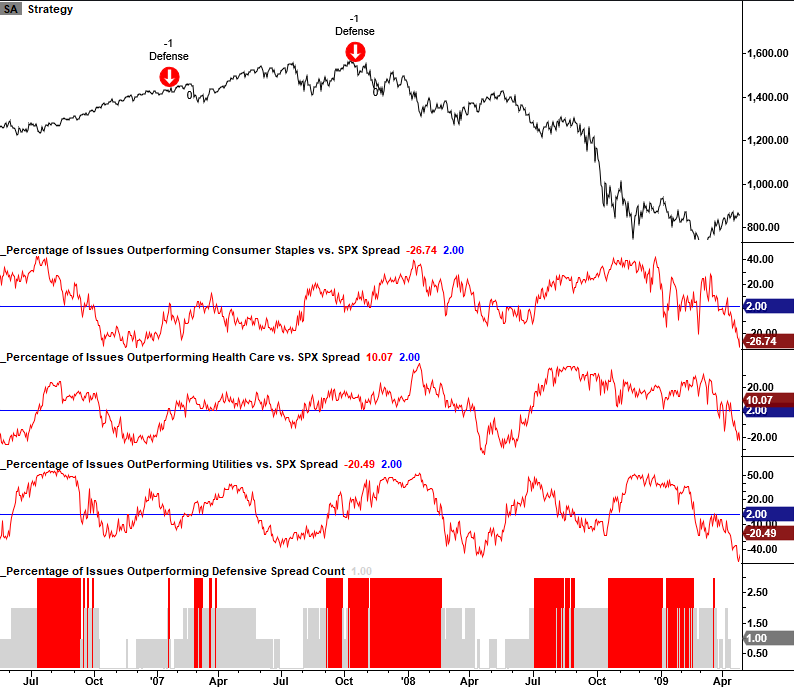
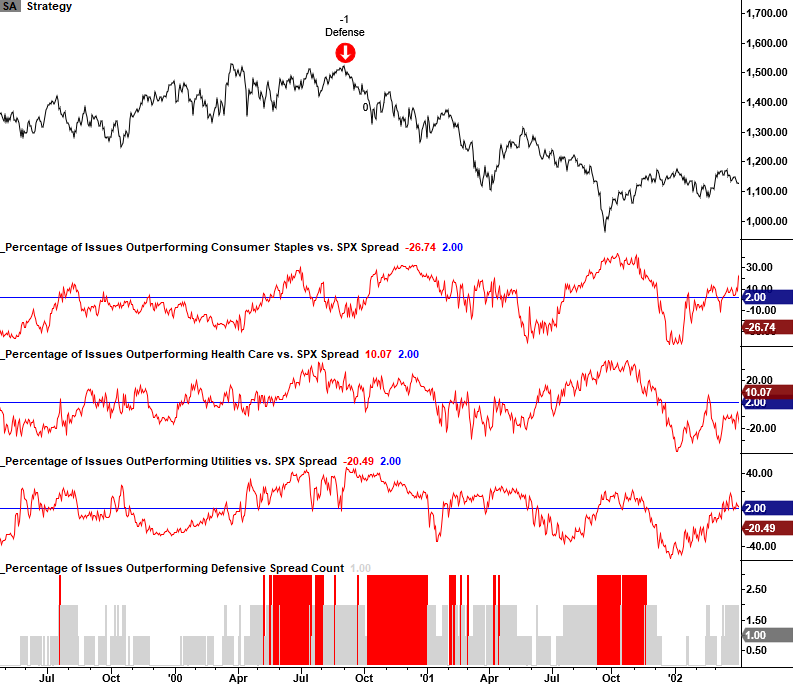
Current Chart and Historical Signals 

The composite count remains below the threshold signal level. With the S&P 500 down greater than 2% from the most recent high, it's unlikely that a signal would trigger if the S&P 500 Index continues to correct from current levels.
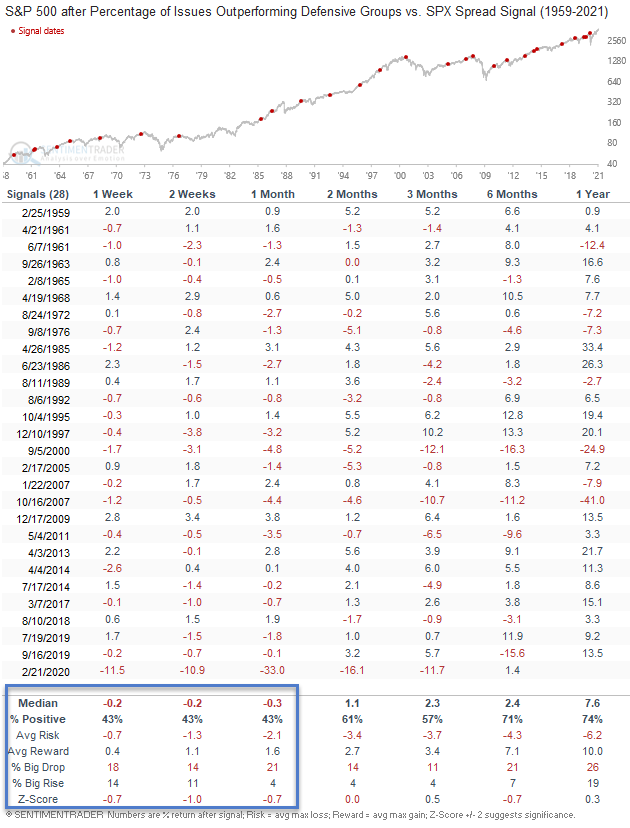


Signal Performance

As one can see in the table below, performance is fairly weak in the 1-4 week timeframe.

Conclusion: Investors have not embraced a defensive risk-off mode as measured by the composite model count. If and when a signal occurs, I want to see several other risk-off models trigger around the same time. By utilizing a weight-of-the-evidence approach, one can avoid the pitfalls associated with individual signal failures.

Sorry, you don't have access to this report

Upgrade your subscription plan to get access
Go to Dasboard
DATA &
TECHnologies
IndicatorEdge
‍
BackTestEdge
‍
Other Tools
‍
DataEdge API
RESEARCH
reports
Research Solution
‍
Reports Library
‍
actionable
Strategies
Trading Strategies
‍
Smart Stock Scanner
‍
FREE
RESOUrCES
Simple Backtest
Calculator
Simple Seasonality
Calculator
The Kelly Criterion
Calculator
Sentiment Geo Map
‍
Public Research Reports
‍
Free Webinar
COMPANY
‍
About
‍
Meet our Team
‍
In the News
‍
Testimonials
‍
Client Success Stories
Pricing
Bundle pricing
‍
Announcements
‍
FAQ
© 2024 Sundial Capital Research Inc. All rights reserved.
Setsail Marketing
TermsPrivacyAffiliate Program
Risk Disclosure: Futures and forex trading contains substantial risk and is not for every investor. An investor could potentially lose all or more than the initial investment. Risk capital is money that can be lost without jeopardizing ones’ financial security or life style. Only risk capital should be used for trading and only those with sufficient risk capital should consider trading. Past performance is not necessarily indicative of future results.

Hypothetical Performance Disclosure: Hypothetical performance results have many inherent limitations, some of which are described below. No representation is being made that any account will or is likely to achieve profits or losses similar to those shown; in fact, there are frequently sharp differences between hypothetical performance results and the actual results subsequently achieved by any particular trading program. One of the limitations of hypothetical performance results is that they are generally prepared with the benefit of hindsight. In addition, hypothetical trading does not involve financial risk, and no hypothetical trading record can completely account for the impact of financial risk of actual trading. for example, the ability to withstand losses or to adhere to a particular trading program in spite of trading losses are material points which can also adversely affect actual trading results. There are numerous other factors related to the markets in general or to the implementation of any specific trading program which cannot be fully accounted for in the preparation of hypothetical performance results and all which can adversely affect trading results.

Testimonial Disclosure: Testimonials appearing on this website may not be representative of other clients or customers and is not a guarantee of future performance or success.