
Relative Ratio Relationships as a Risk-On or Off Signal

I use several relative ratio relationships to monitor market participates risk appetite. Risk appetite is often a reflection of whether economic growth will accelerate or decelerate. When economic conditions are accelerating, capital tends to flow to more risky groups. Conversely, when conditions are decelerating, capital moves to more stable groups. In today's note, I want to share how I use relative ratios to identify risk-on or off conditions for the S&P 500.
Relative Ratio Methodology
The method I use to identify relative ratio signals is simple. I calculate the ratio for two securities and measure the range over a lookback period in percentage terms. By measuring the ratio range, I now have an indicator with a scale of 0-100%, from which I can use a bracket methodology to generate signals.
Methodology Sample Chart and Signal
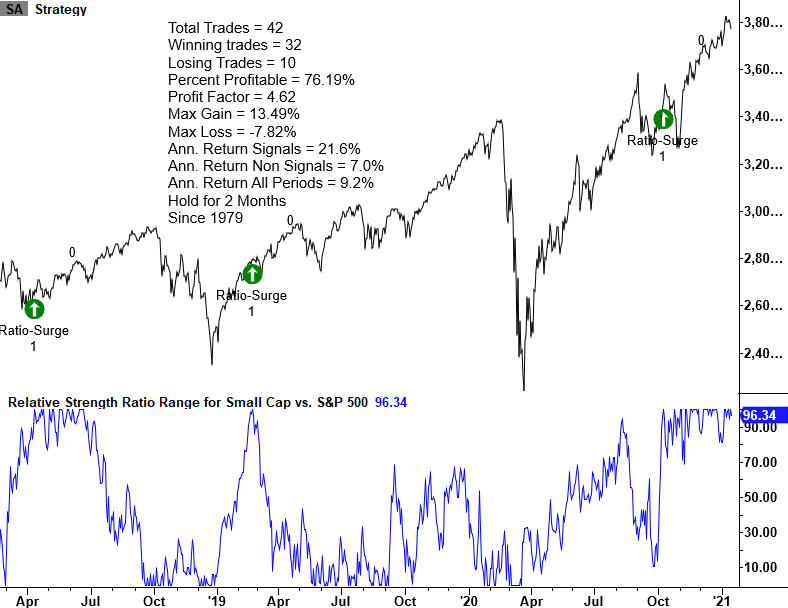
The following model buys the S&P 500 when the 4-month ratio range for small-cap vs. large-cap crosses above 98.75% after a reset below 1%.
Relative Ratio Relationships
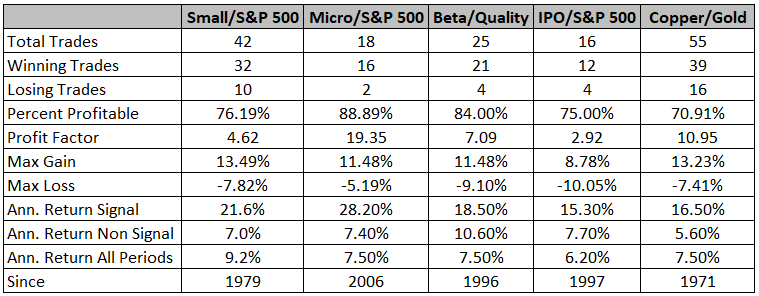
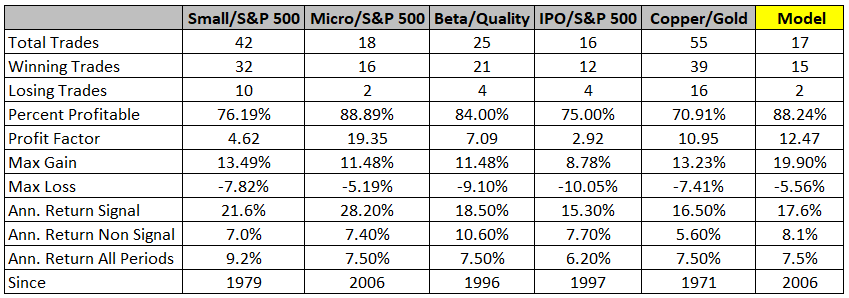
The following table contains trading statistics for buying the S&P 500 when various relative ratio relationships issue a signal.
It includes the following:
- Small-cap vs. S&P 500
- Micro-cap vs. S&P 500
- High Beta vs. Quality
- IPO Index vs. S&P 500
- Copper vs. Gold
Please note, I optimized each ratio for the best lookback period range and bracket crossover levels. As one can see, the S&P 500 does very well when buy signals are triggered.
Risk-On or Off Composite Model and Strategy
While each relative ratio signal could be utilized in isolation to identify risk-on conditions for the S&P 500, I like to use a weight-of-the-evidence approach by combining all the relationships into a single composite model. As the Japanese proverb states, "A single arrow is easily broken, but not ten in a bundle."
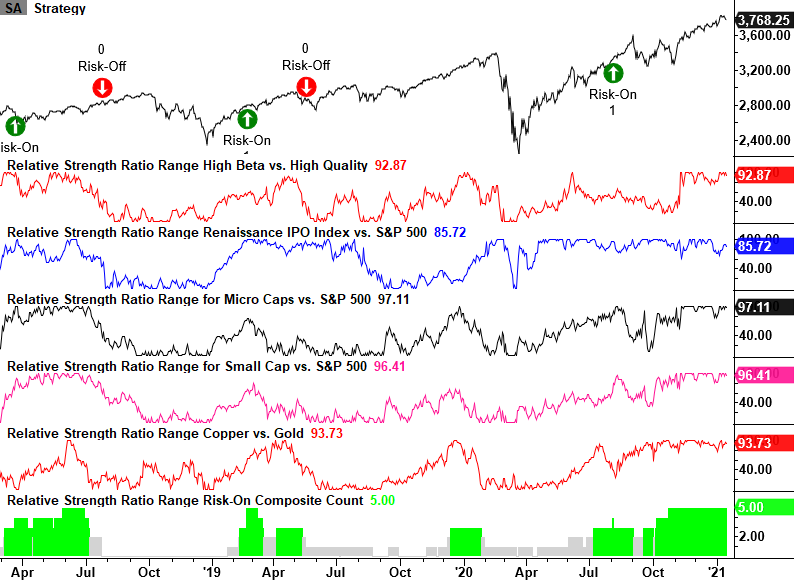
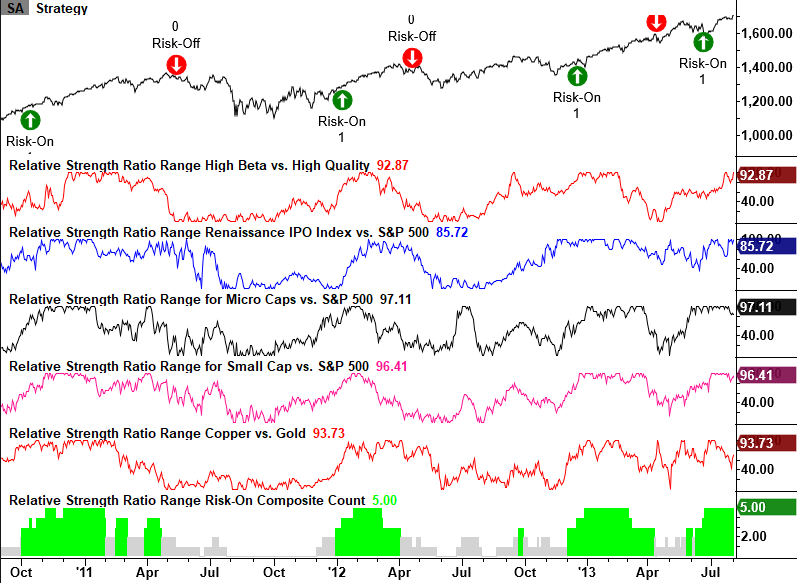
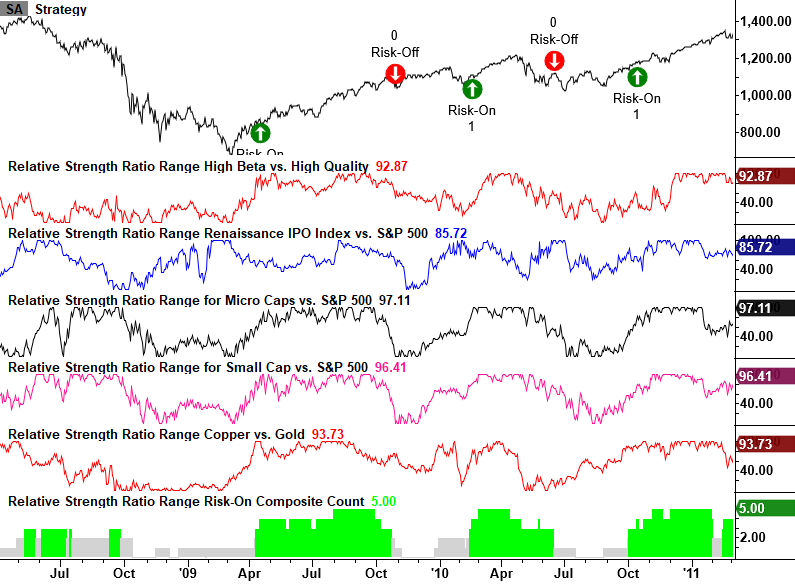
I construct the composite by measuring the 4-month relative ratio range for each relationship. I then count the number of groups in the 75th percentile or greater over a 10-day lookback period. The composite will range from 0-5 and issue a buy signal when it crosses above 3.99. Sell signals occur when the composite crosses below 1. Let's take a look at some chart examples with the composite model signals.
Composite Model Signals
Composite Model Performance Results
As the last column in the table below shows, when the composite model issues a buy signal, forward returns for the S&P 500 are robust.
Risk-Off Signal
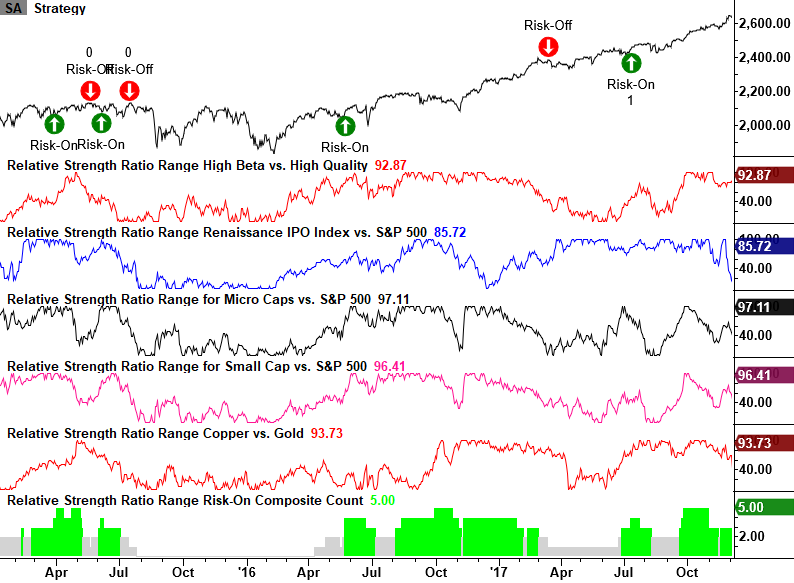
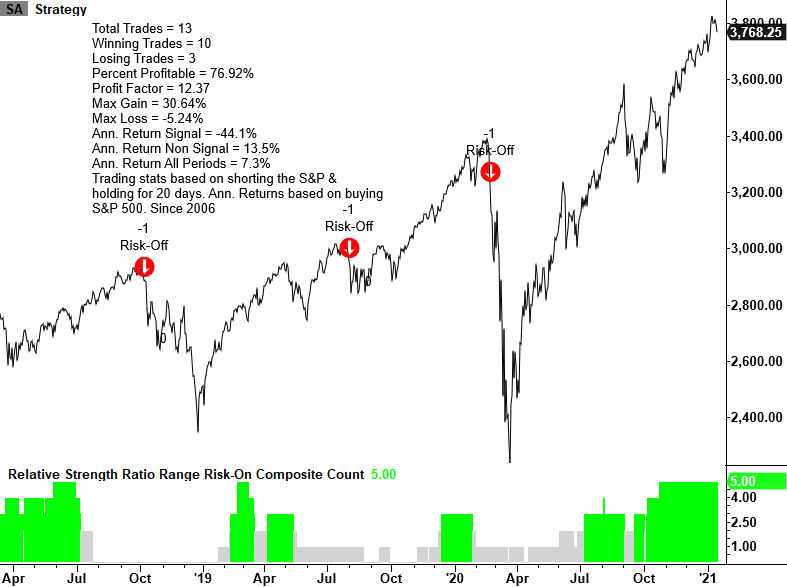
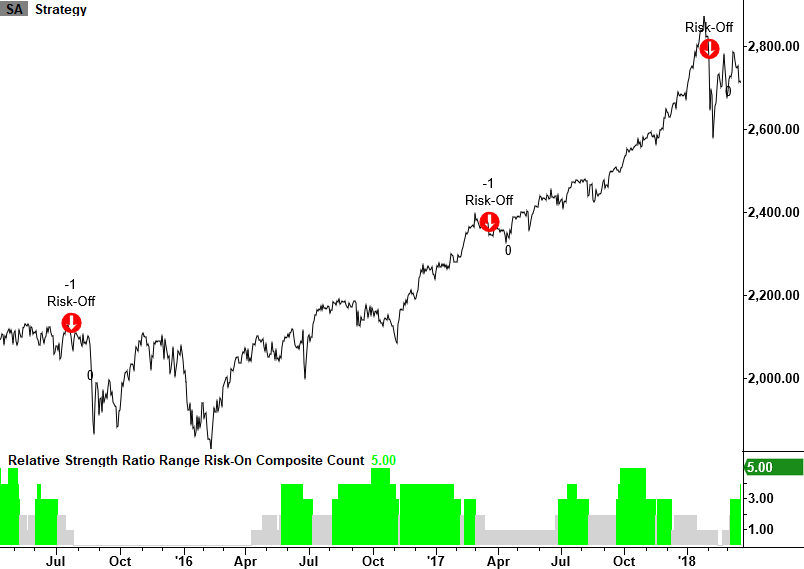
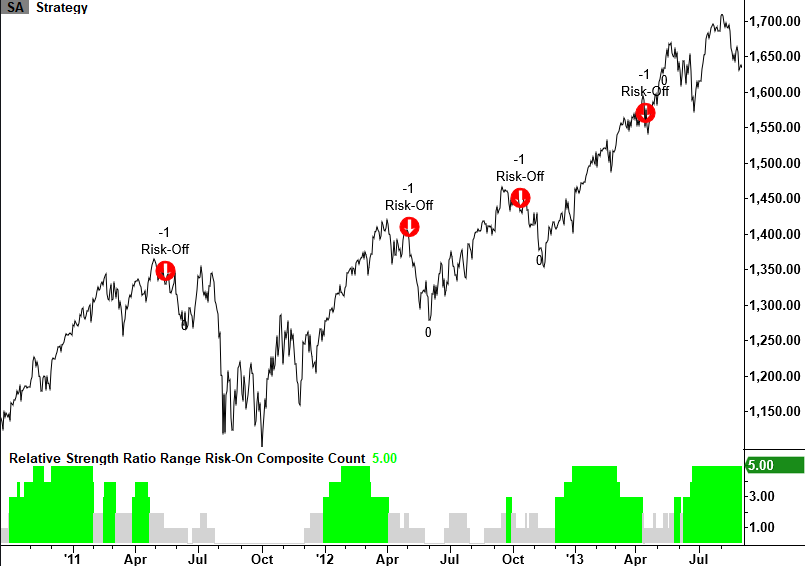
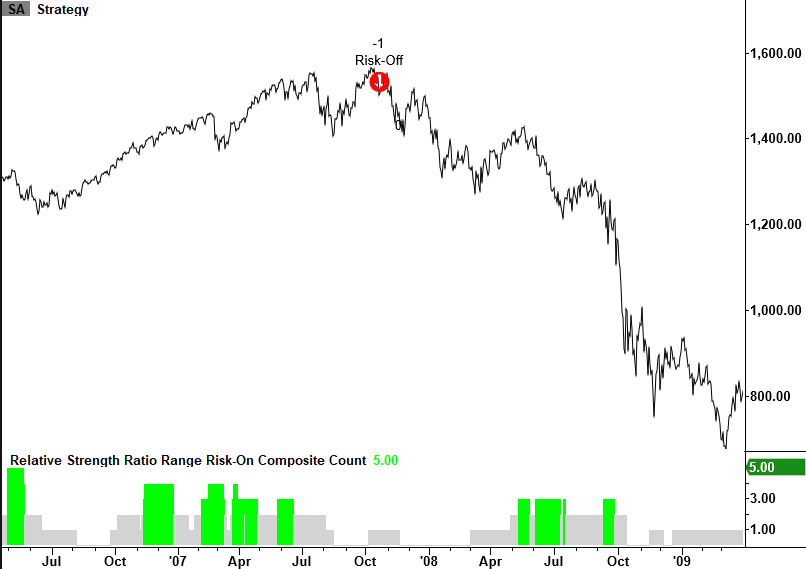
The following charts contain a risk-off signal I created using the same composite model in the previous study. The risk-off signal occurs under the following conditions.
- The composite model count resets above 2.99
- The Composite model count <= 1
- The 3-month price range for the S&P 500 crosses below the 75th percentile (the S&P is breaking down)
- The S&P 500 is down <= 5% from a 252-day closing high
Conclusion: Relative ratio relationships are an excellent way to monitor risk appetite. My composite model's current ratio ranges continue to maintain strong readings well above the threshold level for a risk-off signal. Risk appetite remains intact. By some measures, like the speculation in options, there is too much of an appetite, so monitoring these ratios for deterioration along with other markets like high-yield bonds will give a clue that the extremes are starting to matter.