
Regarding February of a Post-Election Year

February of 2021 represents the 2nd month of the Post-Election Year in the 4-Year Election Cycle (I have noticed a few analysts who measure the election cycle looking at 48 months starting the day after the presidential election itself. But I am invoking the "Old Dog, New Tricks" clause and sticking to 48 months based on calendar years).
Is there a way to categorize the typical stock market performance during February of Post-Election Years? Yes, in a word, "Poor", both on an absolute basis and a relative basis. Before proceeding let me detail the data being used to generate the results.
Data
For testing purposes, I am looking at monthly total return data for the following 11 sectors on a month-by-month basis:
- Consumer Staples
- Consumer Discretionary
- Industrials
- Energy
- Materials
- Technology
- Telecommunications
- Utilities
- Health Care
- Financials
- REIT
From 1990 through 2020 we will use the S&P 500 sector data for each of the above sectors. From 1929 through 1989 we will use Fama French data for the equivalent sectors.
For each of the 48 months of the election cycle I looked at the average return for all sectors during that particular month (#1 for January of the Post-Election year to #48 for December of the Election Year) starting in January 1929 (the first month of the Post-Election year of 1929) through December 2020. This represents a total of 23 completed 4-year election cycles.
Heretofore we will refer to February of the Post-Election Year simply as "Month 2". Now let's consider the performance of Month 2 across every 4-year Election Cycle from 1929 through 2020.
- In terms of "average monthly return" Month 2 ranked 47 out of 48 months at -1.10% (the worst was Month 21, i.e., September of the Mid-Term election year, at -1.21%).
- Month 2 was also one of only two months (again the other was Month 21) that saw all 11 industry sectors average a loss. See the table below.
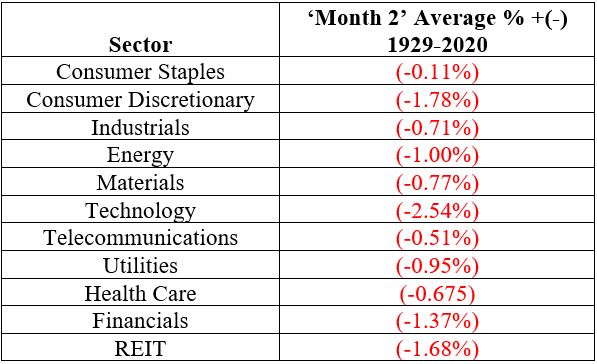
In fairness, it should be pointed out that not every industry sector loses ground in every Year 2. But over the course of 23 4-year election cycles each of the sectors averaged a net loss during Month 2.
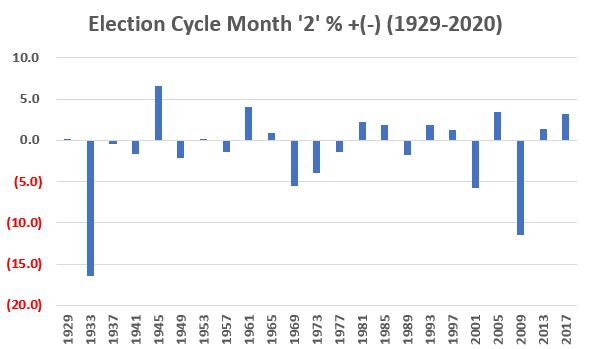
The chart below shows the Month 2 % +(-) average for all sectors combined for each 4-year cycle.
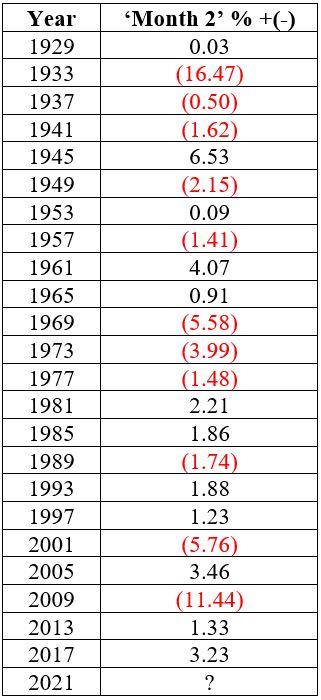
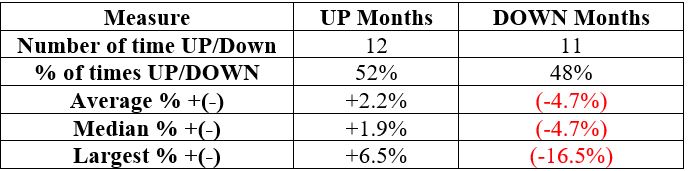
The table below displays the numbers associated with the previous chart.
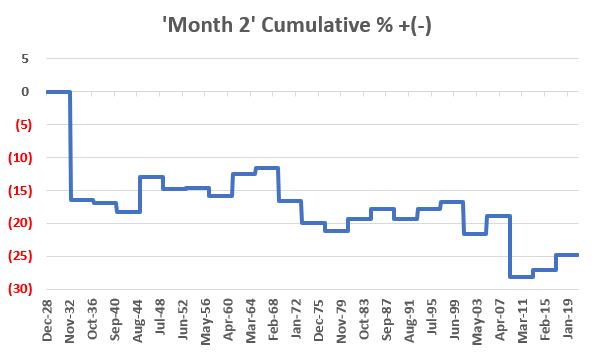
The chart below displays the cumulative return of the average for all sectors in Month 2 since 1929.
Despite all of this apparent negativity, it should be recognized that Month 2 showed a positive return in 12 out of 23 4-year cycles since 1929. So, you should NOT assume that February of 2021 is "doomed" to be a bad month for stocks. What you DO need to recognize is that when Month 2 is "Good" it is OK. And when Month 2 is bad it is often very bad. The numbers tell the tale.
Is the stock market going to "take a breather" (or worse) in the month of February? That's up to each investor to decide for themselves. The "catch" regarding seasonality is that there is never any guarantee that any given seasonal trend will work "this time around." Still, history does suggest that if this rip-roaring bull is ever going to pause, February might be as likely a time as any.